
When a magnitude 8.8 earthquake ruptured the Kuril-Kamchatka subduction zone on July 29, it triggered a massive tsunami that raced silently across the Pacific. For decades, events like this have been tracked by DART buoys—deep-ocean sensors anchored to the seafloor. But this time, something unprecedented occurred.
The Surface Water and Ocean Topography (SWOT) satellite, a joint mission from NASA and the French space agency CNES, happened to pass overhead during the tsunami’s peak. Designed to monitor the Earth’s surface water, SWOT recorded a high-resolution satellite image of the tsunami’s full wave field, offering a first-of-its-kind perspective that challenges decades of scientific assumptions.
Instead of a clean, cohesive wavefront, the satellite detected a braided, fragmented energy pattern that extended across hundreds of miles. This level of detail—impossible to capture with traditional sensors—revealed how large tsunamis may behave in complex and previously misunderstood ways.
The findings, published in The Seismic Record, could fundamentally alter how scientists model tsunamis, issue early warnings, and prepare coastal communities for impact.
Satellite Imaging Challenges Old Tsunami Models
Launched in December 2022, SWOT was never built for disaster response. It was created to map global rivers, lakes, and ocean topography using Ka-band radar interferometry—scanning 120-kilometer-wide swaths of sea surface with sub-centimeter precision. But this mission accidentally became the first to capture a full satellite view of a tsunami in open ocean.
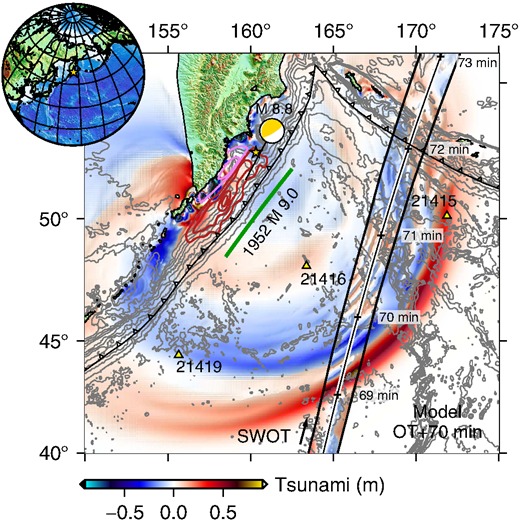 Propagation of the 2025 tsunami across the Pacific Basin with arrival times (in minutes) at DART buoys and the SWOT satellite’s overpass path. Credit: The Seismic Record
Until now, the NOAA-operated DART system has been the gold standard for tsunami detection. These buoys provide highly sensitive sea-level data, but only at specific points across the ocean. SWOT, by contrast, delivered a continuous two-dimensional view, capturing how the tsunami evolved spatially and temporally.
“We could only see the tsunami at specific points in the vastness of the ocean,” said Angel Ruiz-Angulo, lead author of the study and a researcher at the University of Iceland. “Now, with SWOT, we can capture a swath up to about 120 kilometers wide, with unprecedented high-resolution data of the sea surface.”
The satellite imagery showed the tsunami wave field breaking apart and recombining mid-ocean—clear signs of wave dispersion. When the research team ran numerical simulations including dispersion physics, the results closely mirrored the satellite’s observation. Models that ignored dispersion failed to match what actually happened.
Understanding Tsunami Dispersion and Wave Behavior
For years, most tsunami models have treated large waves as non-dispersive shallow-water waves, where the wave energy travels uniformly. This simplification allowed for faster predictions and easier risk calculations—but SWOT has exposed its limitations.
In this event, dispersion mattered. The wave energy didn’t stay in a tight packet—it split, scattered, and re-formed over time and space. That matters for coastlines, where delayed or trailing waves can influence run-up height, arrival time, and force of impact.
 Synthetic tide gauge data simulated along the SWOT nadir track, showing the complexity and modulation of wave heights over time and space. Credit: The Seismic Record
“This extra variability could represent that the main wave could be modulated by the trailing waves as it approaches some coast,” Ruiz-Angulo explained. “We would need to quantify this excess of dispersive energy and evaluate if it has an impact that was not considered before.”
This isn’t just a matter of refining models. It’s about improving real-world tsunami risk assessments. If coastal warnings are based on oversimplified assumptions, they may underestimate danger in critical areas, especially near harbors or complex shorelines where timing and wave interference matter most.
Combining Satellites, Buoys, and Seismic Data
The SWOT pass also helped clarify the earthquake rupture mechanics behind the tsunami. Two DART buoys detected wave arrivals that didn’t match forecasts—one recorded the wave earlier, the other later. By integrating satellite swath data from SWOT, DART buoy readings, and seismic/geodetic models, researchers were able to revise the estimated rupture length from 300 to roughly 400 kilometers, extending farther south than initially assumed.
This form of data fusion—combining surface altimetry, deep-ocean sensors, and seismic input—offers a powerful new model for tsunami science. In the future, multi-source real-time integration could improve forecasts not just after the fact, but potentially during live events.
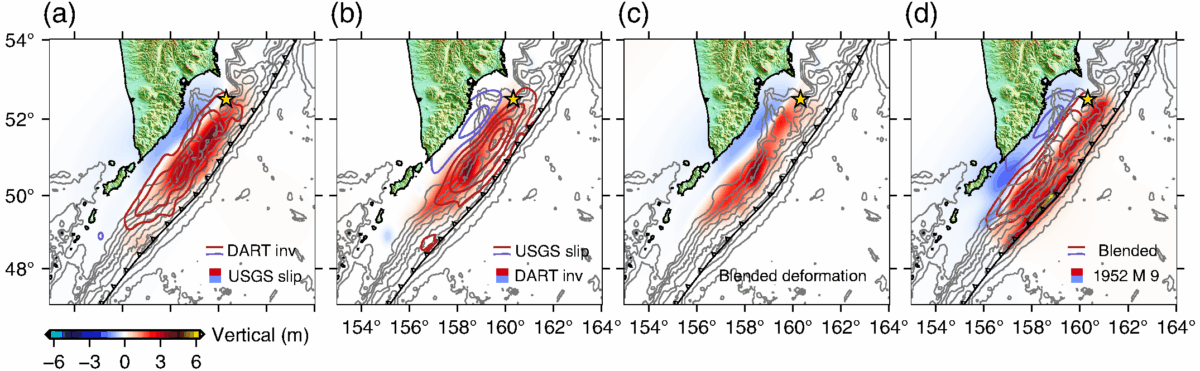 Comparison of vertical deformation and slip models derived from USGS, DART inversion, and blended datasets. The final blended model extends farther south than initial estimates. Credit: The Seismic Record
Co-author Diego Melgar, a geophysicist at the University of Oregon, noted that tsunami data still holds untapped potential for source modeling. “It is really important we mix as many types of data as possible,” he said in the published study.
The improved rupture model highlights how SWOT’s measurements can help bridge the gap between surface wave behavior and subsurface earthquake dynamics, delivering sharper and faster hazard assessments.
A Turning Point in Tsunami Forecasting
The 2025 Kuril-Kamchatka tsunami was a rare alignment of nature and orbit. SWOT wasn’t built to monitor disasters—but it might now redefine how scientists understand them. With growing concerns over coastal vulnerability, sea level rise, and tectonic risk zones, the demand for faster, more accurate tsunami warnings is intensifying.
 Comparative Tsunami Energy Release From The 2025 M8.8 And 1952 M9.0 Kamchatka Earthquakes. Credit: The Seismic Record
If future satellite constellations are engineered to prioritize ocean surface mapping with real-time delivery, they could provide the missing link in tsunami early warning systems. SWOT’s success has opened that door.
The bigger lesson is clear: tsunami models need to evolve. Dispersion can no longer be treated as negligible. Waves are not just pulses—they are complex, shifting fields of energy, shaped by physics we’re only beginning to understand at this scale.