The “right” safe starting withdrawal rate is a moving target, depending on equity valuations, bond yields, prospects for inflation, and a retiree’s own life expectancy and asset allocation, among other factors.
Morningstar’s 2025 retirement income research suggests that 3.9% is the highest safe starting withdrawal rate for retirees seeking a consistent level of inflation-adjusted spending from year to year, assuming a 90% probability of having funds remaining at the end of an assumed 30-year retirement period. As in the past, we incorporated forward-looking asset-class return and inflation assumptions to arrive at a starting safe withdrawal rate for new retirees, excluding Social Security or other nonportfolio income sources.
Dig into the research: Read the full State of Retirement Income report
Our “base case” safe withdrawal rate is up slightly from the starting safe withdrawal percentage of 3.7% we estimated in last year’s report. (The base case estimates for starting safe withdrawal rates for a new retiree with a 30-year horizon with a 90% probability of success were 3.3% in 2021, 3.8% in 2022, and 4.0% in 2023.) However, these numbers aren’t meant to imply that people who are already retired should shift their spending up or down from year to year; rather, they represent our best estimate of the starting safe withdrawal rate for a person currently embarking on retirement.
In addition, new retirees don’t have to settle for such a low number—and arguably shouldn’t. Our research concluded that those who are willing to tolerate some fluctuations in their spending can start with a withdrawal rate of nearly 6%. The right level of flexibility in a retiree’s spending system will depend on the individual’s tolerance for spending changes, including the extent to which fixed expenses are covered by nonportfolio income sources.
To help illustrate the interplay between portfolio spending and income from other sources, our research delved into several scenarios involving Social Security and annuities. We found that decisions to enlarge income from other sources, like delaying Social Security, pair well with flexible withdrawal strategies. At the same time, a consistent finding in the research is that enlarging lifetime income generally reduces the amounts available for bequests.
Learn more: How to use Morningstar’s retirement income researchIs 3.9% the New 4.0%?
As in the past, we incorporated forward-looking asset-class return and inflation assumptions to arrive at a starting safe withdrawal rate for new retirees, excluding Social Security or other nonportfolio income sources. Our research takes a forward-looking view because at the outset of retirement, it’s impossible to know what starting withdrawal percentage will be safe over the ensuing 30-year period. Factoring in current conditions can help retirees determine if their starting percentages ought to be higher or lower, as well as the right type of asset allocation given a retiree’s spending plans.
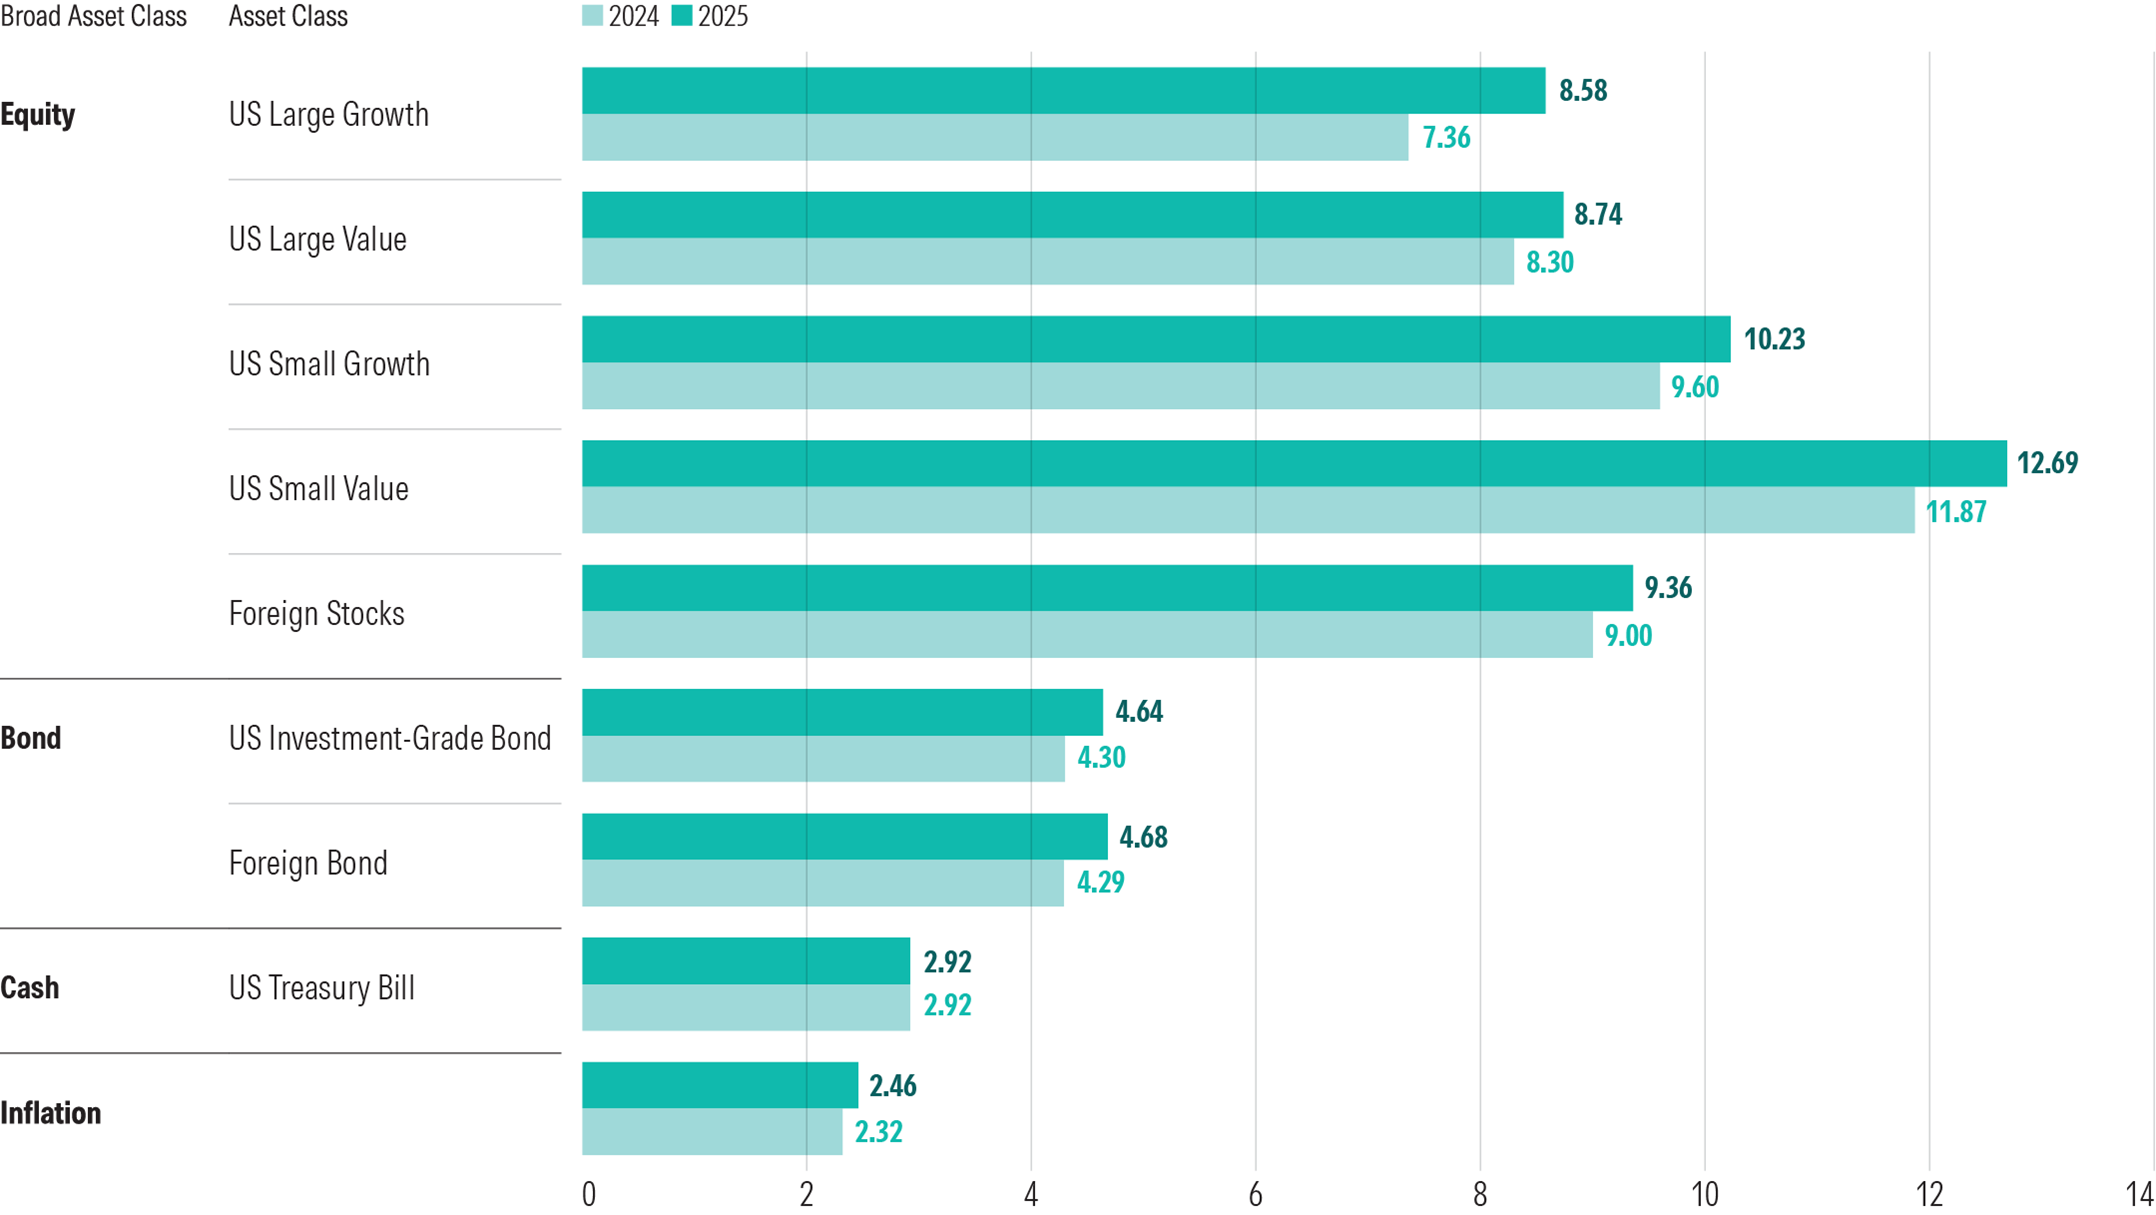
To provide withdrawal-rate guidance that considers current yields, valuations, and inflation, we turned to our colleagues in Morningstar’s Multi-Asset Research team for forecasts on those variables. Like many investment-research groups, the MAR team develops forward-looking asset-class return assumptions, as well as assumptions about the expected volatility of each asset class and future inflation levels. We then extrapolate 30-year forecasts based on the MAR team’s assumptions.
The capital markets assumptions (which are expressed as arithmetic means) employed in this paper have changed modestly since 2024, and mainly in a positive direction. That stems from a methodology change the MAR team recently implemented. Whereas the capital markets assumptions we used in the past were derived from top-down measures like expectations of future earnings growth and valuation contraction or expansion for various market segments, this year’s capital markets assumptions blend those top-down inputs with Morningstar equity analysts’ bottom-up assessments of the companies they cover. While the expected inflation rate increased slightly from 2.29% in 2024 to 2.46% in 2025, expected returns are a bit higher across nearly every asset class thanks to the methodology change.
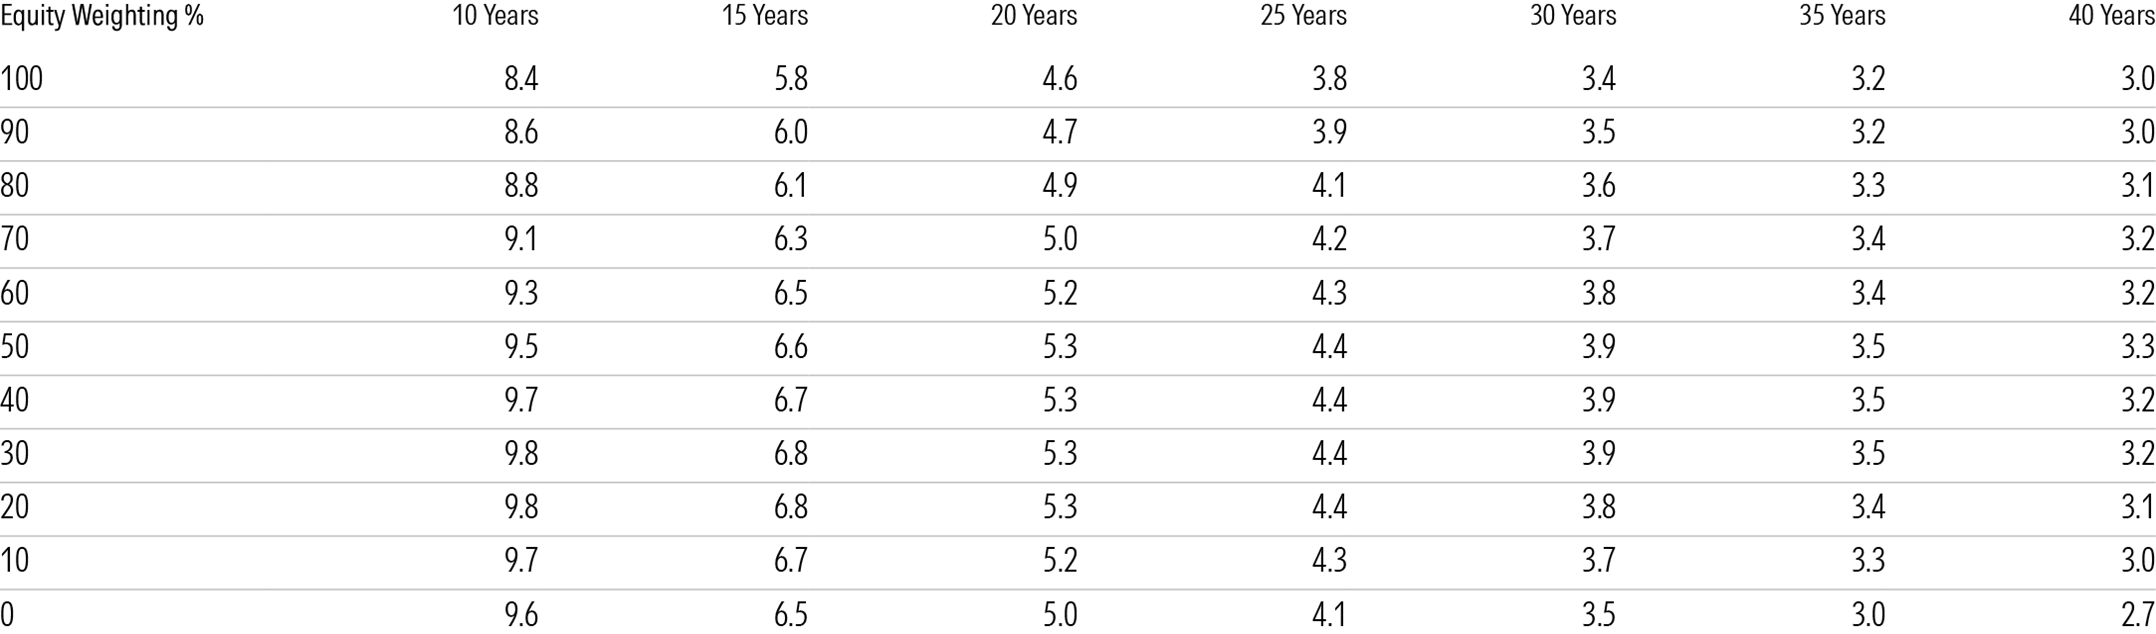
As shown in the table below, we estimate that a new retiree planning for a 30-year time horizon can safely withdraw 3.9% of a portfolio with an equity weighting of between 30% and 50%. Because of the higher volatility associated with higher equity weightings, boosting stocks detracts from the starting safe withdrawal percentage rather than adds to it. The below table also shows the connection between time horizon, asset allocation, and safe withdrawal rates, indicating that older retirees can reasonably spend well more than the 3.9% in our base case, which assumes a 30-year horizon.
We also explored the role of market, inflationary, and spending shocks such as early retirement in this year’s research. We found that retirees who encountered poor returns in the first five years of retirement and didn’t adjust their spending downward were much more likely to exhaust their savings than those who came through the first five years with positive returns. Similarly, we concluded that retirees who encountered high inflation early in retirement were also more likely to prematurely run out of funds unless they took steps to adjust their savings.
How Flexible Strategies Can Help (But Aren’t for Everyone)
Because a 3.9% withdrawal rate—or just $39,000 on a $1 million portfolio—might be a bitter pill to swallow for new retirees, we also examined how flexible strategies can help boost starting safe withdrawal rates. Flexible strategies are effective because they help to prevent retirees from overspending in periods of market weakness, while giving them a raise in stronger market environments.
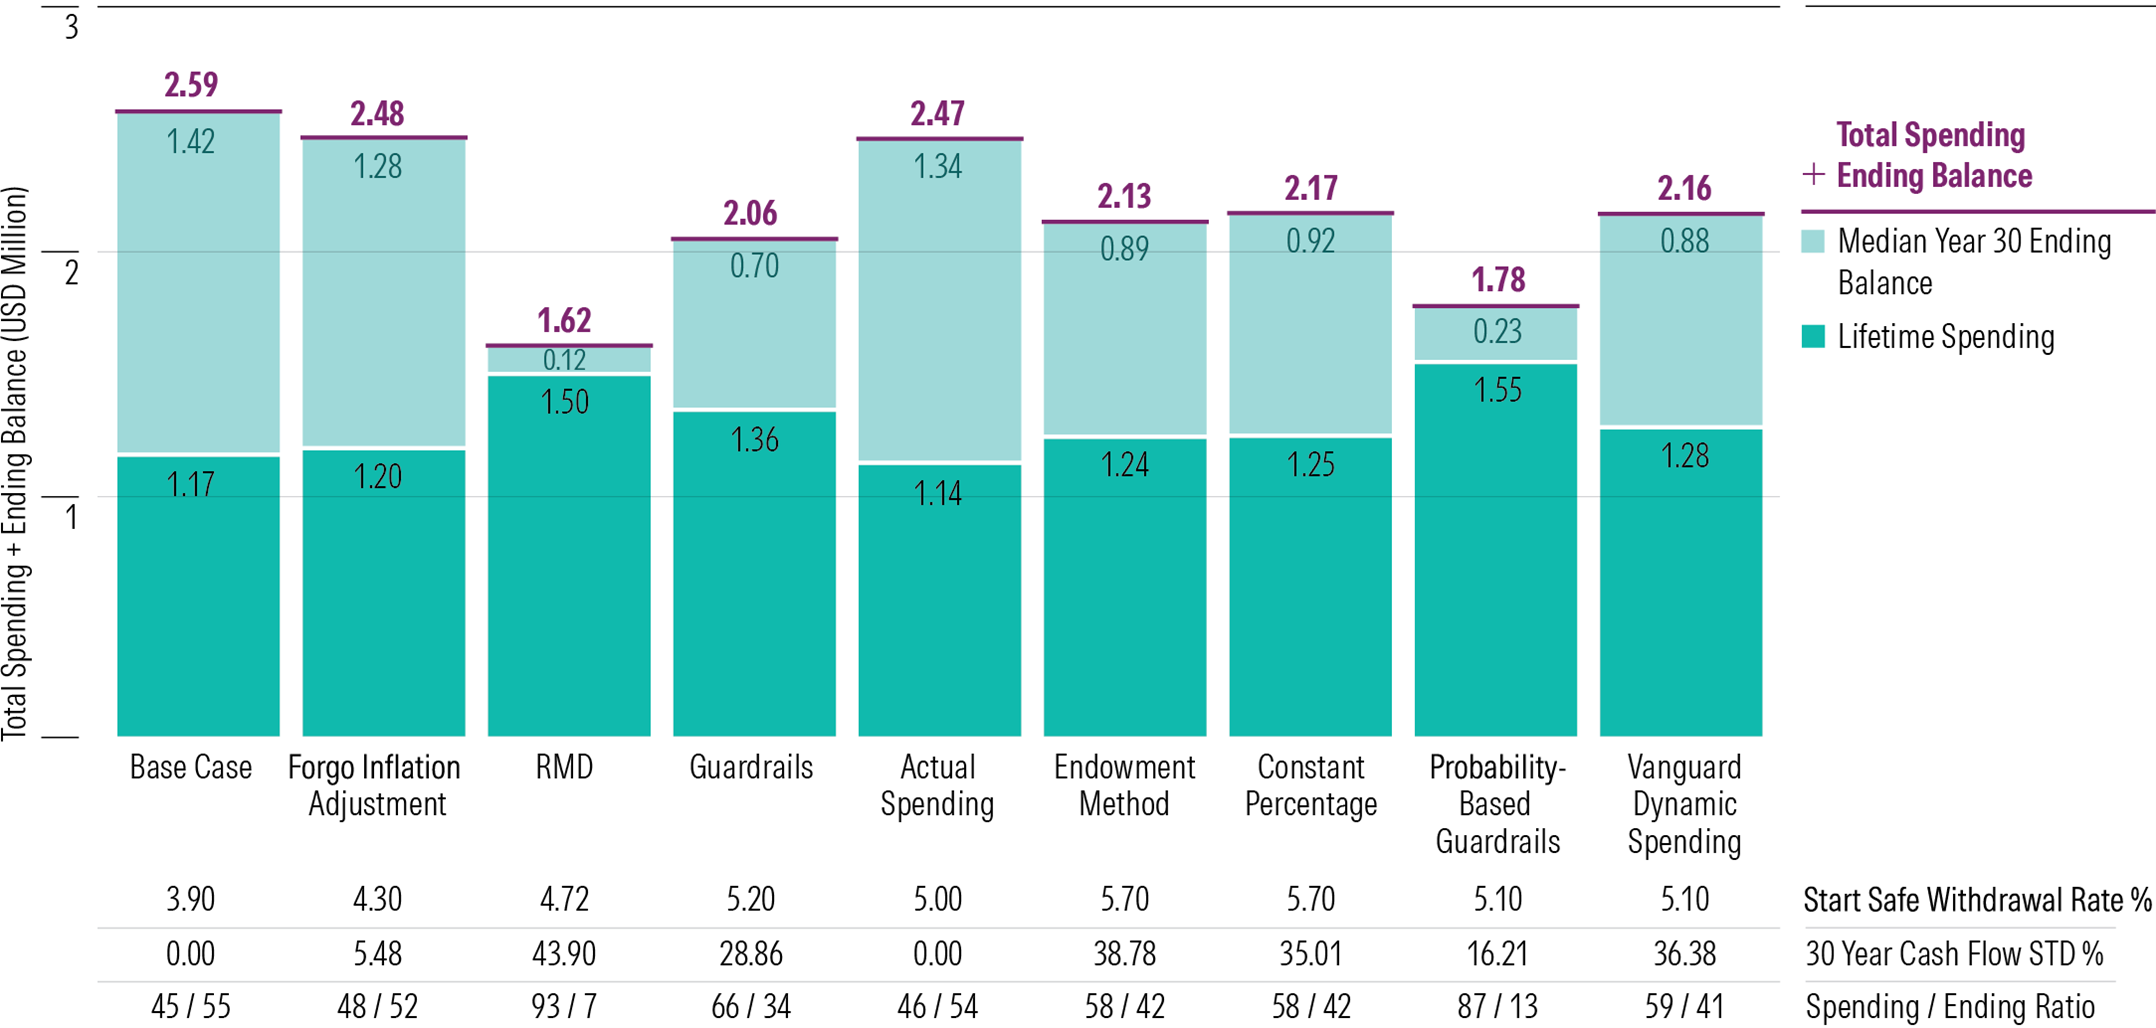
We tested some of the most widely used flexible strategies, benchmarking them against a system of fixed real withdrawals. Each flexible spending method supports a higher initial safe withdrawal rate than the base case (fixed real withdrawal method). The constant percentage and endowment methods support the highest starting safe withdrawal rates across most asset allocations. The constant percentage method simply applies a static percentage withdrawal to each year’s portfolio balance, while the endowment method takes a percentage of the portfolio’s average value over a 10-year period. Both approaches support higher initial withdrawals by making potentially significant year-to-year adjustments to dollar withdrawals, ratcheting down spending when the portfolio value is down.
The below exhibit shows how each of the flexible strategies balances a higher starting safe withdrawal percentage alongside variations in a retiree’s cash flow volatility. In addition, the metric on the bottom line—spending/ending ratio—aims to depict how each strategy balances lifetime spending with bequests.
 7 Steps to Estimating Your In-Retirement Cash Flow NeedsThe Role of Guaranteed Income
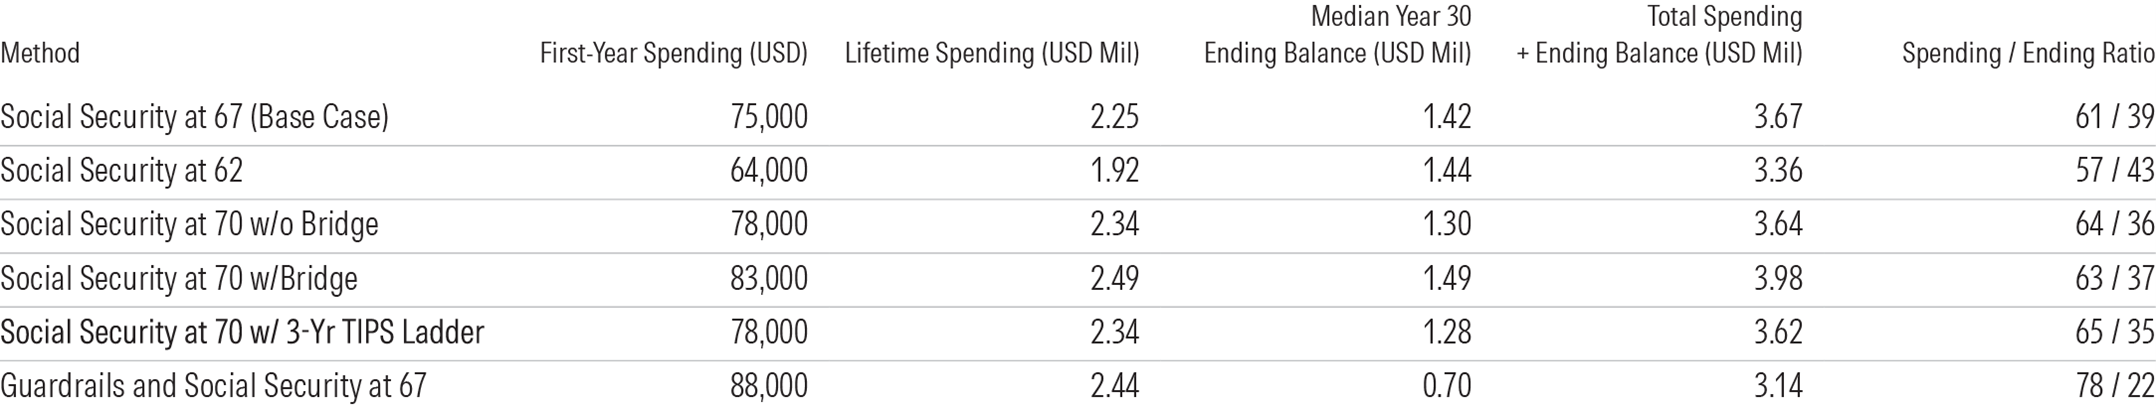
Retirees’ ability to tolerate significant fluctuations in their portfolio withdrawals will depend on how much of their budgets consist of fixed expenses versus discretionary, as well as how much income the retiree has from other sources, especially Social Security.
To highlight the role of guaranteed income, we replace the “safe withdrawal rate” framing used earlier with first-year total spending, which combines the Year 1 portfolio withdrawal with the Social Security amount. For example, in the base case (Line 1), the Year 1 portfolio withdrawal is $39,000 (a 3.9% starting withdrawal percentage) and the Year 1 Social Security benefit is $36,000, for total first-year spending of $75,000.
The results indicate that delaying Social Security is a wise decision for retirees aiming to boost lifetime income: The best-case scenario is if a retiree can delay Social Security and rely on nonportfolio income, such as working income, until Social Security comes online. Moreover, dynamic systems such as the guardrails method we’ve examined in several editions of the paper become more efficient when paired with a substantial, predictable income floor.