
Earlier I posted some questions on my blog for next year: Ten Economic Questions for 2026. Some of these questions concern real estate (inventory, house prices, housing starts, new home sales), and I’ll post thoughts on those in this newsletter (others like GDP and employment will be on my blog).
I’m adding some thoughts, and maybe some predictions for each question.
Here is a review of the Ten Economic Questions for 2025.
9) House Prices: It appears house prices – as measured by the national repeat sales index (Case-Shiller, FHFA, and Freddie Mac) – will be mostly flat in 2025. What will happen with house prices in 2026?
The first question I’m always asked about housing is “What will happen with house prices?” No one has a crystal ball, and it depends on supply and demand.
Last year, I wrote about house prices in 2025:
“I don’t expect national inventory to reach 2019 levels but much of the remaining gap between 2019 and 2024 levels will likely close in 2025. If existing home sales remain fairly sluggish, we might see national months-of-supply above 5 months in mid-2025.
That would likely lead to mostly flat prices nationally in 2025. However, I expect some areas – with higher months-of-supply – will see price decline in 2025.”
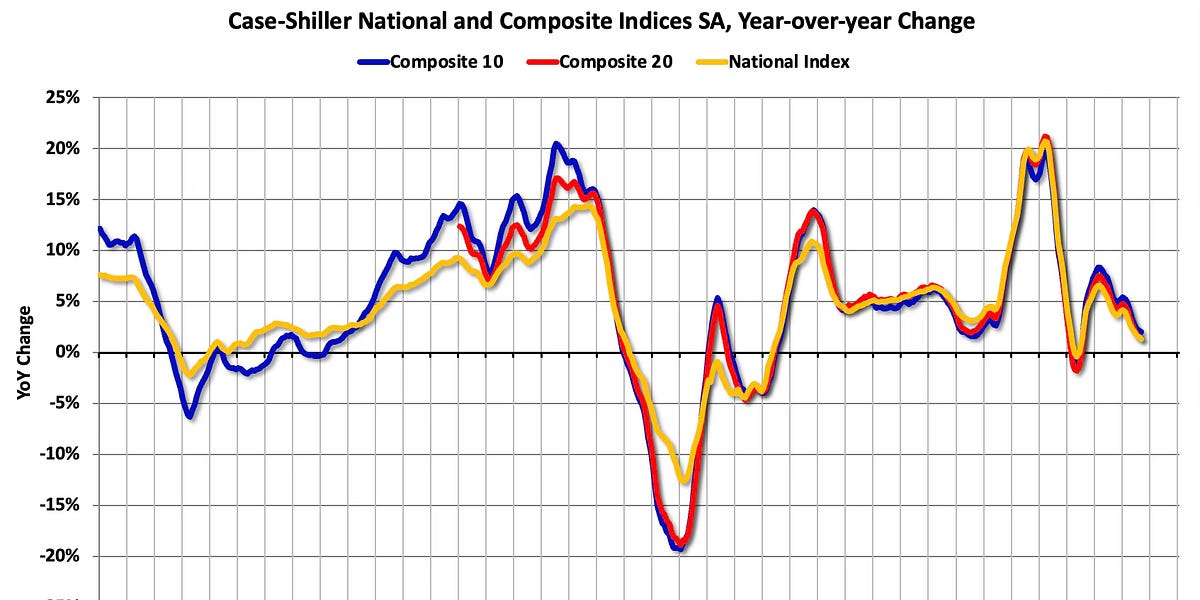
The following graph shows the year-over-year change through September 2025, in the seasonally adjusted Case-Shiller Composite 10, Composite 20 and National indices (the Composite 20 was started in January 2000). The Case-Shiller Home Price Indices for “September” is a 3-month average of July, August and September closing prices. September closing prices include some contracts signed in May, so there is a significant lag to this data.
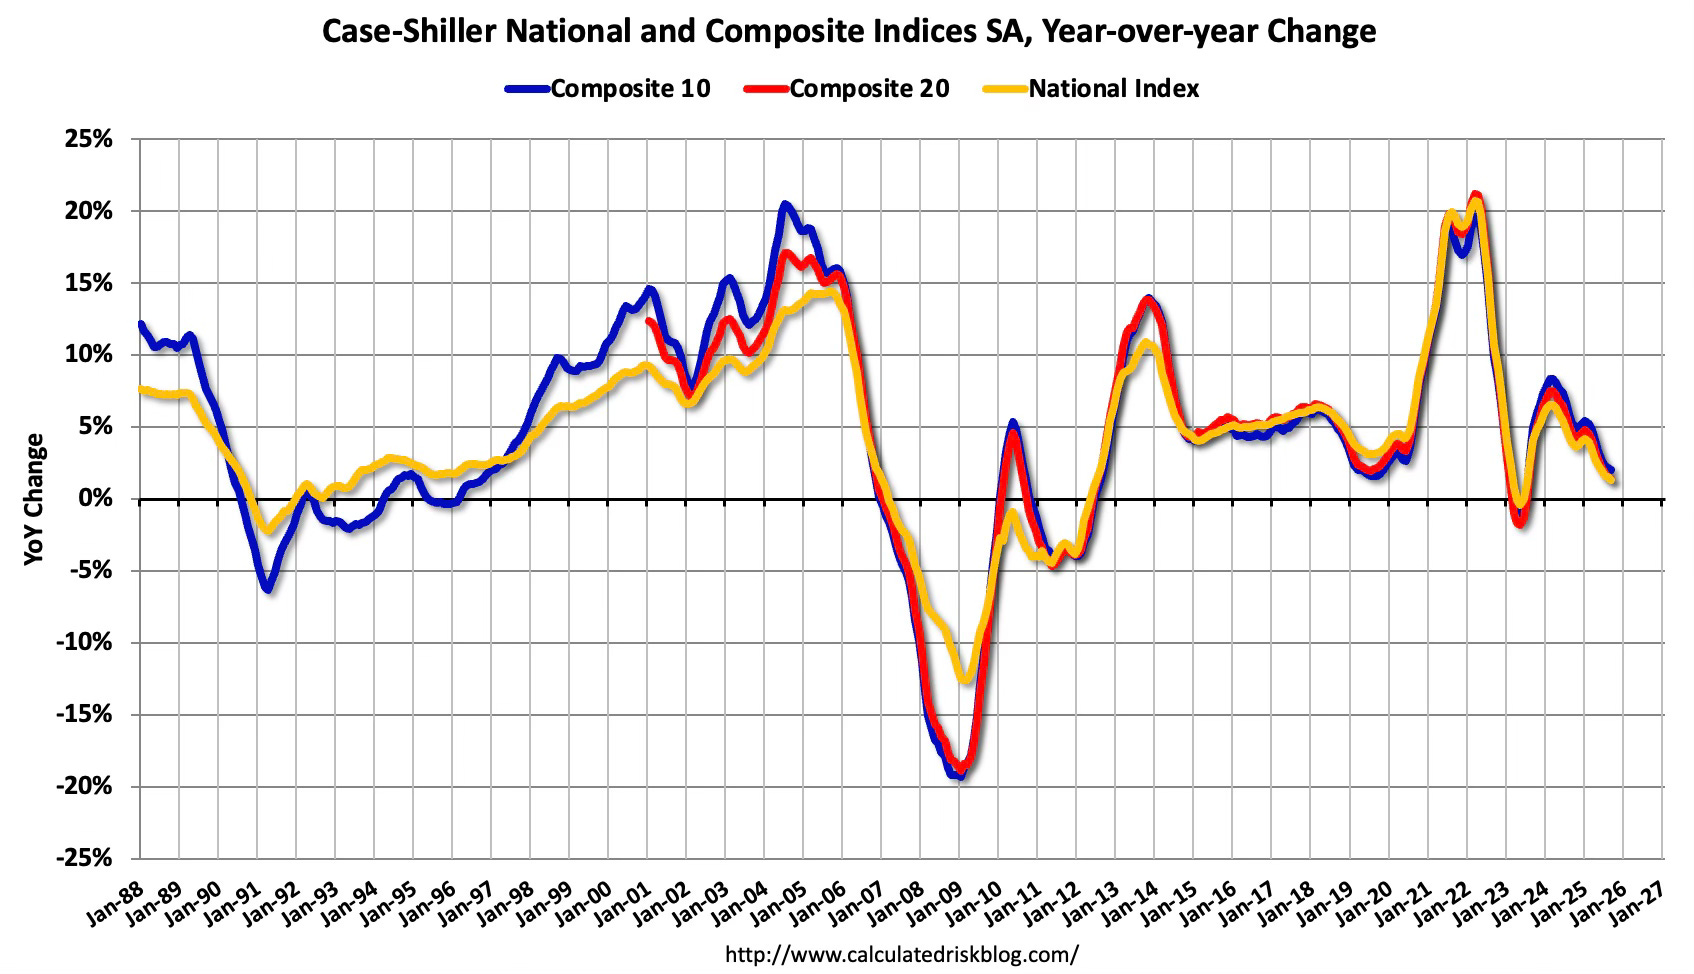
The Composite 10 NSA was up 2.0% year-over-year. The Composite 20 NSA was up 1.4% year-over-year. The National index NSA was up 1.3% year-over-year.
Here is a graph of the month-over-month (MoM) change in the Case-Shiller National Index Seasonally Adjusted (SA).
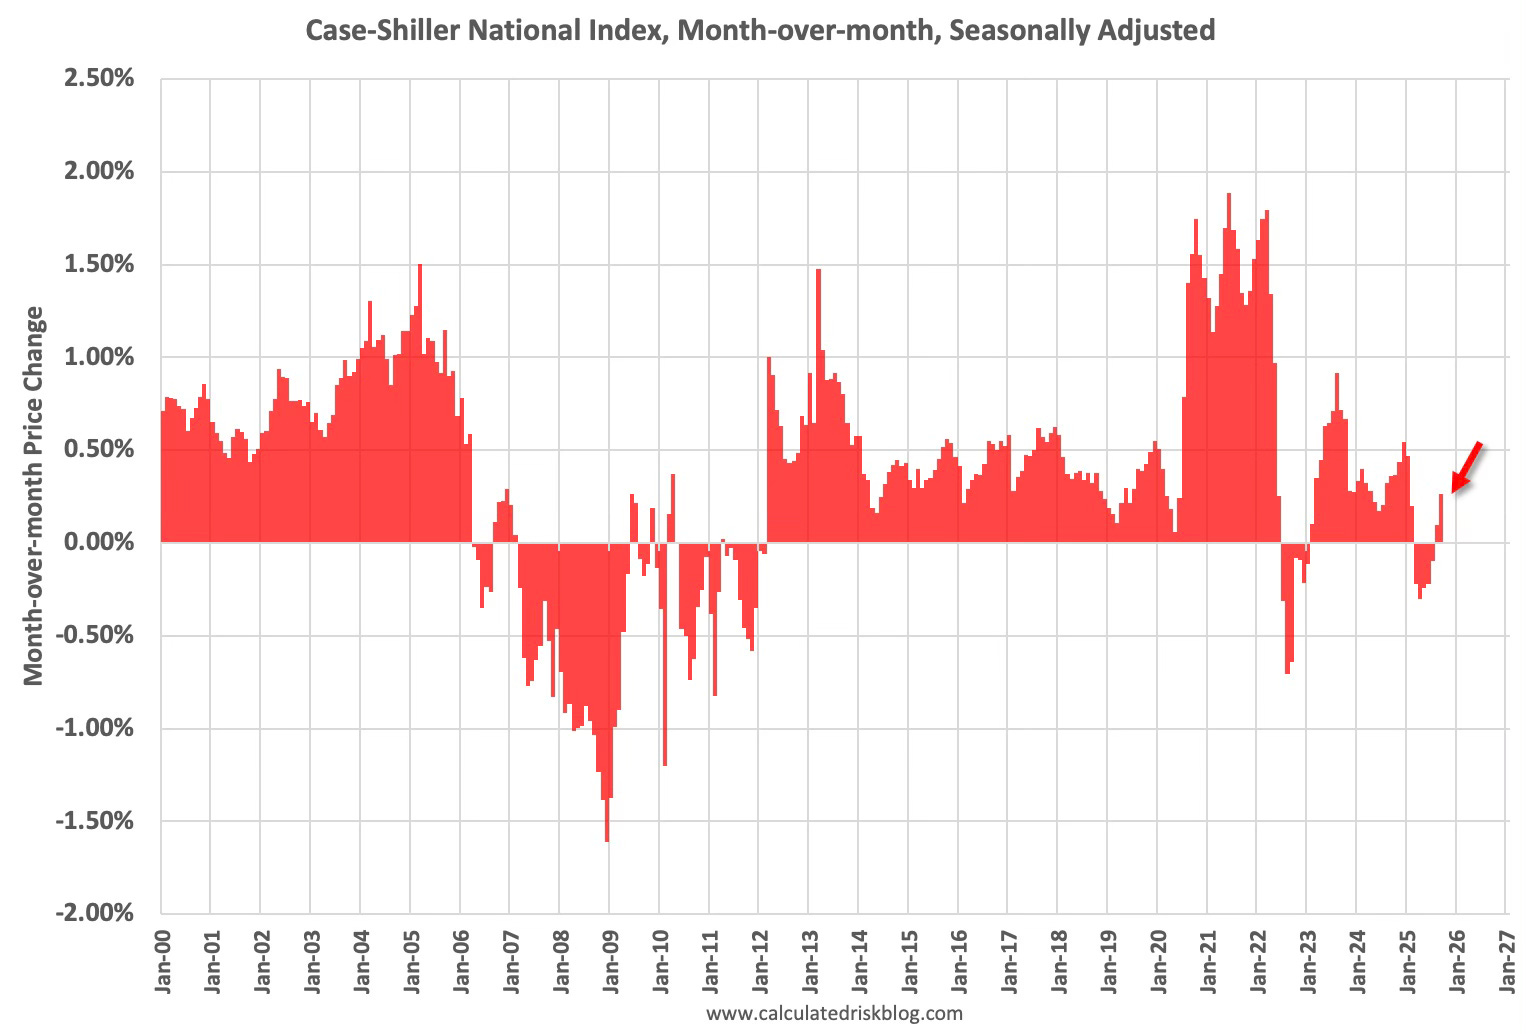
This is the 2nd consecutive month with a slight MoM increase seasonally adjusted.
The following graph – as of the November NAR release and October Freddie Mac HPI – shows that Case-Shiller tends to follow median prices and the Freddie Mac index. The NAR median price was up 1.2% YoY in November, the Freddie Mac HPI was up 1.0% YoY in October. This suggests the YoY Case-Shiller change will remain in about the same range – or slightly lower – over the next couple of months.
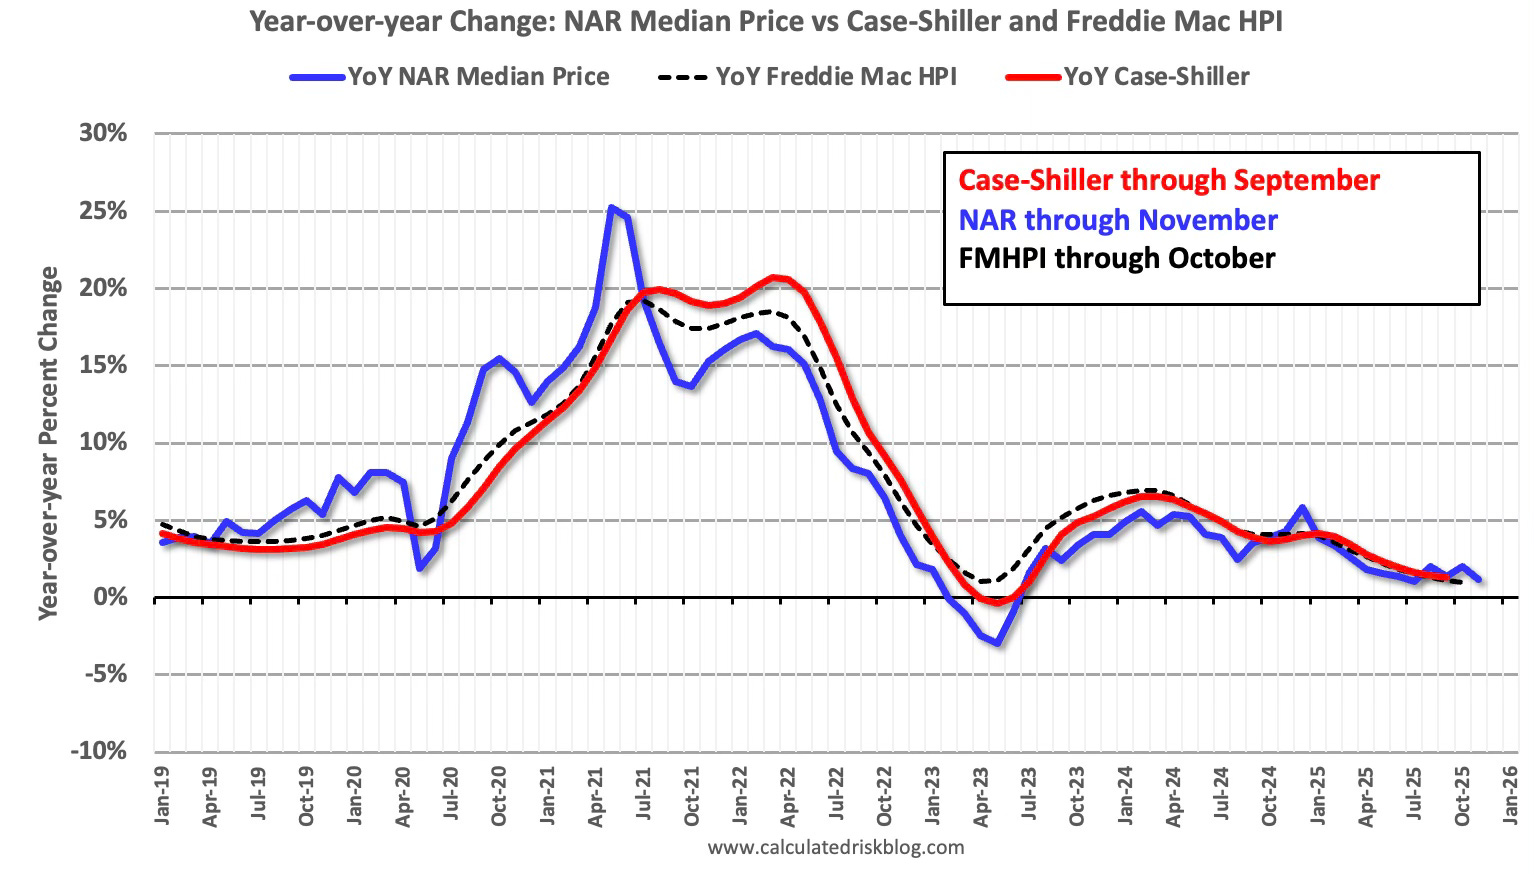
Note: Median prices are distorted by the mix (repeat sales indexes like Case-Shiller and FHFA are probably better for measuring prices).
Supply and demand are the keys for house prices; however, national house prices mask some significant regional differences. We are seeing regional differences in supply at the end of 2025, with very high levels of inventory in some areas, and low levels in other areas (mostly the Northeast).
The following content is for paid subscribers only. Thanks to all paid subscribers!