

Inspiration.
I was dismayed because the relative absence of moves to improve Diamondbacks’ weak points.
One exception is that starting pitching could be as good as last season with the re-signing of Kelly and the signing of Soroka. Perhaps Soroka and Mena will adequately fill Gallen’s slot. Pfaadt might improve somewhat. However, the context is that last season’s starting pitching was Meh. Their 4.29 ERA ranked 19th per Baseball Reference Stathead.
Advertisement
The trade deadline additions (plus some upside surprises) could improve the bullpen. Until Martinez and Puk return from the injured list, an offseason acquisition of a closer could make an impact.
Additional offseason trades and free-agent signings are possible. Although internal options may surprise to the upside, the position player offseason areas of possible weakness include corner infield positions and perhaps a power hitter for left field or center field, plus DH. Perhaps Waldschmidt will be promoted and shine in the outfield. Perhaps Lawlar or Blaze Alexander will do well at third base, leaving only the first base corner to improve.
Where do the Diamondbacks currently stand?
Pitching Baseline.
Let’s focus on the top-12 pitchers with the most innings in 2026. Note that some of the top-12 are relievers. Three reasons for the focus:
Advertisement
The percentage of innings pitched by the top-12 pitchers will likely stay about the same (77.1% of IP in 2024, and 77.3% of IP in 2025).
They account for most of the innings pitched.
Who the other pitchers will be and how they will perform is uncertain.
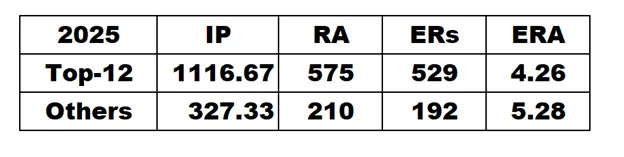
The following table shows the 2025 baseline. Data from FanGraphs and Baseball Reference.
 Batting Baseline.
They scored 791 runs. Per this AZ Snake Pit article, in the last two seasons (plus in their playoff-bound seasons), they averaged 11 baserunners per game, scored 33.2% of the baserunners, and scored 3 or more runs in 75% of their games. Albeit, in 2025, baserunners fell below the baseline. Given this foundation, I’m confident that the Diamondbacks can more-or-less maintain their high level of scoring runs.
Looking at the top-12 batters with the most PAs; they scored 654 RBIs (85.2% of the team’s RBIs). For similar reasons as our pitching baseline, the top-12 batters will be the batting baseline. Caveat, as this was being written, the Diamondbacks traded away Jake McCarthy. This article assumes (as a baseline) that the Diamondbacks replace him with a batter about as good as him (62 OPS+).
Advertisement
Looking towards 2026 pitching.
Focusing on the top-12 pitchers, let’s combine earned-runs-per-inning-pitched predicted by ZIPS with playing time projections the same as this article by Jack Sommers). The following table shows the projection for the pitchers with the top-12 projected innings.
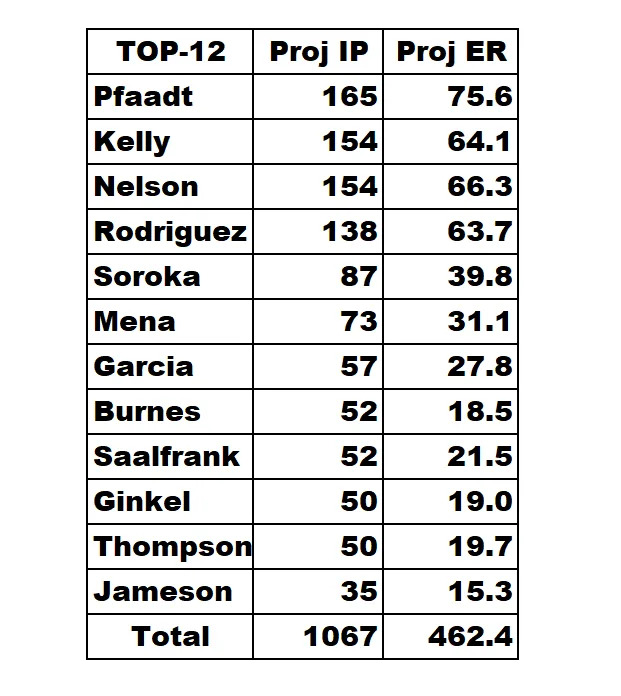
The table shows 462.4 earned runs for 1067 innings. A straight-line extrapolation from 1067 innings to last season’s 1116.67 innings, shows 483.5 earned runs, which is an improvement of 45.5 earned runs by the top-12 pitchers.
Assuming that the top-12 pitchers’ projected 1067 innings is 77.2% of total innings, the other pitchers will pitch 315 innings. The following table shows my projection for 2026 (with the caveat that the offseason is not over).
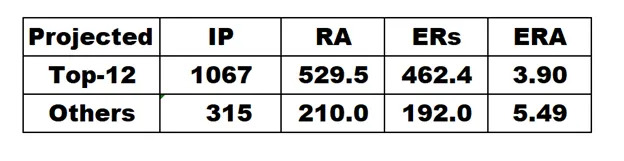
The baseline for the top-12 is good, with an ERA improvement (4.26 to 3.90). Overall, runs allowed is projected to improve from 785 in 2025 to 739.5 in 2026.
Advertisement
Looking towards 2026 batting.
Similar to what we looked at for pitching, for the top-12 batters let’s combine RBIs-per-PA predicted by ZIPS with playing time projections the same as this article by Jack Sommers). The following table shows the projection for batters.
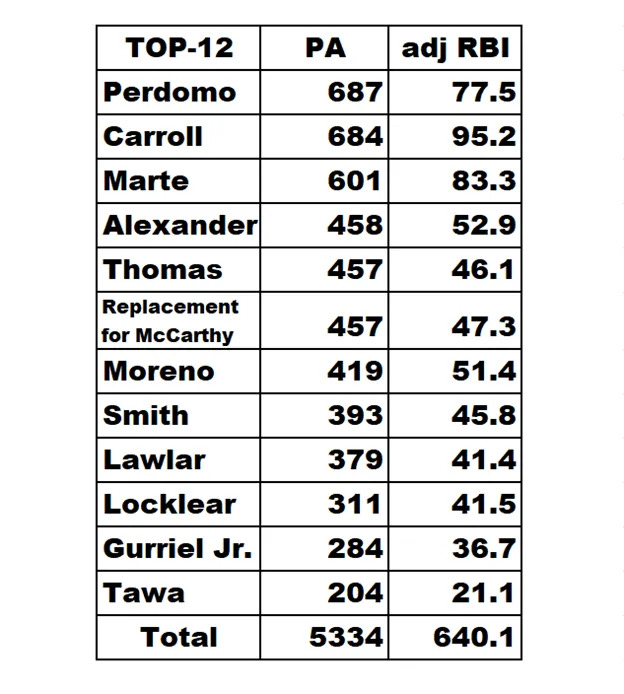
Assuming that the top-12 batters projected 640.1 RBIs is 85.2% of RBIs, the other batters will have 111 RBIs, which is 3 fewer than the other batters had in 2025. The following table shows my projection for 2026 (with the caveat that the offseason is not over).
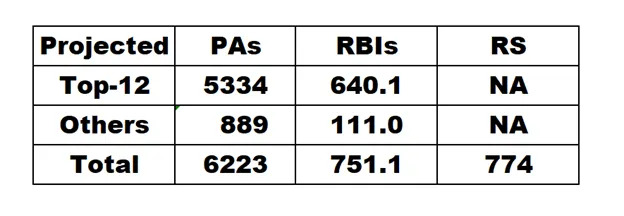
The projection is for runs scored to fall from 791 in 2025 to 774 in 2026.
Advertisement
Looking towards 2026 wins.
Let’s calculate projected wins using the Pythagorean formula provided by Baseball Reference. With 774 projected runs scored and 739.5 projected runs allowed, the formula provides 84.4 projected wins in 2026. Although the Diamondbacks underperformed their Pythagorean calculation the last two seasons, in 2023 they outperformed their Pythagorean calculation by 4 wins. As an optimist, my view is they will again outperform Pythagorean. In addition, the offseason is not yet over, so opportunities for improvement remain.
In summary, the Diamondback stand within reach of the 2026 playoffs.