

Get insights on thousands of stocks from the global community of over 7 million individual investors at Simply Wall St.
If you are wondering whether AST SpaceMobile’s share price around US$98.97 makes sense, the key question is how that compares with what the business might be worth.
The stock has seen sharp moves recently, with returns of 6.9% over the last 7 days, 14.6% over 30 days, 18.6% year to date and 331.8% over the past year, alongside very large gains over 3 and 5 years.
Recent headlines have focused on AST SpaceMobile’s progress toward building a space based cellular broadband network and its efforts to advance commercial partnerships in global telecoms. This context has kept attention on how the company might translate its technology roadmap and network agreements into long term value.
Even with that backdrop, AST SpaceMobile currently scores 2 out of 6 on Simply Wall St’s valuation checks. This sets up a closer look at traditional metrics like DCF and multiples, followed by a broader way of thinking about value that ties everything together by the end of this article.
AST SpaceMobile scores just 2/6 on our valuation checks. See what other red flags we found in the full valuation breakdown.
A Discounted Cash Flow, or DCF, model estimates what a business might be worth by projecting its future cash flows and then discounting those back to today’s value.
For AST SpaceMobile, the model used is a 2 Stage Free Cash Flow to Equity approach. The latest twelve month free cash flow is a loss of about US$1,438.9 million, and analyst based and extrapolated estimates suggest free cash flow staying negative in 2026 and 2027, then turning positive and reaching US$975.6 million by 2030. Beyond the explicit analyst window, Simply Wall St extrapolates further free cash flow projections out to 2035 using growth assumptions built into the model.
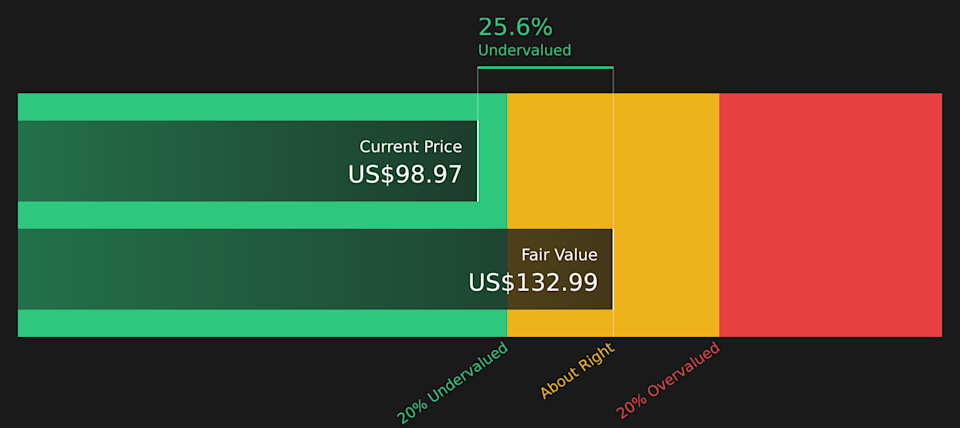
Aggregating and discounting these projected cash flows results in an estimated intrinsic value of about US$132.99 per share. Against a current share price around US$98.97, the model implies the stock trades at a 25.6% discount. This indicates a material gap between the cash flow based estimate and the market price.
Result: UNDERVALUED
Our Discounted Cash Flow (DCF) analysis suggests AST SpaceMobile is undervalued by 25.6%. Track this in your watchlist or portfolio, or discover 55 more high quality undervalued stocks.
 ASTS Discounted Cash Flow as at Apr 2026
Story Continues
For companies that are not yet producing consistent profits, price based multiples tied to the balance sheet, such as P/B, are often more practical than earnings based measures. They relate the market value of the equity to the accounting value of net assets, which can be easier to interpret when earnings are volatile or negative.
In general, investors tend to accept a higher “normal” valuation multiple when they expect stronger growth or see lower risk, and a lower multiple when growth expectations are modest or risks are higher. For AST SpaceMobile, the current P/B ratio is about 15.73x, compared with a telecom industry average of 1.33x and a peer group average of 9.42x. This means the shares trade at a higher level than both of those benchmarks.
Simply Wall St’s Fair Ratio is a proprietary estimate of what the P/B multiple might be, given factors such as earnings growth profile, industry, profit margins, market cap and risk characteristics. That tailored approach can be more informative than simple comparisons with industry or peer averages, because it explicitly adjusts for the company’s own fundamentals and risk profile. In this case, without a specific Fair Ratio value, the comparison cannot be completed, so no clear judgment can be made on whether the shares look overvalued, undervalued or about fair on a P/B basis.
Result: ABOUT RIGHT
 NasdaqGS:ASTS P/B Ratio as at Apr 2026
P/B ratios tell one story, but what if the real opportunity lies elsewhere? Start investing in legacies, not executives. Discover our 18 top founder-led companies.
Earlier it was mentioned that there is an even better way to understand valuation. Narratives are used to connect your view of AST SpaceMobile’s story with clear numbers by letting you set assumptions for future revenue, earnings and margins, link those to a Fair Value, and then compare that Fair Value with the current price inside the Simply Wall St Community page. Narratives update automatically as news or earnings arrive. One investor might build a higher Fair Value Narrative that leans on expectations similar to the US$95.00 bullish target, while another might prefer a lower Fair Value closer to the US$43.00 bearish target. Seeing those side by side makes it easier to decide whether the current share price looks above or below the range that fits your own view of the business.
Do you think there’s more to the story for AST SpaceMobile? Head over to our Community to see what others are saying!
NasdaqGS:ASTS 1-Year Stock Price Chart
This article by Simply Wall St is general in nature. We provide commentary based on historical data and analyst forecasts only using an unbiased methodology and our articles are not intended to be financial advice. It does not constitute a recommendation to buy or sell any stock, and does not take account of your objectives, or your financial situation. We aim to bring you long-term focused analysis driven by fundamental data. Note that our analysis may not factor in the latest price-sensitive company announcements or qualitative material. Simply Wall St has no position in any stocks mentioned.
Companies discussed in this article include ASTS.
Have feedback on this article? Concerned about the content? Get in touch with us directly. Alternatively, email editorial-team@simplywallst.com