
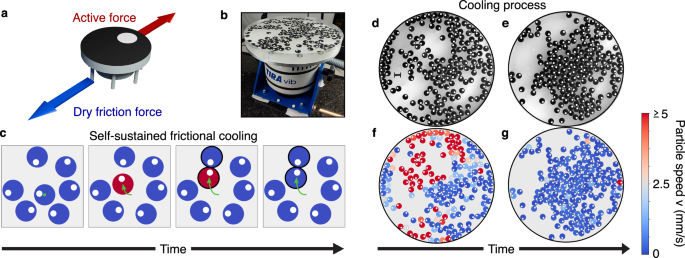
Active granular particles governed by dry friction
Active systems governed by dry friction are experimentally explored by utilizing 3D-printed particles placed on a vibrating plate. These plastic objects are designed as cylindrical particles with seven legs attached that are tilted in the same direction (Fig. 1a and Methods). The asymmetry of the legs generates active motion when these particles are placed on a vibrating plate, activated by an electromagnetic shaker. Indeed, particles jumping on the plate move in the direction where legs are tilted for a short time, while the direction of motion is generally randomized after a long time due to plate and particle imperfections. The quasi-two-dimensional dynamics of each particle are governed by activity (self-propelled speed) and inertia since particles are macroscopic objects.
As shown in ref. 48, the single particle dynamics of these granular objects is subject to dry friction in a range of sufficiently low shaker amplitudes A (see Methods for details). This friction is generated by the contact between plastic legs and plate and impedes the particle motion. The amplitude’s increase enhances the active speed compared to dry friction forces: this allows particles to switch from a Brownian (arrested-like) regime, where dry friction dominates and keeps the particle almost arrested, to a dynamical regime where particles move with a typical speed. In the latter regime, a single particle typically accelerates for a few seconds before changing its direction of motion48.
The principle of self-sustained frictional cooling
In order to get systematic insight into the self-sustained frictional cooling, we consider two active particles governed by dry friction which are characterized by a unique collisional mechanism that does not have an equivalent in wet systems governed by Stokes friction (Fig. 2a). Indeed, in the Stokes friction case, a moving active particle is able to push an arrested object, so that both start moving together. By contrast, in the dry friction case, interactions reduce the particle velocity and both particles are at rest after the collision as a result of dry friction. This mechanism is confirmed by proof-of-concept numerical simulations of an activated and a resting particle colliding elastically, i.e. without the loose of kinetic energy due to the collision (see Methods for details). However, after a collision, particles with dry friction lose kinetic energy much faster than particles governed by Stokes friction (Fig. 2b). Correspondingly, the center of mass of the system is nearly arrested in the former case while it moves almost linearly with time in the latter case (Fig. 2c). Due to fluctuations in the active force, after a transient period, particles start to regain the kinetic energy and move away from each other. However, in a high-density system, particles typically undergo frequent collisions and lack long free runs to restore their kinetic energy. As a consequence, our proof-of-concept analysis focuses on the minimum kinetic energy reached during a collision, which reflects the typical conditions encountered in the collective regime and provides information on the presented cooling mechanism. Here, we identify a range of activity where dry friction generates configurations slower than Stokes friction (Fig. 2d). In this range, particles exhibit self-sustained frictional cooling, while larger activities generate heated particles. The unique collisional mechanism responsible for the cooling effect is purely induced by dry friction and activity, and does not depend on the specific collision rule adopted. This is verified in an additional numerical study reported in the Supplementary Information (SI), where elastic collisions are replaced by an exclusive volume Weeks-Chandler-Andersen (WCA) potential (see Methods for details) or by partially inelastic collisions. Therefore, in the subsequent numerical study, we consider particles interacting via the WCA potential.
Fig. 2: Collisional mechanism for self-sustained frictional cooling.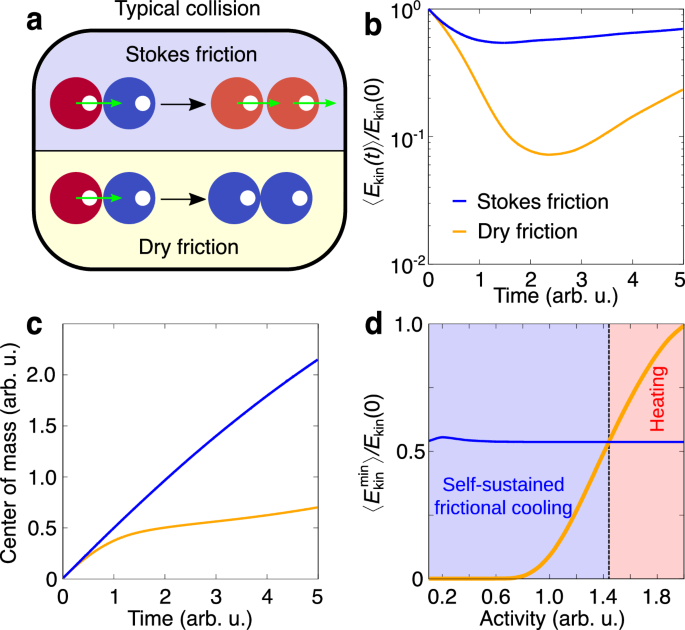
a Sketch of a typical binary collision between a moving, activated particle (red) and an arrested particle (blue). A different collision scenario is predicted for Stokes and dry friction. In the latter case, both particles are arrested, while in the former case they continue moving. b, c Averaged mean kinetic energy, 〈Ekin(t)〉 (b), and center of mass of two particles (c) as a function of time t. The activated (left) particle in both cases has a typical activation speed v0. The kinetic energy is normalized by the initial activation energy \({E}_{{{{\rm{kin}}}}}(0)=m{v}_{0}^{2}/2\). In both cases, after an initial drop in kinetic energy to a minimum due to the collision, the system starts to regain kinetic energy from fluctuations in the active force. d Averaged minimal kinetic energy during the cooling process as a function of activity. For low activity, dry friction cools down the system more than Stokes friction, allowing the kinetic temperature to almost approach zero. The crossover from self-sustained frictional cooling to heating is marked by a vertical dashed line dividing the activity region where cooling by dry friction becomes less effective compared to the reference system with Stokes friction. The simulation protocol to generate the elastic collisions in the case of dry friction and Stokes friction is described in the Methods.
Cooled, mixed and heated phases
Experimentally, collective phenomena are explored by placing N active granular particles on the plate, at packing fraction Φ = Nd2/D2 = 0.5, where D and d are the plate’s and the particles’ diameters, respectively. We let the system evolve at large shaker amplitude to reach a configuration where particles are randomly placed on the plate. Successively, we sharply decrease the shaker’s amplitude to the desired value tuning the active speed compared to the dry friction. For low amplitude conditions (corresponding to low activity), particles rarely move until to form a cluster where they are almost arrested, as outlined by the steady-state temporal evolution (Fig. 3a and Supplementary Movie 1) and the instantaneous kinetic energy of each particle. We refer to this almost arrested dynamical state as a frictional arrested cooled phase. This dynamical feature is confirmed by plotting the distribution of the particle speed p(v) that is characterized by a narrow peak close to zero (Fig. 3d) and by a short-tail for non-zero speeds. This tail corresponds to particles that slightly move within the dense cluster. However, these particles are almost immediately stopped (cooled down) by the caging effect due to neighboring particles, as shown in Supplementary Movie 2, where the particles are colored according to their speed.
Fig. 3: Cooled, mixed and heated phases.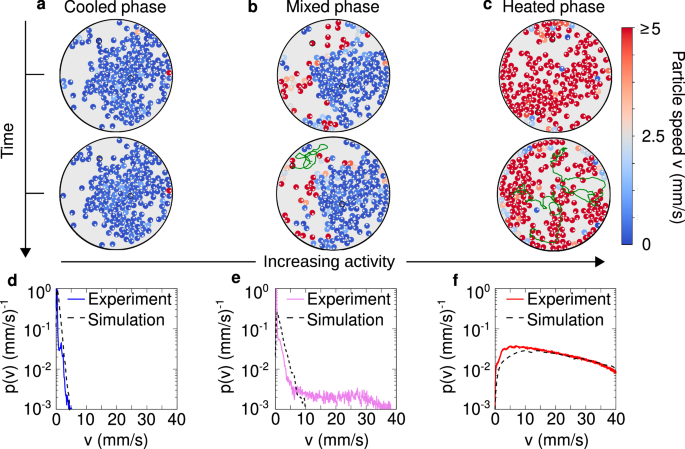
a–c Snapshots at two different times to outline the time evolution of configurations for cooled (A = 18.66 ± 0.08 μm), mixed (A = 18.88 ± 0.09 μm) and heated (A = 21.56 ± 0.09 μm) phases, respectively. The snapshots in the upper row are the initial configurations, with a corresponding to that in Fig. 1g, while the lower row reports the snapshot after 30 seconds of time evolution. In the lower row, the trajectories of two highlighted tracers (one inside and one outside the cluster) are displayed for each phase. Particles with low mobility are represented by orange trajectories while those with high mobility are shown in dark green. The evolution reveals that the cluster remains stable in the cooled and mixed phases but becomes transient in the heated phase due to the significantly higher particle mobility. d–f Velocity probability distributions p(v), shown for the corresponding phases in (a)–(c). The colored solid lines represent experimental data, while the black dashed lines correspond to results obtained by simulating the dynamics (1) in a confining circular arena. Parameters of the simulations are given in Table 1. Both the cooled and mixed phases exhibit a velocity peak near zero, with the mobile particles outside the cluster in the mixed state contributing to the distribution tail at higher velocities. In contrast, the heated phase shows a complete shift of the velocity peak away from zero.
By increasing the shaker’s amplitude and, thus, the activity compared to dry friction, particles outside the cluster start moving as evidenced by plotting the kinetic energy per particle and the typical particle trajectories (Fig. 3b). In this case, a large cluster formed by cooled particles coexists with fast particles with large kinetic energy (see the steady-state Supplementary Movie 1). While the former particles are part of a cooled cluster, the latter particles define a heated phase. Consequently, in this intermediate regime, the cooled and heated phases coexist. This is confirmed by plotting the speed distribution p(v) (Fig. 3e) which shows the coexistence between a narrow peak at zero, which is generated by frictional arrested (cooled) particles in the dense cluster, and a long tail reaching large velocity values due to heated particles in the dilute region. The self-sustained frictional cooling mechanism operates in both regimes but is ultimately weaker in the dilute region, where collisions are infrequent. As a result, it cannot effectively stop the particles, which are instead heated by activity, as shown in the Supplementary Movie 2.
Finally, by increasing the shaker amplitude A (further reducing the dry friction), almost all the particles move fast and form unstable aggregates which continuously break and reform (Fig. 3c and Supplementary Movie 1). Given the large kinetic energy value per particle, this regime can be identified as a heated phase, characterized by dynamical clustering. In this phase, the speed distribution p(v) shows a peak at large velocity, being determined by hot particles only (Fig. 3f and Supplementary Movie 2). In this heated regime, the self-sustained frictional cooling is still present but it is too weak to arrest the particles which continuously move being heated by activity. However, the particle acceleration observed at the single-particle level48 is not easily discernible in the collective dynamics due to frequent interparticle collisions.
The cooled, mixed, and heated phases depicted in Fig. 3 demonstrate configurations already in the steady state. The corresponding Supplementary Movies 1 and 2 begin after a long transient, lasting several minutes, to ensure that the system has reached this regime. However, experiments are initialized from a loosely packed configuration and spontaneously evolve toward the aforementioned phases, as shown in Supplementary Movie 3, which captures the system from the very moment the shaker is turned on.
Model for self-sustained frictional cooling
Active Brownian particles with Stokes friction typically used in wet active matter cannot reproduce the cooled and heated phases experimentally observed. Indeed, these models show dynamical clustering at large self-propelled speed (large Péclet number) compared to our system, and, specifically, cannot reproduce the cooled cluster of almost frictional arrested objects experimentally observed. By contrast, the clustering of our experimental system does not originate from the blocking effect caused by high motility and volume exclusion but intuitively arise from the competition between dry friction and the caging effect due to neighboring particles.
To examine the suggested frictional mechanism and reproduce cooled and heated phases, we perform a numerical study based on inertial active particles with mass m, subject to dry friction. Particles evolve with two-dimensional inertial dynamics for the velocity \({{{{\bf{v}}}}}_{i}={\dot{{{{\bf{x}}}}}}_{i}\)
$$m{\dot{{{{\bf{v}}}}}}_{i}=-{{{\boldsymbol{\sigma }}}}({{{{\bf{v}}}}}_{i})+\sqrt{2K}{{{{\boldsymbol{\xi }}}}}_{i}(t)+f{{{{\bf{n}}}}}_{i}+{{{{\bf{F}}}}}_{i}+{{{{\bf{F}}}}}_{i}^{w},$$
(1)
where ξi are Gaussian white noises with unit variance and zero average and the constant K determines the noise strength. This noise is due to imperfections in the particle shape and the surface of the plate and is generated by the small vertical motion of the vibrobot due to the oscillating plate33. The term fni models the active force whose evolution follows the active Ornstein-Uhlenbeck dynamics52,53,54,55. In Eq. (1), the constant f determines the amplitude of the activity and sets the typical speed of an active granular particle while the stochastic term ni evolves as an Ornstein-Uhlenbeck process
$$\dot{{{{\bf{n}}}}}(t)=-\frac{{{{\bf{n}}}}(t)}{\tau }+\sqrt{\frac{2}{\tau }}{{{\boldsymbol{\eta }}}}(t),$$
(2)
and determines the direction of the single-particle motion. In Eq. (2), η(t) is a Gaussian white noise with zero average and unit variance and τ represents the persistence time of the active particle. In our experimental setup, dissipation during collisions is negligible38. Therefore, interactions are modeled by a conservative force Fi derived from a Weeks-Chandler-Andersen potential (see Methods), which accounts for volume exclusion. In addition, a repulsive force \({{{{\bf{F}}}}}_{i}^{w}\), derived from a harmonic potential truncated in its minimum, represents the confinement imposed by the arena (see Methods for further details). Finally, in Eq. (1), dry friction is included through the term − σ(vi) which points in the opposite direction compared to the particle velocity and reads
$${{{\boldsymbol{\sigma }}}}({{{\bf{v}}}})={\Delta }_{C}\hat{{{{\bf{v}}}}},$$
(3)
where \(\hat{{{{\bf{v}}}}}\) is the normalized velocity vector which is equal to zero if v = 0. This expression models the dynamic dry (Coulomb) friction which decelerates an object already in motion and uniquely depends on the velocity direction via the constant friction coefficient ΔC. The model (3) is the paradigm to study dry friction in particle dynamics56,57,58,59, with direct applications in Brownian motors60,61 and passive granular particles62. We remark that the suggested model does not include static friction, since numerical checks confirm that its inclusion does not qualitatively alter the observed phenomena (see SI).
By simulating the dynamics (1) in the experimental conditions – e.g., same number of particles and arena size – we obtain a qualitative agreement with experimental results. By increasing the particle activity f compared to the dry friction coefficient ΔC, we observe cooled, mixed, and heated phases as revealed by the Supplementary Movie 4. This qualitative match is confirmed by monitoring the speed distribution p(v), which is sharply peaked around zero in the cooled phase (compare solid and dashed lines in Fig. 3d) and exhibits a broad shape with a peak at large speed in the heated phase (compare solid and dashed lines in Fig. 3f). While in these cases we obtain an excellent agreement, p(v) in the mixed phase shows a shorter tail compared to experiments (compare solid and dashed lines in Fig. 3e). This occurs because, in simulations, particles in the dilute region of the mixed phase are typically slower as compared to experiments.
Kinetic phase diagram
Cooled and heated phases observed in experiments are numerically reproduced by simulating the dynamics (1) in a square box of size L with periodic boundary conditions (Fig. 4). This numerical study shows that different temperature phases – specifically, the mixed phase and the cooled cluster – are generated by dry friction and caging effects from neighboring particles. In those phases, the particles are mostly stopped by dry friction and move due to rare fluctuations of the active force and translational noise. When particles are in close contact (during interactions), the effect of those rare fluctuations is almost suppressed by the caging imposed by the nearly immobile neighboring particles. This scenario dominates inside the cooled clusters and in the dense region of the mixed phase. However, in the latter case, the particle density outside the cluster is low, thereby still allowing particle to exhibit notable mobility as they rarely interact with each other. This physical mechanism generates the self-sustained frictional cooling experimentally observed.
Fig. 4: Kinetic phase diagram.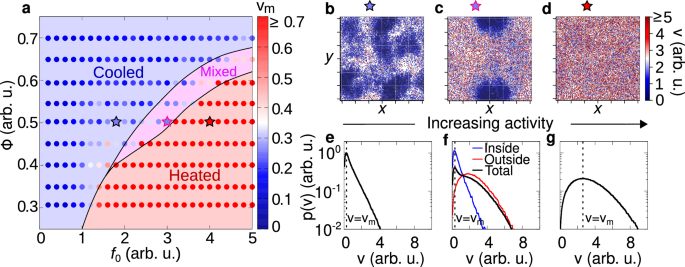
a Phase diagram in the plane of reduced activity f0 and packing fraction Φ with a color gradient denoting the mode particle speed (points). Background colors are used to distinguish between different phases: cooled (blue), mixed (pink), and heated (red) phases. The cooled phase occurs when most of the particles are frictional arrested and remain within the cluster, whereas in a heated phase, particles are highly mobile and are not significantly slowed down by the frictional forces. A state where cooled and heated phases coexist is referred to as a mixed phase. Details on the transition line between these states are discussed in the Methods. b–d Snapshots of cooled, mixed, and heated phases. The color gradient denotes the particle speed (red for high and blue for low speeds). The stars above each snapshot indicate the corresponding parameters f0, Φ in the phase diagram a. e–g Probability distribution of the velocity p(v) for the cooled (e), mixed (f) and heated (g) phases. For the mixed state, we separately highlight the distributions for particles inside (blue) and outside (red) of the cooled cluster. Particles within the cluster exhibit characteristics of the cooled phase, while those outside behave like particles in the heated phase. In all cases p(v) exhibits a single peak vm (dashed vertical line, mode speed), with the value of this peak depicted in the phase diagram a.
Within this numerical study, we overcome experimental limitations, such as finite-size effects and boundaries of the plate. As explained in the methods, the dynamics are mainly governed by the reduced activity f0 = f/ΔC, which quantifies the active force effect compared to the dry friction: The larger f0, the smaller the dry friction or equivalently, the lower the activity. Simulations start from homogeneous configurations and then analyzed when the system reaches the steady state (see Methods for details). This numerical study is performed across various reduced activities and packing fractions Φ = Nπσ2/(4L2). In this way, we extend the experimental study by systematically exploring a broad range of densities that in equilibrium systems show gas-like configurations and high-density homogeneous liquids.
Temperature phases are systematically explored in a phase diagram in the plane of reduced activity f0 and packing fraction Φ with colors representing the typical particle speed, i.e. the mode of the velocity distribution (Fig. 4a). Specifically, for low reduced activity f0 (large dry friction), simulations confirm the cooled phase observed in experiments, where particles are almost arrested in cluster structures (Fig. 4b). These particles are characterized by low temperature, i.e. low values of kinetic energy, as revealed by plotting the instantaneous kinetic energy per particle. These dynamical properties reflect onto the speed distribution p(v) which shows a narrow peak at vanishing speed (Fig. 4e). This shape of the distribution qualitatively agrees with the experimental one (Fig. 3d). A detailed discussion on the choice of mode speed as a parameter to distinguish between the cooled and heated phases is provided in the SI.
By increasing the reduced activity f0, the arrested-like cluster is surrounded by a heated phase, consisting of fast particles (Fig. 4c) with large kinetic energy as in experiments. In this regime, the speed distribution p(v) has a peak at zero and a long tail for large velocities (Fig. 4f). The former is generated by slow particles in the cluster, while the latter is due to fast particles in the heated phase. This interpretation results from the direct calculation of p(v) inside and outside the cluster, which is in qualitative agreement with the experimental results (Fig. 3e).
Finally, a further increase of f0 (lower values of dry friction) completely suppresses the almost arrested cluster and generates a heated phase with fast particles (Fig. 4d). Again, this qualitative picture is confirmed by measuring p(v) which displays a broad shape with a peak at large speed as in experiments (Fig. 3f).
Our phase diagram reveals that the cooled phase is promoted by high packing fractions Φ. Indeed, in a dense system, the caging effect is enhanced, thereby strengthening the self-sustained frictional cooling. For low Φ, the cooled phase is directly followed by the heated phase, with a smooth crossover reflecting onto the smooth change of the particle skewness. Specifically, in this regime, particles interact rarely and therefore the transition from cooled to heated phases takes place when the activity exceeds the dry friction coefficient for a single particle, i.e. for f0 ≈ 1. By increasing Φ, the transition line shifts to larger activities f0 ≳ 1 because interactions are more frequent and collisions – governed by the self-sustained frictional cooling mechanism – on average slow down the particles, thereby favoring the cooled phase. For large Φ, specifically above the threshold value Φ > 0.4, the transition is anticipated by the mixed phase, where heated and cooled particles coexist and demix. This scenario resembles a first-order phase transition, occurring out-of-equilibrium, entirely due to the competition between dry friction, caging and activity.
Structure analysis: homogeneous, clustered and solid structures
We combine dynamic and static information to discuss the structural properties of cooled and heated phases. Both are characterized by homogeneous, clustered, and solid-like structures depending on reduced activity f0 and packing fraction Φ (see the phase diagram, Fig. 5a). To distinguish these configurations, we study the distribution Prob(ϕ) of the local packing fraction ϕ (the particle area divided by the area of its Voronoi cell), and, specifically, its skewness (Fig. 5f–i), i.e. the degree of asymmetry compared to the average packing fraction (see Methods for details). The homogeneous phase is characterized by an almost symmetric Prob(ϕ) (vanishing skewness), while the presence of clusters (Fig. 5c) induces long tails in Prob(ϕ) (negative skewness) and shifts the main peak compared to the average packing fraction.
Fig. 5: Structure analysis.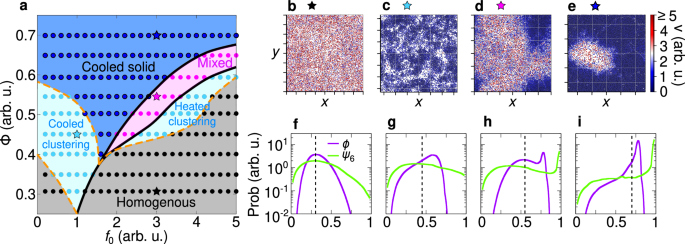
a Phase diagram illustrating the four possible structural states. The thick solid lines are identical to those shown in Fig. 4. Phases are distinguished by comparing the distribution of the local packing fraction ϕ and the one of the orientational order parameter ψ6 (see Methods for details). b, e Snapshots for the different structural phases. Particles are colored according to their speed, i.e. red and blue for high and low speed, respectively. The stars above each snapshot indicate the corresponding parameters f0, Φ in the phase diagram a. f–i Probability distributions of the local packing fraction Prob(ϕ) (violet) and the hexagonal local order parameter Prob(ψ6) (green). The vertical dashed lines mark the average packing fraction value Φ. The snapshots (b)–(e) correspond to the distribution (f)–(i), respectively.
Both in the cooled and heated phases, clustering is intuitively favored by large global packing fraction values Φ. However, counterintuitively, clustering occurs non-monotonically with the reduced activity f0 revealing a sharp change when the system switches from cooled to heated phases. Indeed, activity favors cluster formation (Fig. 5c) in the cooled phase but promotes homogeneous configurations (Fig. 5b) in the heated phase. This non-monotonic behavior is absent in overdamped wet active matter where clustering is always favored by the increase of the active speed and requires speeds at least an order of magnitude larger than our activity. These differences are caused by the origin of the mechanism leading to cluster formation: Indeed, in our system, clustering does not occur because particles block each other but because of self-sustained frictional cooling generated by dry friction and caging. Specifically, in the heated phase, the faster the particle, the larger the probability that dry friction is overcome. When this happens particles likely leave the clusters and the system shows a homogeneous phase. By contrast, in the cooled phase, only particles with high enough speed have the capability of moving until they collide with other particles and eventually remain stuck in a cluster.
In agreement with our expectations, the mixed state, i.e. the coexistence of the cooled cluster and the heated homogeneous state (Fig. 5d), is characterized by a bimodal packing fraction distribution Prob(ϕ) (Fig. 5h). This phase coexistence differs from motility-induced phase separation typical of overdamped active matter because i) occurs at small activity values and ii) the two coexisting phases have a different temperature: large temperature for heated configurations and low temperature for cooled configurations. Starting from the mixed phase (pink region in Fig. 5a), the phase coexistence is suppressed both for large and low activity values. Indeed, when f0 is increased, a larger number of particles have the capability of moving until the cooled phase is completely suppressed and dynamical clustering is recovered. By contrast, when f0 is low, almost all the particles are almost arrested and the cooled phase dominates over the heated one (Fig. 5e). We call this regime, a cooled solid. Indeed, in this phase, the bimodality of Prob(ϕ) is suppressed (Fig. 5i).
To distinguish between cooled clustering and cooled solid, we monitor the distribution of the hexatic order parameter Prob(ψ6) (see the methods for the definition of ψ6). This observable is close to the unit for solid-like configurations and returns smaller values otherwise. The solid phase can be identified when Prob(ψ6) shows a peak at ψ6 ≈ 1 (Fig. 5i), while we consider cooled clustering (or homogeneous) those configurations such that the peak of Prob(ψ6) occurs at smaller ψ6 values (Fig. 5f, g). Finally, as expected, Prob(ψ6) is bimodal in the mixed phase (Fig. 5h).