

Why this matters: The bullish market following the 2020 recession reversed track in 2022 and has fully collapsed — now the commercial market is nowhere near finding a bottom in tenant demand and vacancies.
The second quarter (Q2) 2025 reports on the Southern California (SoCal) commercial property market are in from VOIT Real Estate Services.
2025 is looking like a wait-and-see year of fallout from chaotic national and global trade policies unpredictably and selectively affecting the use of commercial real estate in SoCal — which includes the areas of San Diego, Orange County, Los Angeles and the Inland Empire.
Vacancy rates — the percentage of commercial space available for rent — is hovering around 8% for San Diego and Inland Empire industrial real estate, while San Diego and Orange County office space is around 15% vacant. With such elevated vacancy rates for the office sector, expect more office-to-residential conversions — and a drop in rental rates — to develop as the force of recession shapes landlord response.
Orange County and Los Angeles industrial real estate has a comfortable vacancy rate of about 5%, as well as San Diego retail, based on landlord concessions rather than simply adjusting monthly rent, an inevitable but landlord-abhorred event. As capitalization (cap) rates rise, landlords, to keep property values from falling, are pushing monthly rent amounts up, rent-free months, discounts for rent paid by the due date, tenant improvement (TI) upgrades and relocation expenses.
Most of the industrial real estate sector is experiencing a decline in demand. This once white-hot market, the investment of choice for many only a few short years ago when interest rates were low and space was scarce, is now finding incentives to retain commercial tenants. Those landlords who do not will soon experience long-term vacancy conditions.
Volatility remains high for SoCal’s commercial property amid global trade disputes, tariffs and territorial wars, especially with SoCal’s Ports of Los Angeles and Long Beach, and proximity to the Mexican border.
Again, commercial landlords continue to offer tenant concessions like rent-free months annually to attract tenants rather than simply reducing monthly rent. This gimmick tricks cap rates and multipliers into calculating a higher property valuation. Underlying the landlord effects is the fact commercial tenants have become cautious, uncertain about trade, the economy and their businesses. On top of this, commercial brokers are gaming fees by submitting letters of intent (LOIs) to existing and prospective tenants with term options for costly two- or three-year short-term rent rates and far less costly five- or ten-year long-term rates.
Further, leasing agents assisting commercial landlords and tenants are barely adjusting, if at all, to the public policy introduced legislatively this year of representation agreements for landlords and tenants to stop the fixing of fees. Yes, it is codified as agency law but mostly ignored by unaware clients. Meanwhile, government agencies haven’t acted. The objective is for tenants to be in on fee negotiations since it is their promise to pay rent that fuels payment of the fees. Without the tenant paying rent, there will be no broker fees.
Brokers assisting commercial landlords use Realty Publications, Inc. (RPI)’s new Landlord Representation Agreement. [See RPI Form 106]Brokers assisting commercial tenants use RPI’s new Tenant Representation Agreement. [See RPI Form 105.1 and 105.2]
As a matter of antitrust laws addressing the fixing of fees, tenants need to receive the same agency via a written representation agreement, with fees negotiated by buyers under representation rules controlling the behavior of the tenant agent. All buyers and tenants are acquiring the right to possess and use a property.
Similarly, commercial property sales receive the same treatment as residential sales for broker fee negotiations, agency law disclosure and representation agreements, all now mandated. Commercial brokers are essentially ignoring the new codes, at their peril.
Related article:
San Diego County — industrial, office and retail
San Diego County’s industrial vacancy rate is:
7.45% in Q2 2025;up from 6.94% in Q1 2025; andup from 5.69% in Q2 2024.
Conclusion: San Diego industrial vacancy rates are on a relentless increase.

San Diego County’s industrial net absorption rate — the total change in occupied industrial space during the quarter — is:
-764,932 square feet in Q2 2025;down significantly from -226,417 square feet in Q1 2025; anddown from -191,480 square feet in Q2 2024.
Conclusion: San Diego’s declining demand for industrial space is becoming more severe as centralized ports now can handle more traffic.
San Diego County’s office vacancy rate is:
14.16% in Q2 2025;up from 13.75% in Q1 2025; andup from 12.28% in Q2 2024.
Conclusion: Office vacancy rates for San Diego are steadily rising as destabilized.
San Diego County’s office net absorption rate — the total change in occupied office space during the quarter — is:
-469,185 square feet in Q2 2025;down from +182,186 square feet in Q1 2025; anddown from +427,627 square feet in Q2 2024.
Conclusion: Office space demand has decelerated over the past year, now set as a downward trend.
San Diego County’s retail vacancy rate is:
4.43% in Q2 2025;up from 4.19% in Q1 2025; andabove the vacancy rate of 4.16% in Q2 2024.
Conclusion: San Diego retail vacancy rates continue to creep up.
San Diego County’s retail net absorption rate — the total change in occupied retail space during the quarter — is:
-318,864 square feet in Q2 2025;up from -356,886 square feet in Q1 2025; anddown from +124,754 square feet in Q2 2024.
Conclusion: Decreasing demand for retail space persists.
Orange County — industrial and office
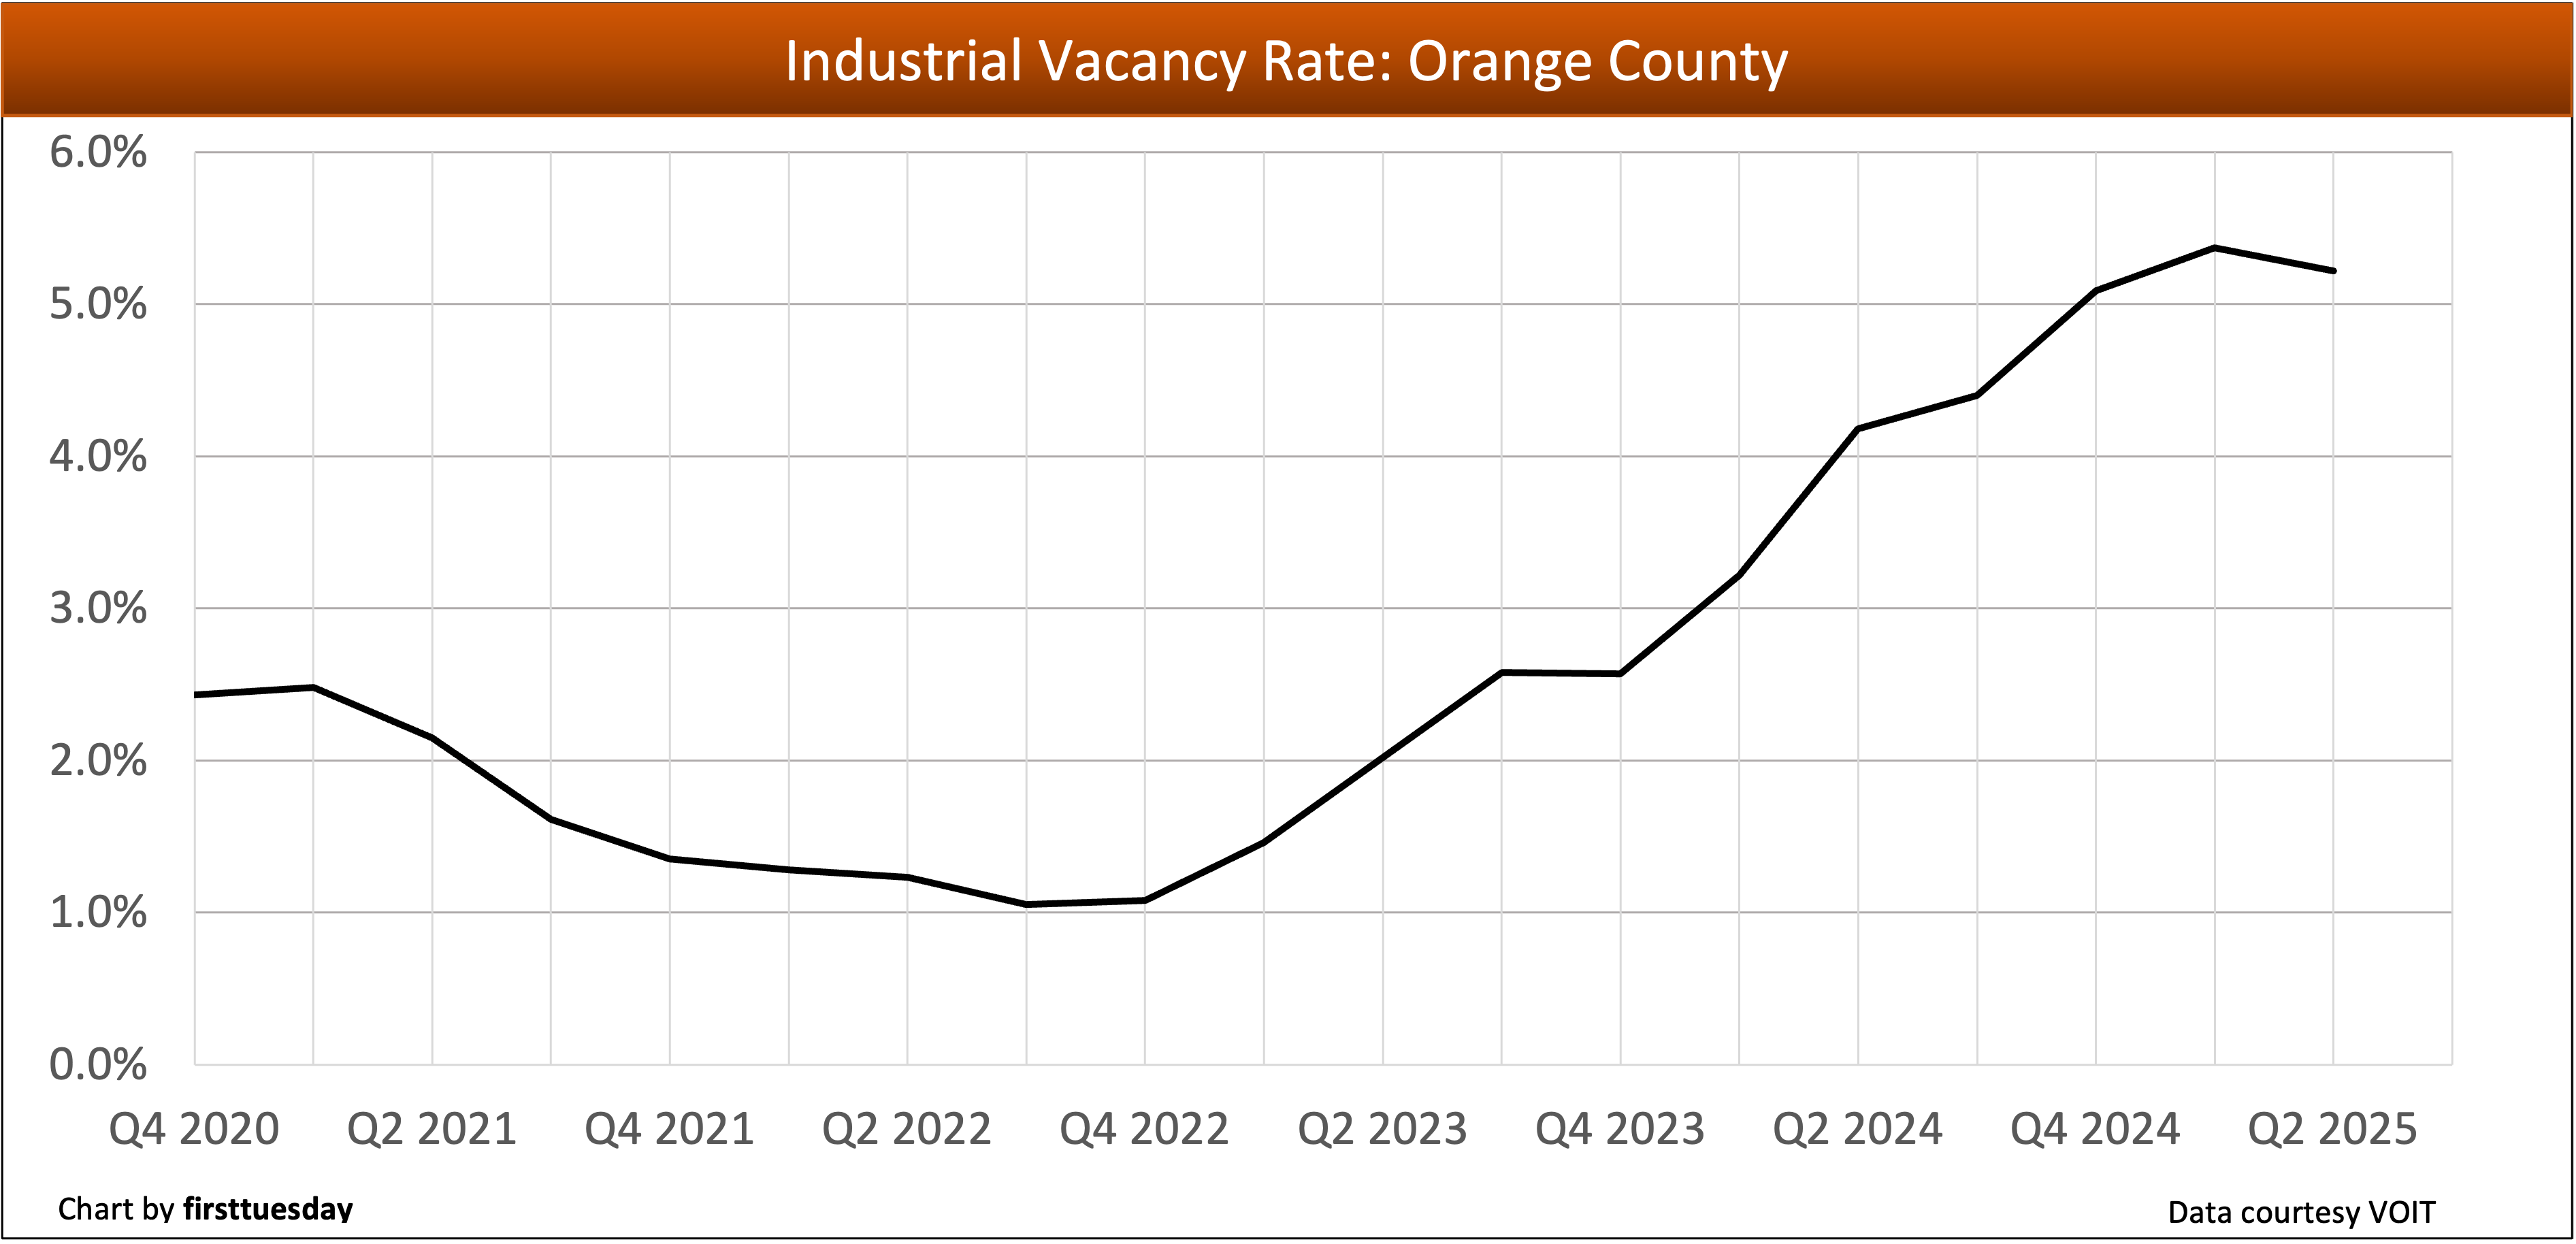
Orange County’s industrial vacancy rate is:
5.22% in Q2 2025;down slightly from 5.31% in Q1 2025; andabove the vacancy rate of 4.18% in Q2 2024.
Conclusion: Orange County as the coastal center for SoCal has a lower vacancy rate; still, its industrial vacancies continue to rise with ripples from tenant tariff-gaming.
Orange County’s industrial net absorption rate is:
+336,362 square feet in Q2 2025;up from -272,207 square feet in Q1 2025; andup from -168,170 square feet in Q2 2024.
Conclusion: Orange County industrial real estate demand is trending down with a recent tariff-related bump in demand for space.
Orange County’s office vacancy rate is:
15.79% in Q2 2025;up from 15.48% in Q1 2025; andbelow the vacancy rate of 16.34% in Q2 2024.
Conclusion: Orange County office vacancy rates have plateaued but at a level too high to support current pricing of rent.
Orange County’s office net absorption rate is:
-277,724 square feet in Q2 2025;slowing from -333,333 square feet in Q1 2025; andworse than -225,869 square feet in Q2 2024.
Conclusion: Orange County net absorption ran consistently negative over the course of the past year.
Los Angeles County — industrial
Los Angeles County’s industrial vacancy rate is:
5.57% in Q2 2025;up slightly from 5.51% in Q1 2025; andup from the vacancy rate of 5.26% in Q2 2024.
Conclusion: Los Angeles industrial demand has plateaued during the past year but faces tenant apprehension about long-term need for space.

Los Angeles County’s industrial net absorption rate is:
-644,869 square feet in Q2 2025;down significantly from +856,329 square feet in Q1 2025; andbetter than -3,091,322 square feet in Q2 2024.
Conclusion: Los Angeles industrial is seeing trade-policy volatility disrupting a continuing negative absorption trend as shipping routes shift.
Inland Empire — industrial
The Inland Empire’s industrial vacancy rate is:
8.18% in Q2 2025;up from 7.44% in Q1 2025; andup from 7.16% in Q2 2024.
Conclusion: Inland Empire industrial vacancy rates continue to worsen as they field tariff-produced ripples in demand but are positioned to first provide space for a reverse routing of shipping.

The Inland Empire industrial net absorption rate is:
-4,358,050 square feet in Q2 2025;down significantly from +3,287,108 square feet in Q1 2025; anddown significantly from +7,236,523 square feet in Q2 2024.
Conclusion: Inland Empire location on the periphery of coastal population continues to trend down in industrial absorption as vacancies pile up in the rearrangement of shipping routes.
Related article:
The widening level of vacant commercial space available in SoCal — Q1 2025
