
Ratings Roundup is a rundown of recent rating news and is derived from press releases and reports around the industry. In this week’s edition, ABC and ESPN deliver the largest NBA Finals Game 3 audience since 1998 with 23.8 million viewers; ESPN’s Stanley Cup Final averages 5 million viewers through four games for its best start since 2015; ESPN closes the most-watched WCWS on record as Texas repeats; NBC and Peacock post the second-largest U.S. Women’s Open final-round audience since 2014 as Nelly Korda wins; ESPN scores the most-watched NCAA Baseball Super Regionals since 2009; FOX and FS1 draw 3.73 million viewers for the 158th Belmont Stakes; and much more.
NBA, NHL Finals Dominate Ratings for Week of June 1-7
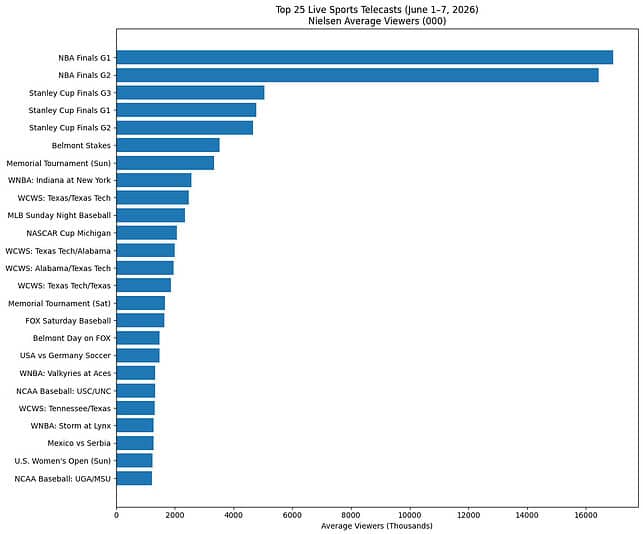
For the week of June 1-June 7, top ratings sports broadcasts were a mix of NBA Finals, NHL Stanley Cup Finals, Belmont Stakes, NCAA softball, NCAA baseball, soccer, golf, NASCAR, WNBA, and MLB.
The NBA Finals netted the top 2 spots with ABC’s Game 1 delivering 16.94 million on June 3 and Game 2 of earning 16.43 million viewers on June 5. The first three games of the NHL Stanley Cup Finals on ABC rounded out the top 5, followed by FOX’s Belmont Stakes, and CBS’s PGA Tour Memorial Tournament. Other big performers in the Top 25 included NCAA Women’s College World Series with four slots and the WNBA with three.
NBA Finals: ABC and ESPN’s Second Most-Watched Finals Ever Through Three Games
ABC and ESPN’s coverage of the 2026 NBA Finals is averaging 19.1 million viewers through three games — the second most-watched NBA Finals ever on the networks, up 114% vs. last year’s championship series — per Nielsen Big Data + Panel. The series headliner came Monday, June 8, as Game 3 averaged 23.8 million viewers and peaked at 26.3 million at 11:15 p.m. ET — the largest NBA Finals Game 3 audience since 1998, the largest television audience since Super Bowl LX in February, and up 159% vs. last year’s Game 3. Game 3 was the most-watched program of the day across all of television and in all key male and adult demos for June 8.
The series opened with the New York Knicks’ Wednesday, June 3, win over the San Antonio Spurs, which averaged 16.93 million viewers on ABC and peaked at 19.63 million at 11 p.m. ET — ABC’s most-watched Game 1 since 2018, the most-watched Game 1 on ABC ever excluding Golden State Warriors-Cleveland Cavaliers matchups, up 90% YoY, and the most-watched NBA Finals game overall since Game 6 of the 2019 Finals. The Knicks’ 105–104 Game 2 win on Thursday, June 5, averaged 16.43 million viewers and peaked at 19.42 million at 11:15 p.m. ET — ABC’s most-watched Game 2 since 2018 and up 88% YoY. NBA Finals All-Access with The Pat McAfee Show, ESPN’s alternate Game 3 presentation, averaged 1.1 million viewers — the most-watched NBA alternate telecast ever on ESPN. Game 4 was set for Wednesday, June 10, at 8:30 p.m. ET on ABC; ESPN has produced the NBA Finals on ABC since 2003.
NHL Stanley Cup Final: ESPN Averages 5M Through Four Games, Best Start Since 2015
ESPN’s exclusive presentation of the 2026 Stanley Cup Final is averaging 5 million viewers through four games — the largest championship series audience through four games since 2015 and the fourth-best Stanley Cup Final through four games since 1994, with the series-to-date audience up 101% YoY. The series has featured overtime drama, multiple one-goal games, and momentum swings throughout the first four contests.
Tuesday’s Game 4 (June 9) on ABC averaged 5.3 million viewers as the Carolina Hurricanes defeated the Vegas Golden Knights 5–3 in Las Vegas to even the series at 2-2 — the largest Game 4 audience since 2017 (Pittsburgh-Nashville, NBC), up 104% vs. Game 4 of the 2025 Final on Turner Networks and up 74% vs. Game 4 of the 2024 Final on ABC, peaking at 6.4 million from 10:30–10:45 p.m. ET. Game 3 (Saturday, June 6) was a double-overtime thriller that averaged 5 million viewers and peaked at 6.1 million from 11:45 p.m.–midnight, ranking as the most-viewed Stanley Cup Final Game 3 in 24 years — second-most since 1994, trailing only Red Wings-Hurricanes in 2002 (5.5 million, ABC). Game 3 was up 117% vs. 2025 and up 51% vs. 2024, and featured the fastest hat trick in Stanley Cup Final history and a four-goal Carolina comeback to force overtime. Game 2 (Thursday, June 4) averaged 4.7 million viewers — the most-viewed Stanley Cup Final Game 2 since 2015 (Chicago-Tampa Bay, NBC) and ESPN’s second most-watched Game 2 in its history, outdrawing every Game 2 ESPN/ABC have aired except 1997. Game 2 was up 88% vs. 2025 and up 33% vs. 2024, peaking at 5.8 million at 10:45 p.m. Game 1 delivered the largest Stanley Cup Final Game 1 audience since 2019 (St. Louis-Boston, NBC). The series returns to Raleigh for Game 5 Thursday at 8 p.m. ET on ABC, with Sean McDonough, Ray Ferraro, and Emily Kaplan calling the action.
Belmont Stakes: FOX and FS1 Combine for 3.73 Million Viewers as Golden Tempo Wins
FOX and FS1’s combined coverage of the 158th running of the Belmont Stakes Presented by NYRA Bets averaged 3.73 million viewers, peaking at 4.71 million viewers from 7:00–7:15 p.m. ET as Golden Tempo crossed the wire to win, per Nielsen Media Research.
WCWS: ESPN Delivers Most-Watched Women’s College World Series on Record
ESPN’s presentation of the 2026 NCAA Women’s College World Series was the most-watched WCWS on record, averaging 1.6 million viewers across 16 games, up 20% vs. last year’s previous all-time high. A record 15 WCWS games surpassed the million-viewer mark, with four eclipsing 2 million. The two-game championship Finals between Texas and Texas Tech — won by the Longhorns for their second-straight national title — averaged 2.2 million viewers, the second most-watched WCWS Finals on record. Game 2 on ESPN/ESPNU averaged 2.5 million viewers and peaked at 3.0 million, making it the most-watched college softball game ever (up 16% YoY). Game 1 averaged 1.9 million viewers and peaked at 2.1 million — the third most-watched WCWS Finals Game 1 ever.
The full 2026 NCAA Softball Tournament averaged 755,000 viewers across ESPN networks, up 28% YoY — the best tournament audience since 2011 — and produced 19 telecasts with more than 1 million viewers across Regionals, Super Regionals, and Oklahoma City. The Super Regionals averaged 695,000 viewers (up 48% YoY, most-watched on record), led by Arizona State-Texas (1.3 million), Texas Tech-Florida (1.1 million), and Nebraska-Oklahoma State (1.1 million). The Regional round was up 41% YoY, the most-watched since 2016. The NCAA Softball Selection Special Presented by Capital One averaged 325,000 viewers, up 27% YoY. Conference championship telecasts set network records: Texas-Alabama on May 9 drew 847,000 viewers, ESPN’s most-watched SEC Championship game since 2015; Arizona State-Texas Tech in the Big 12 final drew 597,000 viewers (most-watched Big 12 Championship on record); and Virginia Tech-Florida State in the ACC final drew 589,000 (ESPN’s most-watched ACC Championship ever). The regular season, with more than 2 billion minutes of game coverage consumed, averaged 292,000 viewers — up 78% YoY and ESPN’s most-watched college softball regular season since 2009.
U.S. Women’s Open: NBC Sports Posts Second-Largest Final Round Since 2014 as Nelly Korda Wins
NBC Sports’ presentation of the U.S. Women’s Open at The Riviera Country Club in Pacific Palisades, Calif., delivered the event’s second-largest final-round audience since 2014, averaging 1.3 million viewers across NBC and Peacock, per Nielsen Big Data + Panel and Adobe Analytics. Sunday’s final round peaked at 2.2 million viewers from 7:45–8 p.m. ET as Nelly Korda captured her first U.S. Women’s Open title with a putt on the 18th hole — what she described to NBC Sports’ Cara Banks as “a nice ice cream swirl to cap off the day.” Sunday’s audience was up 78% YoY and trailed only the 2023 event at Pebble Beach (1.6 million) as the most-watched final round since Michelle Wie’s win in 2014 (2.0 million). Saturday’s coverage averaged 1 million viewers, up 76% YoY. NBC Sports presents the 126th U.S. Open at Shinnecock Hills Golf Club in Southampton, N.Y., June 18–21, with 31 live hours of championship coverage across NBC, Peacock, and NBCSN.
UFL: Louisville Kings-Battlehawks Semifinal Drives 5% YoY Season Bump on FOX
FOX’s UFL playoff semifinal on Sunday averaged 1,066,000 viewers as the Louisville Kings defeated the St. Louis Battlehawks to advance to the United Bowl, up 22% from the 2025 UFL Playoff game on FOX (873,000), per Nielsen Media Research. Peak viewership reached 1,351,000 from 8:45–9:00 p.m. ET. With the semifinal added, the complete UFL season on FOX (including playoffs) averaged 693,000 viewers, up 5% vs. last year’s 659,000.
NCAA Baseball Super Regionals: ESPN Posts Most-Watched Round Since 2009
ESPN’s 2026 NCAA Baseball Super Regionals averaged 608,000 viewers across ESPN networks, up 31% YoY and marking the round’s largest audience since 2009. The round was also the most-consumed Super Regionals ever, with USC-North Carolina (1.3 million viewers) and Georgia-Mississippi State (1.2 million) ranking as the two most-watched Super Regional telecasts on record. Five of the 10 most-watched telecasts on record for the round came from the 2026 edition.
NASCAR: Cup Series at Michigan Up 17% YoY on Prime Video; Trucks Race Among Top 3 on FS1 This Season
The NASCAR Cup Series FireKeepers Casino 400 at Michigan (Prime Video, Sunday, June 7) averaged 2.07 million viewers per Nielsen’s Big Data + Panel measurement, up 17% vs. last year’s comparable race from Michigan International Speedway — the largest YoY jump of the entire 2026 NASCAR season when measured against the same-week race from 2025. The race earned a 0.89 household rating and peaked at 2.60 million viewers from 6:30–6:44 p.m. ET, up 24% vs. last year’s peak, as Denny Hamlin captured his 63rd Cup Series victory to tie Kyle Busch for ninth on the all-time list. Sunday’s race delivered double-digit gains across all key demos under 55 vs. 2025: P18-34 up 18% to 231,000; P18-49 up 23% to 585,000; and P25-54 up 13% to 725,000. Viewers 55+ were up 12%. Through three races, NASCAR on Prime is averaging 2.45 million viewers, up 8% vs. last season’s first three races (2.27 million), with a median age of 57.3 — nearly six years younger than NASCAR Cup Series races on linear channels this season (63.1). NASCAR Live from Michigan pre-race averaged 580,000 viewers, up 24% YoY; the 65-minute NASCAR Live from Victory Lane post-race show averaged 1.10 million, up 14% YoY. Through three races, pre-race coverage is averaging 963,000 (up 28%) and post-race 1.01 million (up 7%).
The NASCAR Craftsman Truck Series DQS Solutions & Staffing 250 at Michigan (FS1, Saturday, June 6) earned a 0.37 household rating with 657,000 average viewers per minute and peaked at 879,000 from 3:45–4:00 p.m. ET. The race ranked as the third most-watched NCTS race on FS1 this season behind only Atlanta (Race 2, 775,000) and Daytona in February (Race 1, 1.3 million), and as the No. 1 sports telecast on FS1 for the week ahead of all MLB, IndyCar, and horse racing competition. It was the most-watched NCTS race on cable from Michigan since 2013 (783,000). No direct YoY comparison, as last year’s race aired on FOX broadcast.