
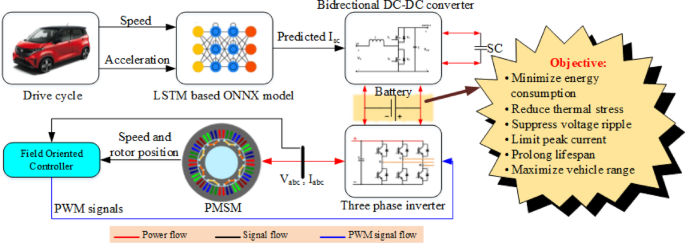
Comparative performance analysis of BEV and HBEV under the EUDC drive cycle
The European Urban Driving Cycle (EUDC), as shown in Fig. 9, serves as a representative profile for evaluating the dynamic performance of EV powertrains under mixed urban and highway conditions. The profile features multiple speed transitions, including sharp accelerations and frequent decelerations, simulating realistic scenarios such as stop-and-go traffic and highway cruising.
The cycle begins with an initial acceleration phase, where the vehicle speed ramps up from 0 km/h to approximately 70 km/h at around 60 s. A brief cruising phase follows, after which another acceleration peak occurs at approximately 290 s, reaching 100 km/h. The highest speed is observed near 120 km/h just before 400 s, followed by a rapid deceleration to zero.
Such speed variations demand agile energy management. During acceleration phases, the SC is expected to mitigate transient power demands, thereby reducing battery peak current and improving response time. Conversely, during deceleration, regenerative braking allows energy to be recovered and partially stored in the SC. This dual role of the SC plays a pivotal part in improving battery life, reducing energy consumption, and enhancing thermal performance.
The following subsections evaluate the system’s response—particularly the SC current, battery dynamics, and traction motor behavior—under the EUDC profile to assess the effectiveness of the proposed ONNX-deployed LSTM-based current prediction framework.
Fig. 9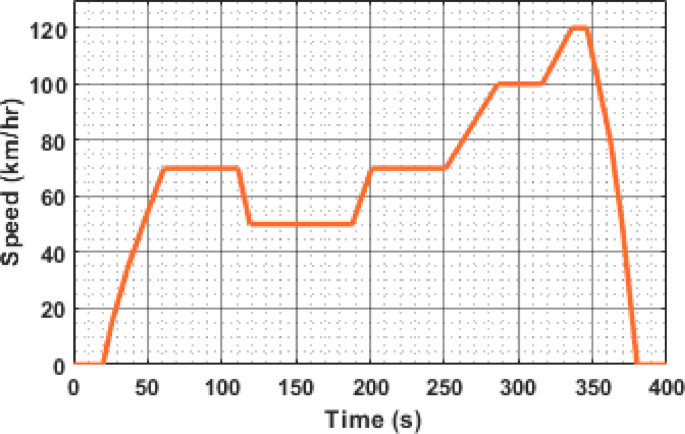
Figure 10 illustrates the reference and actual SC current profiles under the EUDC cycle. The reference current is generated via the ONNX-deployed LSTM model to represent the ideal assistance expected from the SC, while the actual current reflects its dynamic response through the bidirectional converter.
During high acceleration phases (e.g., t = 60 s, 200 s, 284 s, and 344 s), the SC actively discharges, supporting peak load demands by delivering 10 A, 10.5 A, 11.8 A, and 16.6 A, respectively. These discharges directly correspond to speed ramps identified in Fig. 9, confirming the SC’s role in reducing instantaneous battery current stress and enhancing system responsiveness.
In contrast, during regenerative braking at t = 122 s and 347 s, the SC absorbs energy with peak currents of − 20 A and − 41.5 A, respectively. The close tracking between the reference and actual current in these intervals indicates effective energy capture and bidirectional power control.
Fig. 10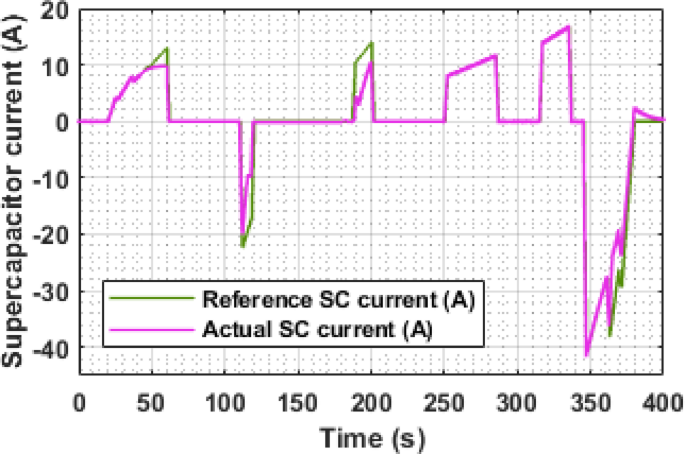
Reference and actual current of SC.
During cruising intervals, the SC remains inactive, and the battery sustains the load entirely. These periods highlight the model’s adaptive behavior, ensuring SC engagement only during high dynamic transients, thus contributing to overall energy optimization.
Fig. 11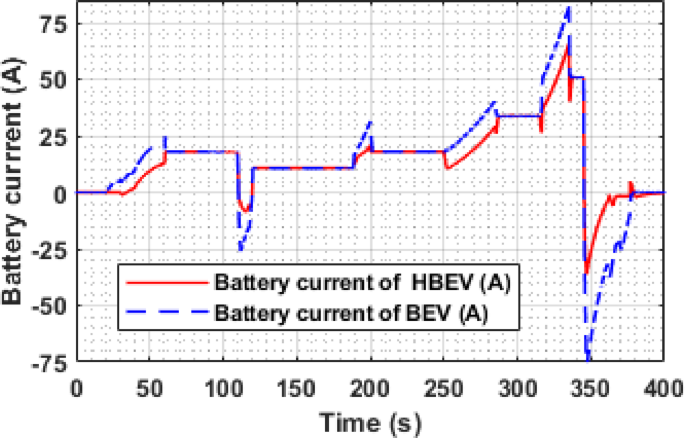
Battery current of BEV and HBEV.
The battery current profiles for both BEV and HBEV under the EUDC drive cycle are compared in Fig. 11. During acceleration intervals (e.g., at 60 s, 200 s, 284 s, and 344 s), the BEV battery current peaks sharply at 25 A, 31 A, 41 A, and 82.7 A, respectively. In contrast, the HBEV battery current is significantly lower at 18 A, 20.3 A, 29.2 A, and 65.1 A for the same events—corresponding to peak current reductions of approximately 28%, 34%, 28.8%, and 21.3%. This indicates that the SC effectively alleviates transient load demand, mitigating battery stress during high-power acceleration.
During regenerative braking periods (notably around 122 s and 347 s), the BEV configuration registers deep negative spikes of −26 A and − 75 A, reflecting direct regenerative energy recovery into the battery. In comparison, the HBEV profile is more moderate, with corresponding values of −3.3 A and − 36 A. These reductions confirm that the SC absorbs a considerable share of braking energy, avoiding harsh reverse current flow into the battery.
For cruising intervals—such as between 61 and 110 s, 120–186 s, and other marked regions—the current profiles for both systems converge, indicating that the SC remains inactive and the battery alone meets the propulsion demand.
In addition to peak current suppression, the RMS battery current for the EUDC cycle is also reduced due to SC integration. Specifically, the BEV registers an RMS current of 19.82 A, while the HBEV records 19.24 A—yielding a net reduction of approximately 2.93%. This modest but measurable decrease reflects the overall smoothing effect of the SC across varying drive conditions. Consequently, the HESS configuration substantially improves current uniformity, reduces thermal loading, and supports extended battery durability compared to conventional BEV operation.
Battery temperature evolution for both BEV and HBEV configurations under the EUDC drive cycle is examined in Fig. 12. The thermal response is obtained using a MATLAB Simulink-based battery thermal model that incorporates a 50–50% ethylene glycol cooling system. A steeper rise in BEV battery temperature is observed, especially beyond 300 s, coinciding with high-power acceleration and regenerative braking phases. The inclusion of the SC in the HBEV mitigates these thermal spikes by buffering peak current exchanges.
At approximately 360 s, the BEV battery reaches a peak temperature of 302.2 K, primarily driven by a high regenerative current of −75 A. In contrast, the HBEV maintains a lower peak of 300.8 K under similar load conditions, where the peak charging current is reduced to −36 A. Over the entire cycle, average battery temperatures for BEV and HBEV are calculated as 300.5 K and 299.1 K, respectively. While the ~ 1.4 K difference may seem modest, it plays a crucial role in minimizing thermal degradation, enhancing battery reliability, and reducing the risk of thermal runaway during sustained operation.
The observed disparity in temperature rise is directly linked to the current behavior outlined in Fig. 11, wherein the BEV experiences larger current excursions, resulting in higher I²R losses. The HBEV, on the other hand, benefits from SC support that reduces thermal stress by smoothing power flow and moderating internal heating within the battery pack.
Battery voltage profiles for both BEV and HBEV configurations under the EUDC drive cycle are analyzed in Fig. 13. The voltage response is governed by the discharge behavior during acceleration and the regenerative charging during deceleration phases. Due to higher transient loads, BEV experiences more pronounced voltage drops, while the HBEV benefits from SC support, which moderates these fluctuations.
At major acceleration points (t ≈ 60 s, 200 s, 284 s, and 344 s), the BEV battery voltage drops from its nominal 346.7 V to 344.7 V, 344.5 V, 344.4 V, and 342.4 V, respectively. In contrast, the corresponding voltage drops in the HBEV are mitigated, registering higher values of 345.1 V, 345.0 V, 344.81 V, and 343.1 V. This demonstrates the SC’s role in alleviating transient loading on the battery during power-intensive events.
During regenerative braking, particularly at t ≈ 347 s, the BEV battery voltage peaks at 355.8 V, while the HBEV reaches 351.0 V. Over the entire drive cycle, average battery voltages are calculated as 346.0 V for the BEV and 345.9 V for the HBEV. Based on the maximum and minimum observed values, the voltage ripple is quantified as 3.87% for the BEV and 2.28% for the HBEV, indicating a 1.59% reduction in the HBEV due to supercapacitor buffering.
The HESS configuration ensures a more stable voltage profile by moderating the impact of rapid load changes. This not only enhances voltage regulation but also contributes to reduced battery stress, improved conversion efficiency, and more consistent vehicle performance—particularly during high dynamic load phases such as acceleration and braking. The data clearly illustrate the stabilizing influence of SC support on battery voltage behavior.
Fig. 12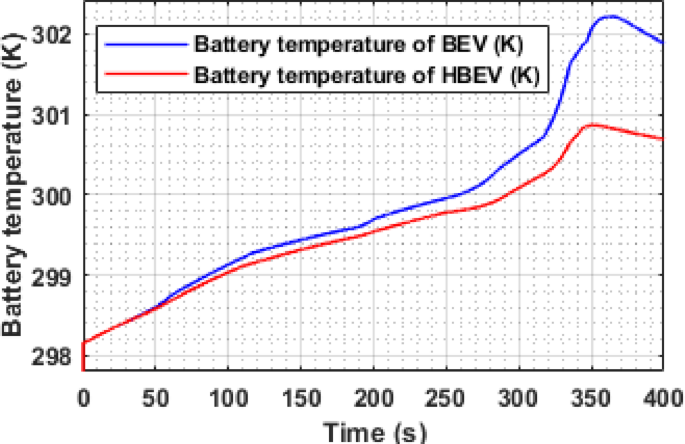
Battery temperature of BEV and HBEV.
Figure 14 presents the battery power response of BEV and HBEV configurations throughout the EUDC cycle. Power demand is directly influenced by vehicle acceleration and deceleration, with sharp transitions causing significant stress on the battery in conventional BEVs.
During peak acceleration at t ≈ 334.7 s, the BEV records a battery power demand of 27.92 kW, while the HBEV limits it to 22.49 kW, reflecting a reduction of 18.1%. This mitigation is attributed to the supercapacitor, which supplements the traction motor during transients, offloading the battery.
Similarly, during regenerative braking at t ≈ 347 s, the BEV absorbs a peak negative power of − 25.1 kW, whereas the HBEV restricts it to − 12.7 kW, resulting in a 49.4% reduction in peak charging power. This reduced regenerative burden indicates that the SC captures a substantial portion of the recovered energy, thereby protecting the battery from high current influx. Overall, the HBEV configuration demonstrates significantly smoother power transitions, reducing peak power excursions on both ends. The presence of the SC thus proves vital in achieving a more balanced and robust energy management framework under dynamic driving conditions.
The energy consumption trajectories of both BEV and HBEV are shown in Fig. 15. Both systems exhibit a steady rise in energy usage throughout the EUDC drive cycle, with a sharper slope observed during acceleration-intensive intervals. Following the full completion of the cycle, the total energy consumed by the BEV reaches 547.5 Wh, whereas the HBEV system reports a lower value of 516 Wh, reflecting a net reduction of 31.5 Wh, equivalent to 5.75%.
This decrease is primarily attributed to the SC’s role in handling transient power demands and regenerative absorption, which alleviates direct battery load. By reducing the battery’s active participation during dynamic transitions, the system improves overall energy efficiency across the drive cycle without compromising performance.
Fig. 13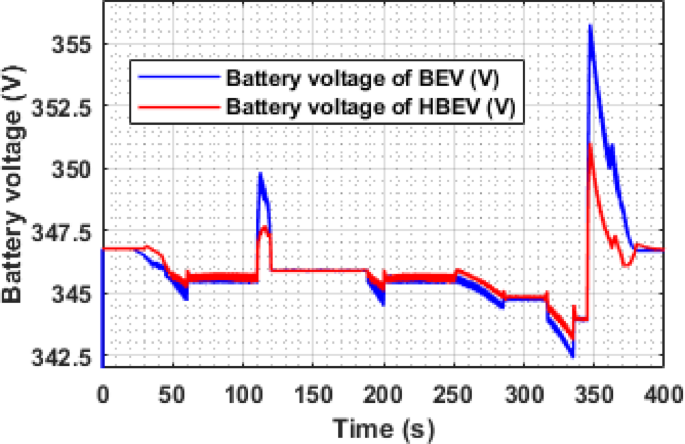
Battery voltage of BEV and HBEV.
The speed responses of both BEV and HBEV configurations are compared in Fig. 16. During constant-speed segments of the EUDC cycle—specifically over the intervals 61–110 s, 120–186 s, 201–250 s, 287–315 s, and 337–345 s—the observed motor speeds stabilize at approximately 1750 RPM, 1250 RPM, 1750 RPM, 2500 RPM, and 3000 RPM, respectively. In both systems, the PMSM effectively tracks the reference speed profile with high fidelity.
Minor deviations are seen during rapid transitions, largely attributed to inertia and transient response delays. Nonetheless, the accurate alignment between actual and reference speeds across both systems validates the effectiveness of the FOC strategy and confirms that the integration of SC assistance does not adversely impact dynamic speed control.
Fig. 14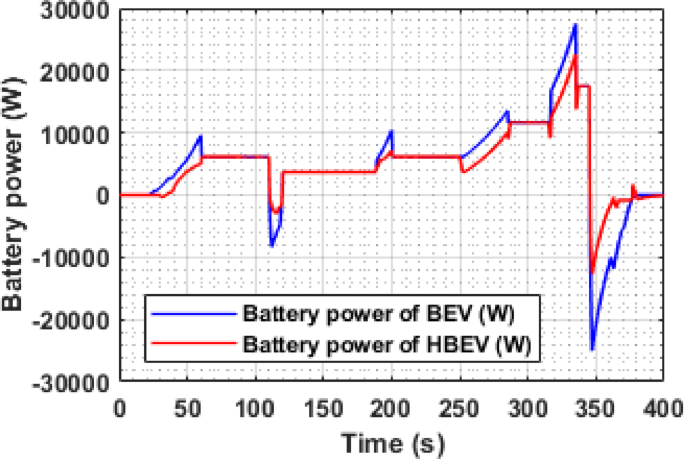
Battery power of BEV and HBEV.
Figure 17 presents the RMS stator voltage behavior of the PMSM for both BEV and HBEV configurations during the EUDC cycle. The waveform displays a step-like pattern that mirrors the speed transitions across the drive cycle. At rest (t < 50 s), the voltage remains at zero, indicating motor inactivity. As the cycle progresses, the stator voltage increases or decreases in response to the speed command.
For the steady-state speed intervals of 1750 RPM, 1250 RPM, 1750 RPM, 2500 RPM, and 3000 RPM, the corresponding stator voltages are observed to be 130.6 V, 93.5 V, 130.6 V, 189 V, and 232 V, respectively. These results confirm that the inverter appropriately adjusts the stator voltage to match the torque and speed requirements. The near-identical voltage profiles for BEV and HBEV also indicate that SC integration primarily affects current and power dynamics, without significantly altering the voltage regulation process.
The PMSM stator RMS current varies significantly in response to the dynamic phases of the EUDC cycle, as shown in Fig. 18. During acceleration peaks at approximately 60 s, 200 s, 284 s, and 344 s, the current rises to 44.4 A, 47.8 A, 43.2 A, and 71.1 A, respectively. Peak regenerative braking at 122 s and 347 s results in current spikes of 51.72 A and 86.84 A. In contrast, during constant-speed intervals, the current magnitude reduces substantially due to lower torque demand, improving overall system efficiency and reducing unnecessary energy losses.
The real power analysis of the PMSM during the EUDC cycle reveals distinct peaks during acceleration phases, with motor power reaching 9.5 kW, 10.32 kW, 13.6 kW, and 27.5 kW at approximately t = 60 s, 200 s, 284 s, and 344 s, respectively. These values align closely with the battery-side power demand of 9.64 kW, 10.47 kW, 13.8 kW, and 27.92 kW in the BEV, as shown in Fig. 19, from which an average inverter efficiency of 98.5% is inferred. During deceleration at t = 122 s and 347 s, the motor exhibits regenerative power peaks of −8.24 kW and − 25.1 kW, respectively, confirming effective energy recovery during braking.
The electromagnetic torque developed by the PMSM varies according to load conditions in the EUDC cycle as indicated in Fig. 20. During acceleration phases at t ≈ 60 s, 200 s, 284 s, and 344 s, the motor produces peak torques of 52.26 Nm, 56 Nm, 50.8 Nm, and 85.1 Nm respectively, to overcome inertia and propel the vehicle. Conversely, during regenerative braking phases at t = 122 s and 347 s, the torque reverses direction, reaching peak negative values of −60.3 Nm and − 99.9 Nm, respectively, enabling effective deceleration and energy recovery.
Fig. 15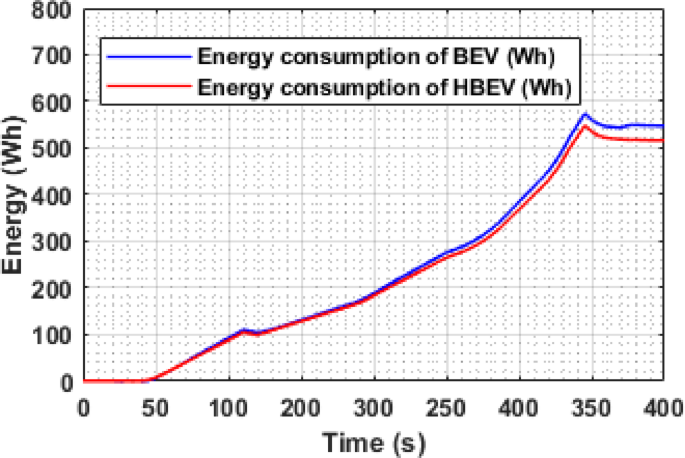
Battery energy consumption of BEV and HBEV..
Comparative performance analysis of BEV and HBEV under the IM240 drive cycle
The IM240 drive cycle features a dynamic velocity profile that includes repeated acceleration and deceleration events representative of urban and highway driving. As depicted in Fig. 21, the cycle begins from standstill, accelerating to around 36.5 km/h at 15.4 s, followed by multiple speed fluctuations. Notably, a sharp deceleration to 0 km/h occurs at 92.8 s, after which the vehicle accelerates rapidly to approximately 42.3 km/h by 107 s. The peak speed of 91.2 km/h is recorded at 200 s, culminating in a final rapid deceleration to zero. These dynamic variations significantly influence the loading patterns on the electric powertrain, directly affecting battery utilization, regenerative braking potential, and overall energy efficiency for both BEV and HBEV systems.
During the IM240 drive cycle, the reference and actual supercapacitor currents exhibit a closely matched profile, validating the performance of the SC control scheme. As shown in Fig. 22, the SC supplies 7.1 A at 9.1 s during the initial acceleration phase. A sharp deceleration at 83.7 s causes the SC to absorb regenerative energy, drawing a peak charging current of −16.8 A. The highest discharge current of 17.3 A is observed at 160 s during a strong acceleration, while the maximum regenerative current reaches − 27.56 A at 226 s. The minimal deviation between the reference (dashed blue) and actual (solid orange) current profiles throughout the cycle indicates accurate tracking and robust control, enabling efficient transient power handling in the hybrid system.
Fig. 16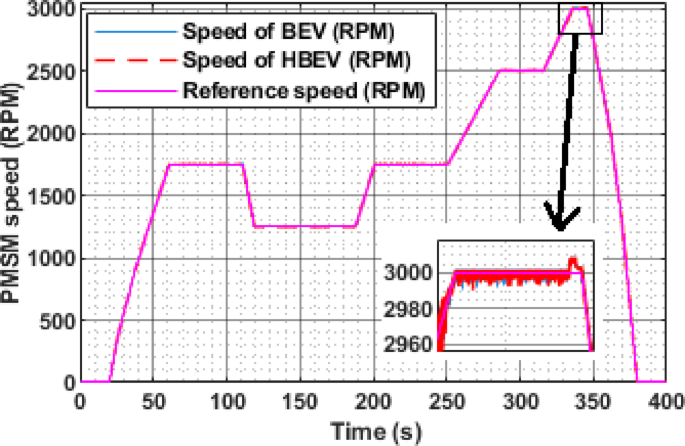
Reference and actual speed of PMSM.
A clear difference in battery current profiles between BEV and HBEV configurations can be observed in Fig. 17, particularly during transient conditions. At 9.1 s, the BEV draws a peak current of 9.2 A during acceleration, whereas the HBEV current is limited to just 2.1 A—demonstrating a 77.2% reduction due to SC assistance. The highest acceleration demand occurs at 160 s, where the BEV reaches 51.59 A, while the HBEV peaks at 34.3 A, showing a 33.5% mitigation in current stress. During deceleration at 226 s, the BEV exhibits a regenerative peak of −62.66 A, while the HBEV reduces this to −35.1 A, yielding a 43.98% reduction in reverse current. These results demonstrate the SC’s effective role in moderating current surges during dynamic load events.
Fig. 17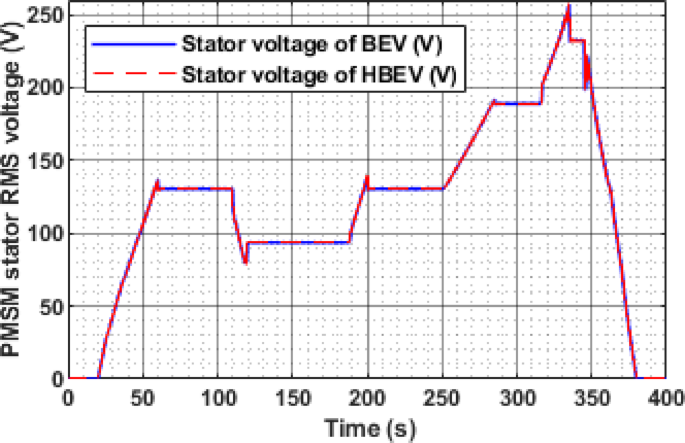
In addition to peak current mitigation, the RMS battery current across the IM240 cycle is also reduced. The BEV records an RMS current of 9.44 A, whereas the HBEV achieves a lower value of 8.83 A—reflecting a 6.46% overall reduction. This decrease underscores the SC’s contribution to smoothing battery load over time, reducing thermal cycling, and enhancing system efficiency under realistic urban driving scenarios.
The instantaneous temperature response of the battery, measured under a liquid cooling setup using ethylene glycol, is compared for BEV and HBEV configurations in Fig. 24. At 160 s, a peak battery current of 51.59 A in the BEV leads to a temperature rise reaching 300.1 K by 169 s, whereas the HBEV, limited to 34.3 A, peaks at only 299.3 K—a reduction of 0.8 K. Similarly, at 226 s during strong regenerative braking, the BEV temperature climbs to 301.43 K at 232 s, while the HBEV records 299.62 K, resulting in a more pronounced difference of 1.81 K.
By the end of the cycle, the final temperatures are 301.4 K for the BEV and 299.64 K for the HBEV, and the average battery temperatures across the entire cycle are 300.1 K and 298.2 K, respectively. This 1.9 K average reduction in the HBEV case highlights the supercapacitor’s role in suppressing temperature rise during current surges, contributing to more efficient thermal regulation under dynamic load conditions.
The instantaneous voltage response of the battery during the IM240 cycle is compared between BEV and HBEV configurations in Fig. 25. During acceleration phases, both systems exhibit voltage drops due to elevated current demands, with the most significant dip observed at 160 s, where the BEV voltage falls from 346.7 V to 343.4 V, while the HBEV exhibits a milder drop to 344.1 V. This reduced voltage sag in the HBEV highlights the stabilizing influence of the SC during transients.
Regenerative braking events result in voltage recovery, peaking around 225 s at 354.4 V in the BEV and 351 V in the HBEV. By absorbing part of the regenerative energy, the SC prevents sharp voltage overshoots in the hybrid configuration. Over the full cycle, average battery voltages are 346.9 V for the BEV and 346.7 V for the HBEV. Corresponding voltage ripple values are 3.17% and 1.99%, confirming a 1.18% reduction in the HBEV system. This smoother voltage profile reflects improved DC bus stability, contributing to reduced battery stress and enhanced converter performance.
Fig. 18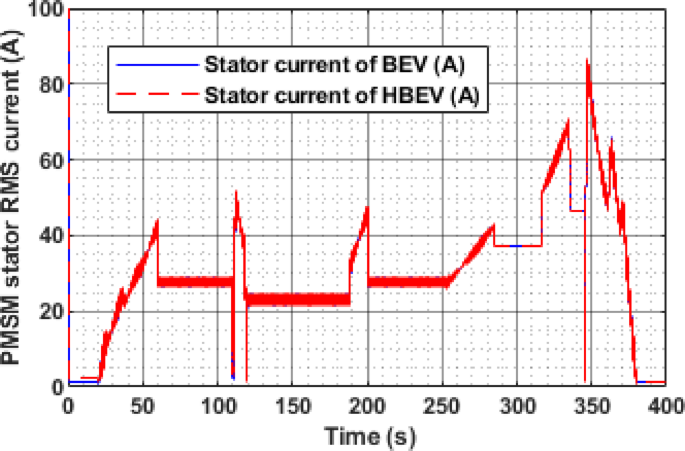
The instantaneous battery power response during the IM240 cycle is compared for BEV and HBEV configurations in Fig. 26. At 160 s, corresponding to peak acceleration, the battery in the BEV supplies 17.1 kW, while in the HBEV, the demand drops to 11.7 kW. This 5.4 kW difference, amounting to a 31.6% reduction, is supplied by the SC, thereby offloading transient load from the battery.
During regenerative braking at 225 s, the BEV exhibits a peak negative power of −20.6 kW, compared to −12.44 kW in the HBEV, indicating that the SC absorbs 8.16 kW, reducing the battery’s charging stress by 39.6%. These results confirm the SC’s dual role, supporting propulsion during high-demand phases and capturing regenerative energy, thereby enhancing the hybrid system’s energy management capability and reducing battery fatigue.
The variation in instantaneous energy consumption for both BEV and HBEV configurations over the IM240 drive cycle is shown in Fig. 27. Energy spikes are observed during acceleration and regenerative braking phases due to transient power flow. By the end of the cycle, the total battery energy consumption is 51.3 Wh in the BEV, compared to 44.96 Wh in the HBEV, reflecting a 6.34 Wh reduction, or 12.36%, achieved through SC support. This notable reduction underscores the SC’s role in optimizing energy flow during dynamic events, ultimately enhancing the system’s overall efficiency and reducing battery usage.
Fig. 19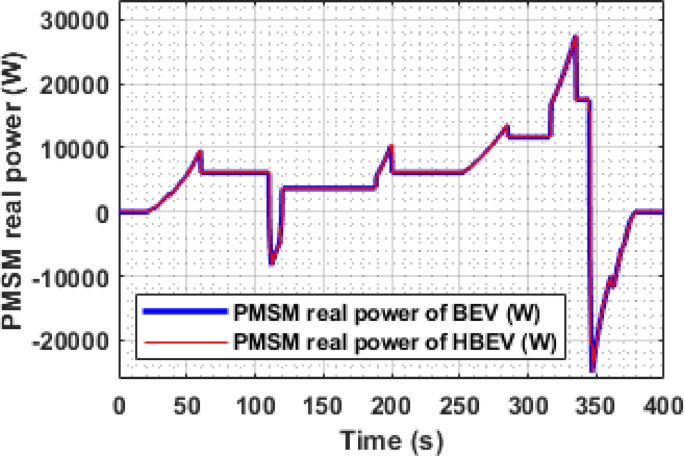
The instantaneous speed response of the PMSM under the IM240 cycle, as illustrated in Fig. 28, shows that both BEV and HBEV configurations accurately track the reference speed despite frequent acceleration and deceleration events. The motor achieves a peak speed of 2534 RPM at 200 s, confirming the responsiveness and stability of the control system across dynamic operating conditions. No significant overshoot or lag is observed, indicating effective speed regulation in both configurations.
Fig. 20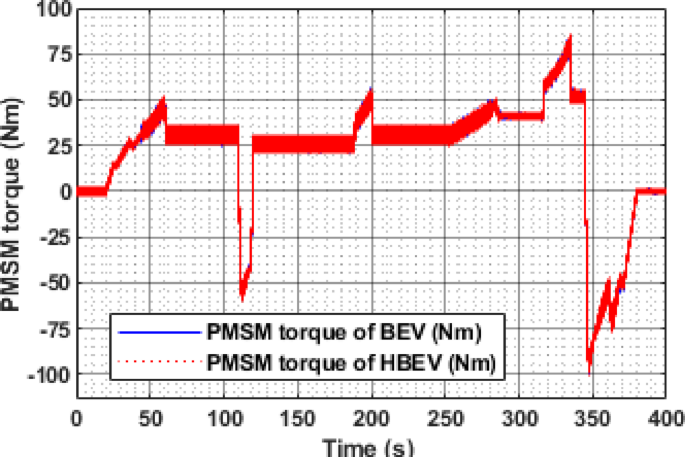
Electromagnetic torque of PMSM.
The instantaneous RMS stator voltage of the PMSM for both BEV and HBEV, as shown in Fig. 29, dynamically follows the motor speed profile. The inverter actively modulates the stator voltage in response to the reference speed to maintain torque demand and efficiency. A notable voltage spike of 183.2 V is observed at 185 s during a rapid transient, while the highest regular operating voltage of 174.84 V coincides with the peak motor speed of 2534 RPM at 200 s. These voltage fluctuations reflect the system’s response to varying load demands and confirm the robustness of voltage regulation across dynamic drive conditions.
The instantaneous Stator current of the PMSM for both BEV and HBEV configurations is presented in Fig. 30. Throughout the IM240 drive cycle, both systems exhibit identical current profiles, indicating that the supercapacitor integration primarily affects battery-side dynamics rather than motor-side operation. During peak acceleration at 160 s, the stator current reaches 79.6 A, while the highest decelerative current of 124.6 A is observed at 226 s. These peak values correspond to periods of intense energy exchange, highlighting the PMSM’s response to rapid torque demands during acceleration and effective regenerative braking during deceleration.
The instantaneous real power consumption of PMSM for both BEV and HBEV is shown in Fig. 31. Positive power values are observed during acceleration phases, indicating active power delivery to the motor, while negative values during deceleration reflect regenerative energy flow back to the sources. At 160 s, the peak motoring power reaches 17.06 kW, whereas the highest regenerative power of −20.76 kW occurs at 225 s. Notably, during the stationary interval between 92 s and 97.5 s—when the speed is zero—the motor consumes no power, confirming the proper functioning of the FOC strategy and demonstrating efficient dynamic response to varying drive conditions.
Fig. 21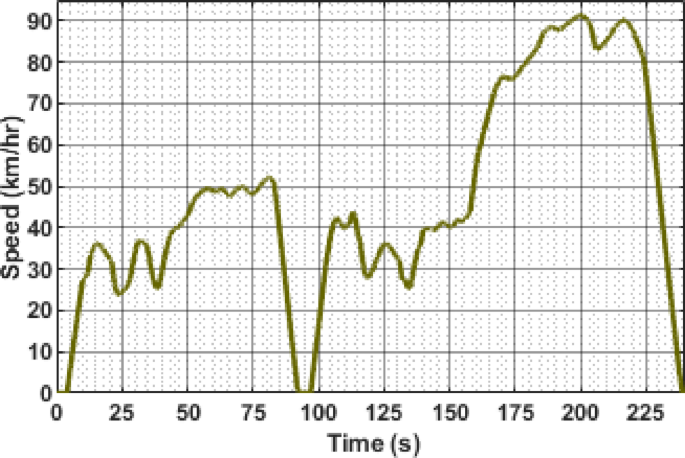
The instantaneous electromagnetic torque of the PMSM under IM240 conditions is presented in Fig. 32. Positive torque values are observed during acceleration phases, driven by the q-axis current component to meet dynamic load demands. In contrast, during deceleration, the q-axis current reverses, producing negative torque that enables regenerative braking by opposing the rotor motion. The peak motoring torque reaches 91.1 Nm at 160 s, while the highest regenerative torque of −139.4 Nm is recorded at 226 s, highlighting the PMSM’s responsive torque control across varying operating conditions. The consolidated performance metrics of the BEV and HBEV configurations under both EUDC and IM240 drive cycles are summarized in Table 5. Key parameters such as peak battery current, RMS current, voltage ripple, temperature, power, and energy consumption are compared, highlighting the improvements achieved through SC assistance.
Fig. 22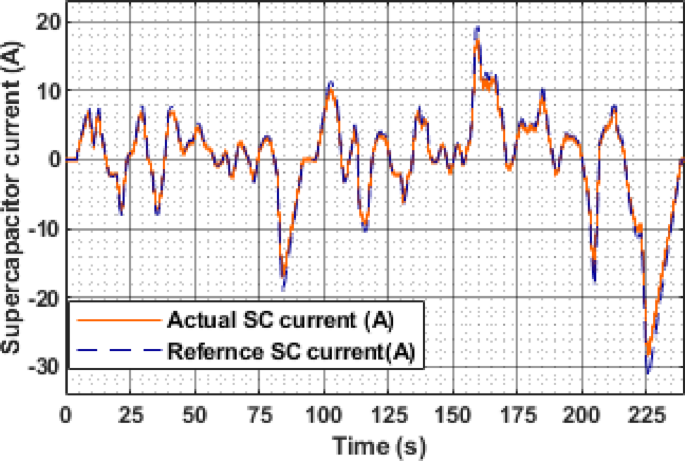
Reference and actual current of SC.
Fig. 23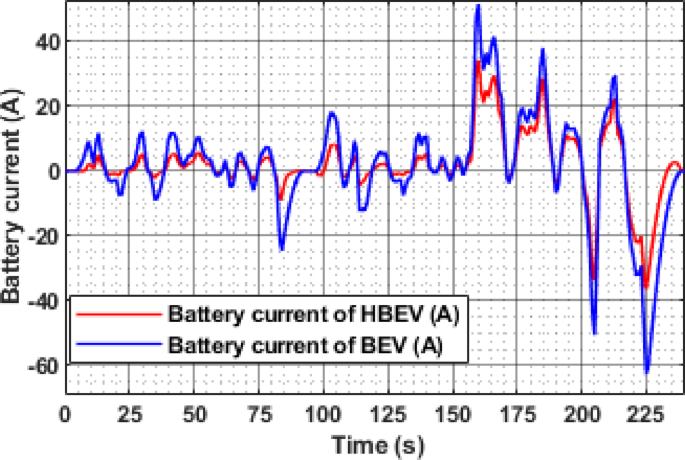
Battery current of BEV and HBEV.
Fig. 24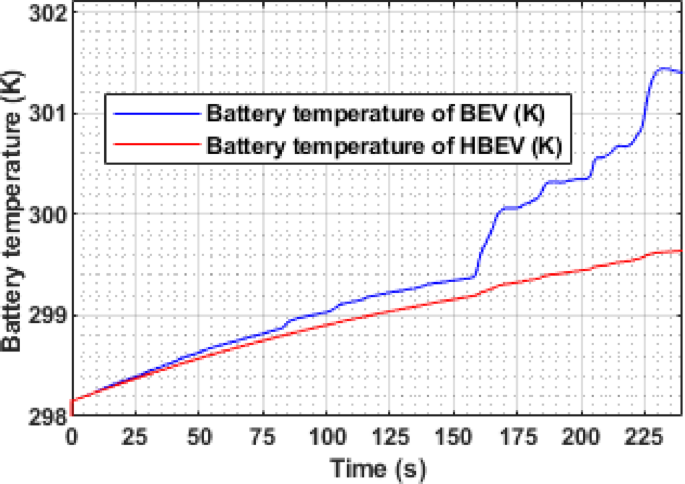
Battery temperature of BEV and HBEV.
Fig. 25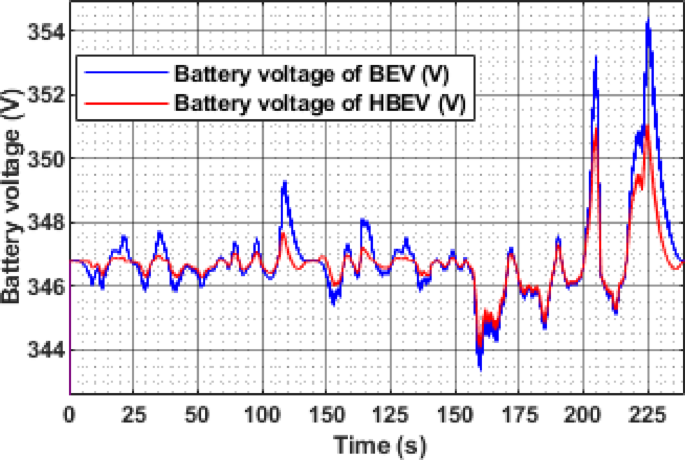
Battery voltage of BEV and HBEV.
Table 5 Performance comparison under EUDC and IM240.Fig. 26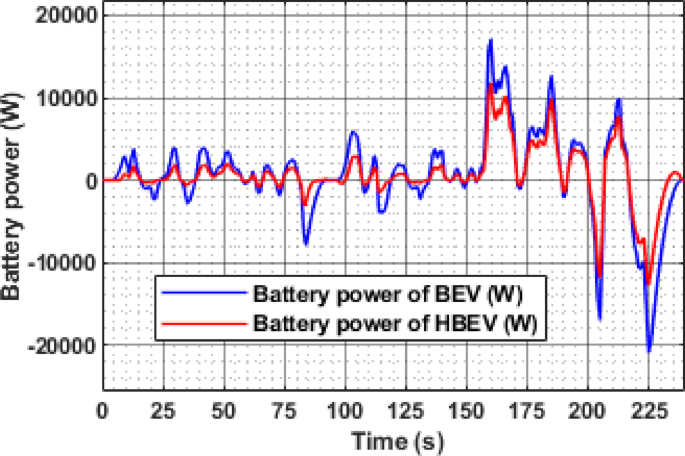
Battery power of BEV and HBEV.
Fig. 27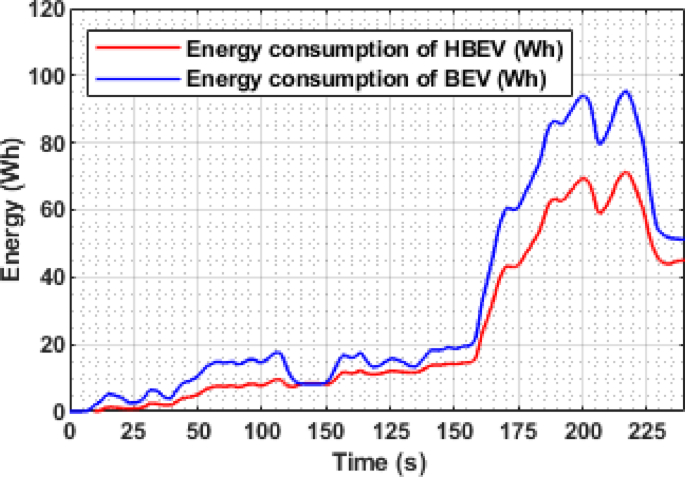
Battery energy consumption of BEV and HBEV.
Fig. 28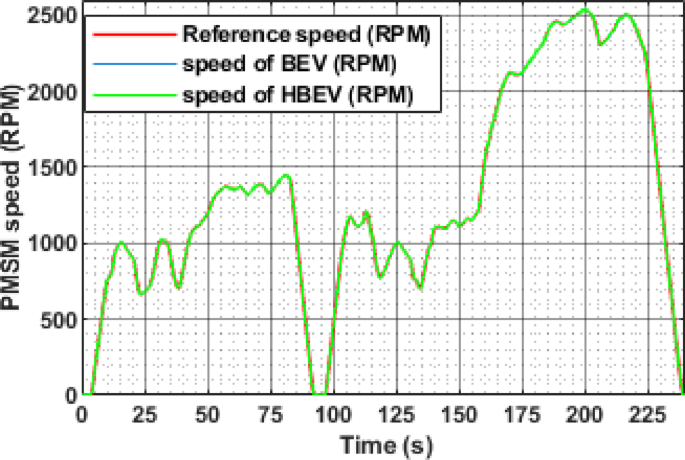
Reference and actual speed of PMSM.
Fig. 29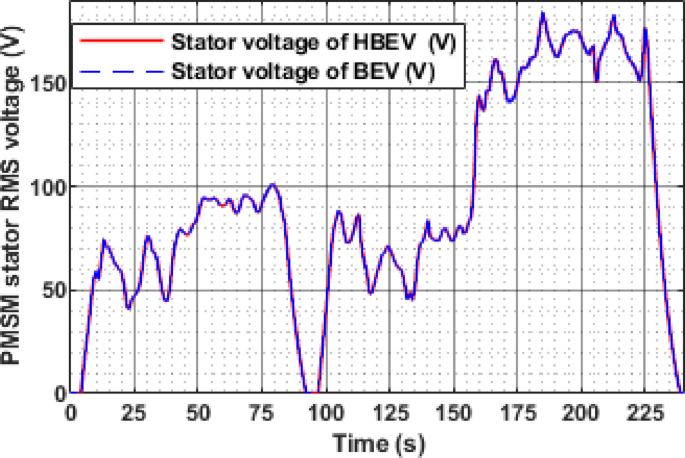
Fig. 30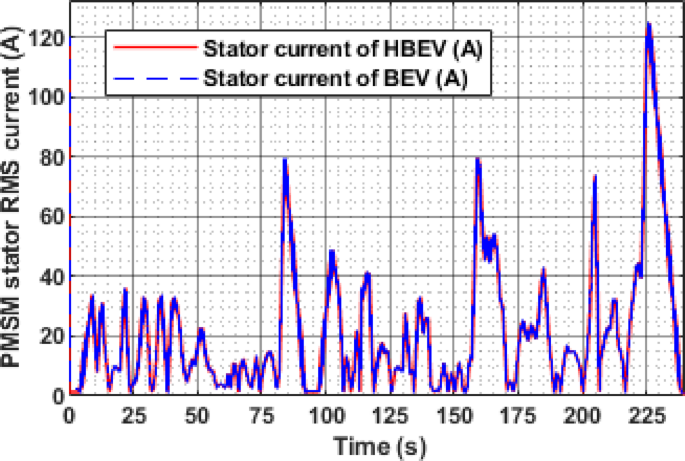 Fig. 31
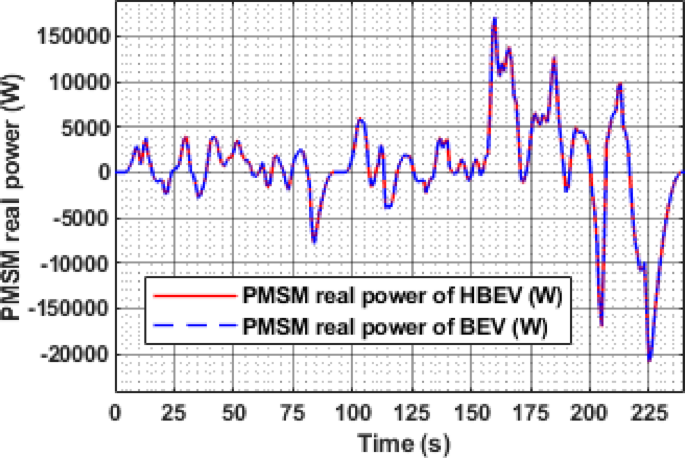 Fig. 32
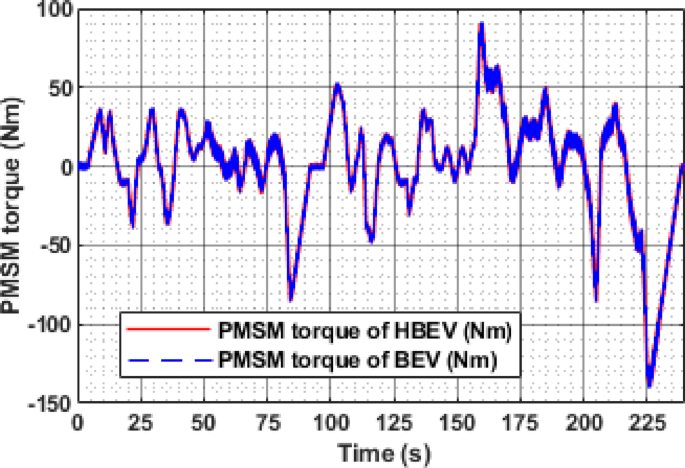
Electromagnetic torque of PMSM.
Table 6 provides a comparative overview of RMS and peak current reduction achieved by various energy management strategies across different drive cycles. Techniques such as ANFIS + DPR and GWO + SVM show moderate RMS current reductions ranging from 3.3 to 11.43%, while WT and fuzzy logic-based methods report significant peak current reductions of over 50% under highly transient cycles like NYCC. Similarly, AFNN-based strategies have achieved peak current mitigation up to 51% in UDDS.
In comparison, the proposed LSTM + ONNX framework demonstrates a balanced improvement in both RMS and peak current performance. Under the IM240 cycle, it achieves a 6.38% reduction in RMS current and 33.51% reduction in peak current, while under the more aggressive EUDC profile, it delivers 2.92% RMS and 21.3% peak current reduction. Although slightly lower in magnitude than some heuristic approaches under specific conditions, the proposed method offers consistent, real-time control adaptability with less reliance on drive cycle-specific tuning—highlighting its potential for generalizable implementation in embedded battery-supercapacitor hybrid systems.
Table 6 Comparative analysis of RMS and peak current reduction performance across various EMS methods.