

Key Takeaways
Oklahoma offers the most purchasing power of any state, with a low cost of living and affordable housing.
Hawaii’s cost of living runs 84% above the U.S. average, more than double that of Oklahoma, with housing costs nearly four times as high.
Most people know that California is far more expensive than states like Oklahoma. What you might not know is just how thoroughly gaps among the states rewrite budgets and financial options.
To compare costs across states, the Missouri Economic Research and Information Center scores each one against a national baseline of 100. (Cheaper states fall below it, pricier ones above.) Paired with Census data on income, home values and rent, the 2025 figures reveal just how wide state-to-state gaps have grown. It also helps explain why nearly 15 million Americans relocated last year, many of them chasing lower costs.
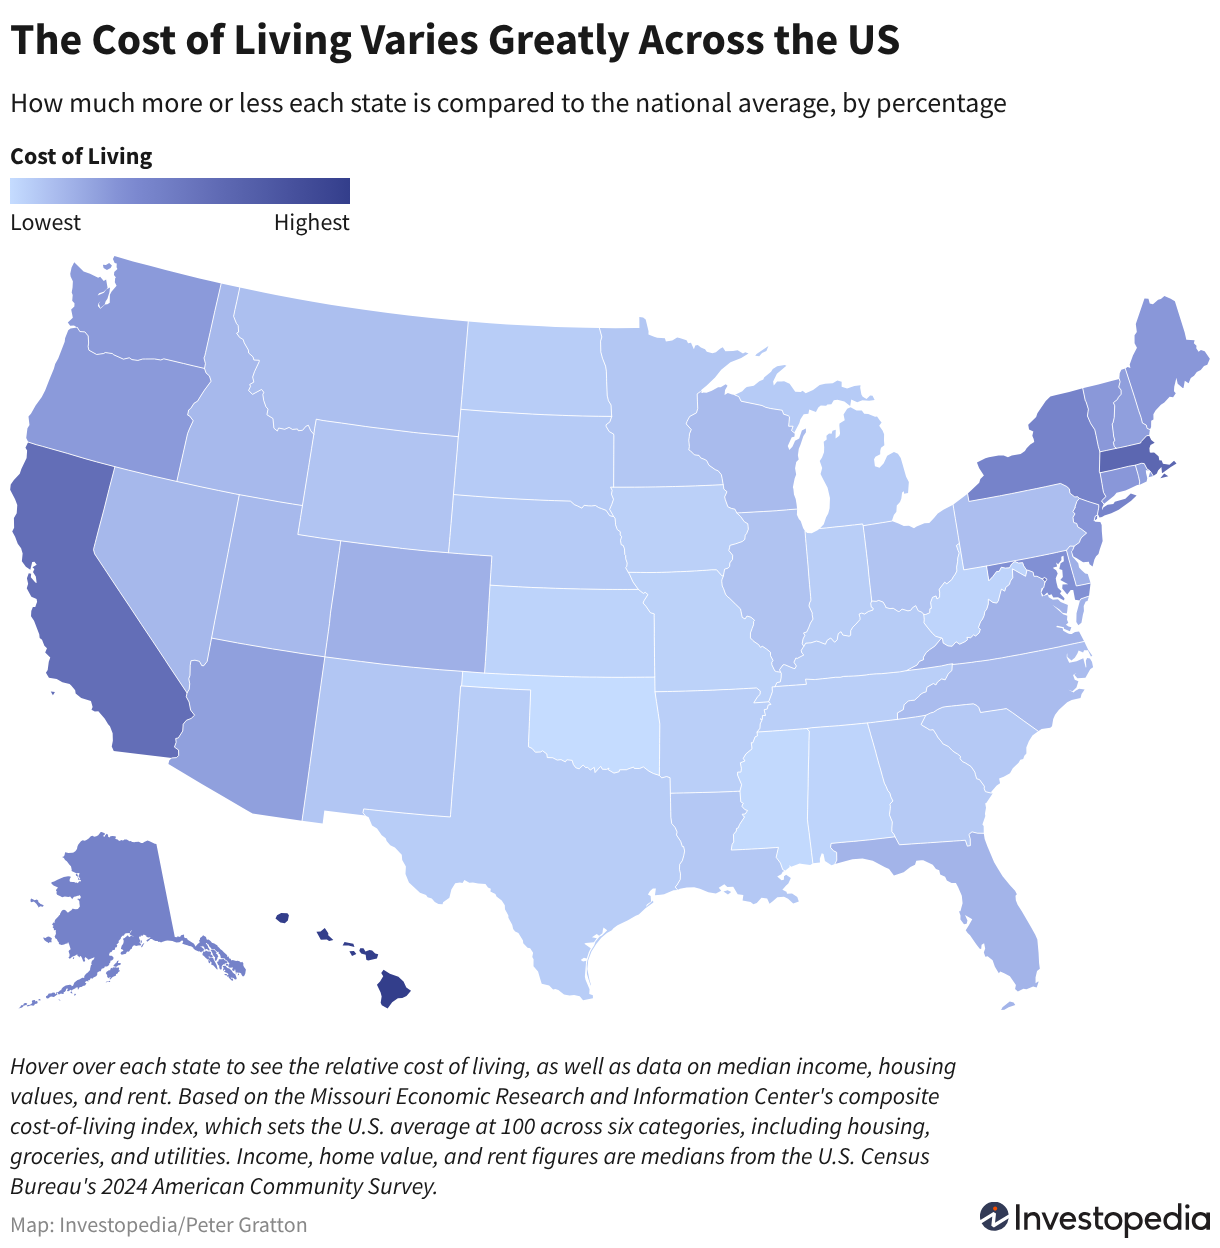 Where Your Dollar Goes Furthest
Oklahoma ranked as the most affordable state in the country, with a MERIC composite index of 84.7, about 15% below the national average. Mississippi (86.0), West Virginia (88.0), Alabama (88.1), and Kansas (88.4) rounded out the five cheapest. The most affordable states cluster almost entirely in the South and Midwest, a pattern that holds whether MERIC metrics assess the cost of groceries, utilities, transportation or healthcare.
Housing drives the largest share of the local cost of living. For MERIC’s housing subindex, Oklahoma is at 68.8, about 31% below the U.S. average. The state’s median home value is $222,100, according to the 2024 American Community Survey (ACS). That’s a price where a 10% down payment is $22,000, not $88,000, as it would be in Hawaii.
Tennessee complicates the picture. Its composite index of 90.1 puts it among the 10 most affordable states, yet its median home value has climbed to $332,600, reflecting years of rising demand as more people move there.
Where Costs Run the Highest
Hawaii was the most expensive state by a considerable margin, with a MERIC index value of 183.9, meaning it costs 84% more than the national average. Its housing subindex of 299.0 is triple the U.S. average, and a median home costs $875,900, nearly four times what buyers pay in Oklahoma, according to ACS data. The state’s median monthly rent of $1,942 is the second highest in the Census data.
Massachusetts ranked second overall with a composite index of 148.5, followed by California (143.1), the District of Columbia (137.8), and New York (125.8). California’s housing subindex of 199.4—about double the national average—reflects decades of problems increasing housing supply there. Its median gross rent of $2,104 was the highest of any state, per ACS data. California was the top outbound migration state in 2025, according to data from North American Van Lines, with housing costs and the overall cost of living cited as primary drivers.
New Jersey offers an interesting mix. Its composite of 115.3 placed it among the most expensive states, yet its median household income of $104,294, second in the Census behind only Massachusetts and the District of Columbia, gives residents more financial room to afford the higher cost of living.
The Salary Illusion
To get a rough read on the median household’s purchasing power, we can divide each state’s median household income by its MERIC composite index, a standard measure of affordability.
Oklahoma’s $66,148 median income, adjusted for its below-average cost structure, would yield about $78,100 in terms of the overall American cost of living. Massachusetts’s $104,828 median income, nearly $39,000 higher, yields only about $70,600.
Given the divergences between these and other states, Americans are learning that a salary tells you what you’ll earn—but your ZIP code tells you what it’s worth.
Read the original article on Investopedia