
The country comparison spans 1.7 percentage points and forms three practical growth bands across the forecast period.
The USA remains 0.6 percentage point above the UK through food-away-from-home demand and state-level pressure on selected single-use foodware.
The UK remains 0.3 percentage point above Australia as Plastic Packaging Tax exposure and hospitality packaging demand support lower-plastic serviceware conversion.
Australia remains 0.3 percentage point above Germany through national packaging targets and continuing packaging-regulation reform.
Germany remains 0.5 percentage point above France as reusable-offer requirements influence takeaway packaging choices and foodservice operators compare certified alternatives.
France closes the displayed range through restrictions on selected single-use plastic products and standards-based compostability requirements.
Comparable CAGRs can create different entry conditions due to foodservice demand, packaging-policy pressure, certification requirements, composting access and operator purchasing behavior. Full report coverage includes North America, Latin America, Western Europe, Eastern Europe, East Asia, South Asia & Pacific, Middle East & Africa.
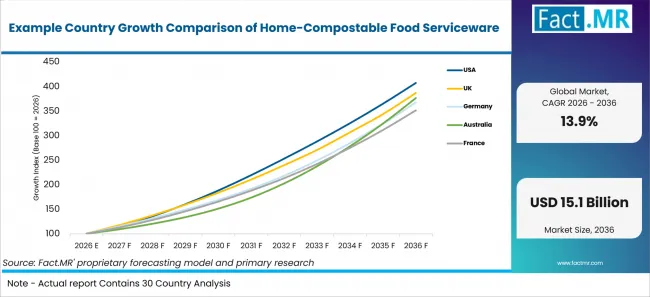
Example Country Growth Comparison Of Home Compostable Food Serviceware | Source: Fact.MR
Share
What supports USA adoption?
15.1% CAGR, with food-away-from-home spending and selected state restrictions on foam foodware used as demand context.
USDA ERS reported in June 2026 that inflation-adjusted U.S. food-away-from-home spending reached USD 1.41 trillion in 2025, expressed in 2025 dollars. Separately, food away from home accounted for 56.3% of total U.S. food expenditures in 2025.
How is the UK scaling demand?
14.5% CAGR, with Plastic Packaging Tax and hospitality packaging demand used as market context.
HMRC reported in August 2026 that accrued Plastic Packaging Tax revenue totalled GBP 250 million in financial year 2025 to 2026. The tax applies to qualifying plastic packaging containing less than 30% recycled plastic. The rate, which was GBP 223.69 per tonne in 2025 to 2026, increased to GBP 228.82 per tonne from April 1, 2026.
What supports Australia’s growth?
14.2% CAGR, with national packaging targets and the packaging-regulation reform process used as market context.
APCO’s November 2025 Australian Packaging Consumption & Recovery Data report estimated that 86% of Australian packaging placed on the market in 2023–24 had good recycling potential under its reusable, recyclable or compostable packaging framework. DCCEEW stated in March 2026 that packaging-regulation reforms remained under development and that further testing and updating of the proposed Design for Kerbside Recyclability Grading Framework was underway.
What is supporting Germany’s adoption?
13.9% CAGR, with Germany’s reusable-offer obligation and foodservice packaging requirements shaping takeaway packaging choices.
Germany’s reusable-offer obligation requires applicable takeaway sellers to offer reusable alternatives alongside certain single-use food containers and beverage cups. Destatis reported that German hospitality turnover in 2025 increased 1.4% in nominal terms and declined 2.1% in real terms from 2024.
How does France perform?
13.4% CAGR, with selected single-use plastic restrictions and standards-based compostability requirements used as market context.
France restricts several categories of single-use plastic products. Service Public Entreprendre guidance, verified December 31, 2025, states that qualifying home-compostable single-use plastic bags must contain at least 60% bio-based content, be less than 15 microns thick, and meet NF T51-800 or provide equivalent guarantees. This bag-specific requirement provides evidence of standards-based compostability controls and should not be interpreted as a certification rule for cups, containers or accessories.