
As of August 31, 2026, the Thrift Savings Plan (TSP) held approximately $1.17 trillion in assets. Nearly 44% of all TSP assets were ultimately invested in the C Fund, an investment fund that tracks 500 of the largest U.S. companies. That is part of a longer trend in which TSP assets have become increasingly concentrated in stocks, particularly in the C Fund, while the G Fund makes up a smaller percentage of the overall TSP portfolio.
At the same time, Lifecycle Funds have become much more popular. That complicates comparisons of investments over time because an L Fund is a portfolio composed of the five core TSP funds.
Where TSP Money Is Invested Today
The Federal Retirement Thrift Investment Board (FRTIB) distinguishes between “participant allocation” and “individual TSP funds.” The distinction is important. A participant may have $100,000 invested entirely in an L Fund. From a participant’s perspective, the account is 100% invested in the L Fund. But the L Fund itself invests that money among the G, F, C, S, and I Funds.
So, when looking at how the TSP’s $1.17 trillion is actually invested, the figures for the individual funds provide a clearer picture.
Here is the allocation among funds as of August 31, 2026, according to the latest FRTIB report:
FundAssetsShare of TSP AssetsG Fund$323.8 billion27.7%F Fund$39.0 billion3.3%C Fund$511.9 billion43.8%S Fund$136.4 billion11.7%I Fund$157.5 billion13.5%Mutual Fund Window$1.0 billion0.1%Total$1.1695 trillion100%
The biggest number is easy to spot. More than $500 billion is now invested in the C Fund. Combined, the C and S Funds put about 55.5% of TSP assets into U.S. stocks. Roughly 69% of the plan’s retirement savings is now invested in stocks.
By comparison, the G and F Funds now account for about 31% of assets.
TSP Is Now More Stock-Oriented
This change did not happen because millions of TSP participants suddenly moved their retirement savings into stocks. Some TSP participants may have missed the change because it was gradual.
FRTIB’s historical records extend well beyond the past decade and provide monthly data on participant allocations. The Board’s archived meeting materials include monthly reports for every year from 2016 forward. Those historical reports show the broad direction of the change: the G Fund is now less dominant while the C Fund and Lifecycle Funds have assumed increasingly important roles.
The FRTIB’s description of the TSP investment structure helps explain the change. The five core funds span the risk-and-return spectrum, while L Funds combine those five investments into diversified portfolios and automatically adjust allocations as participants approach their target retirement dates.
C Fund Is Now the Giant of the TSP
The G Fund, once the defining TSP investment for many federal employees, is still a huge fund with $323.8 billion. But its 27.7% share is far below the C Fund’s 43.8%.
What are the consequences of this shift?
A TSP increasingly invested in stocks has greater exposure to market volatility. It also has greater exposure to equities’ long-term growth potential. That tradeoff between risk and potential return is ultimately one participants make through their investment decisions. TSP participants nearing retirement should pay particular attention to this shift.
The stock market can move quickly. A federal employee who is retired or near retirement may feel the impact of a major change in TSP value more than a younger employee. An employee in his early 30s will probably recover from a significant drop in stock prices. A retired employee who is much older may experience a change in available income and a quick change in lifestyle on a reduced income.
The 2% That Gradually Moves a Trillion-Dollar Retirement Plan
One of the more interesting statistics in FRTIB’s monthly investment reports is how few participants move money between funds. Typically, fewer than 2% of participants make interfund transfers during a month.
That sounds insignificant, and it is for a short time period. But most participants do nothing—they leave their allocations alone while continuing to contribute. Meanwhile, markets rise and fall, L Funds rebalance automatically, and a relatively small group of participants moves hundreds of millions—or sometimes billions—of dollars between funds. Over the course of one month, those changes may seem insignificant. Over ten years, the difference is substantial.
August 2026 provides a good illustration. Net interfund transfers during the month were:
FundAugust 2026 Net TransfersG Fund+$384 millionF Fund-$575 millionC Fund-$960 millionS Fund+$909 millionI Fund+$495 millionL Funds-$260 millionMutual Fund Window+$7 million
In August alone, almost $1 billion flowed out of the C Fund, while approximately $909 million flowed into the S Fund and $495 million into the I Fund. That is a lot of money, even in a $1.17 trillion retirement plan.
Market Declines Can Quickly Change the Picture
A change in the percentage of TSP assets invested in a fund does not necessarily mean participants transferred money into that fund. Suppose the C Fund begins a year with 40% of TSP assets. If stocks rise substantially while the G Fund earns a much smaller return, the C Fund can account for 42% or 43% of TSP assets, even if participants do not make any transfers.
Several factors determine the TSP’s overall allocation: investment returns, employee and agency contributions, withdrawals and distributions, interfund transfers, and automatic L Fund rebalancing.
Consider what happened during the 2022 market decline.
As of February 28, 2022, the TSP had approximately $769.5 billion in assets. Looking through the L Funds to their underlying investments, the allocation was:
FundFebruary 2022G Fund36.4%F Fund4.6%C Fund38.4%S Fund12.1%I Fund8.5%
At that point, the G Fund and C Fund were relatively close—36.4% versus 38.4%. Compare that with August 2026:
FundFeb. 2022August 2026ChangeG36.4%27.7%-8.7 pointsF4.6%3.3%-1.3C38.4%43.8%5.4S12.1%11.7%-0.4I8.5%13.5%5.0
Over four and a half years, the G Fund’s share fell by almost 9 percentage points, while the combined C and I Fund share increased by more than 10 percentage points. Market appreciation contributed substantially to the change, but from a retirement-investment standpoint, the result is the same: a substantially larger percentage of TSP assets is exposed to stock-market performance today.
Lifecycle Funds Quietly Changing TSP Investing
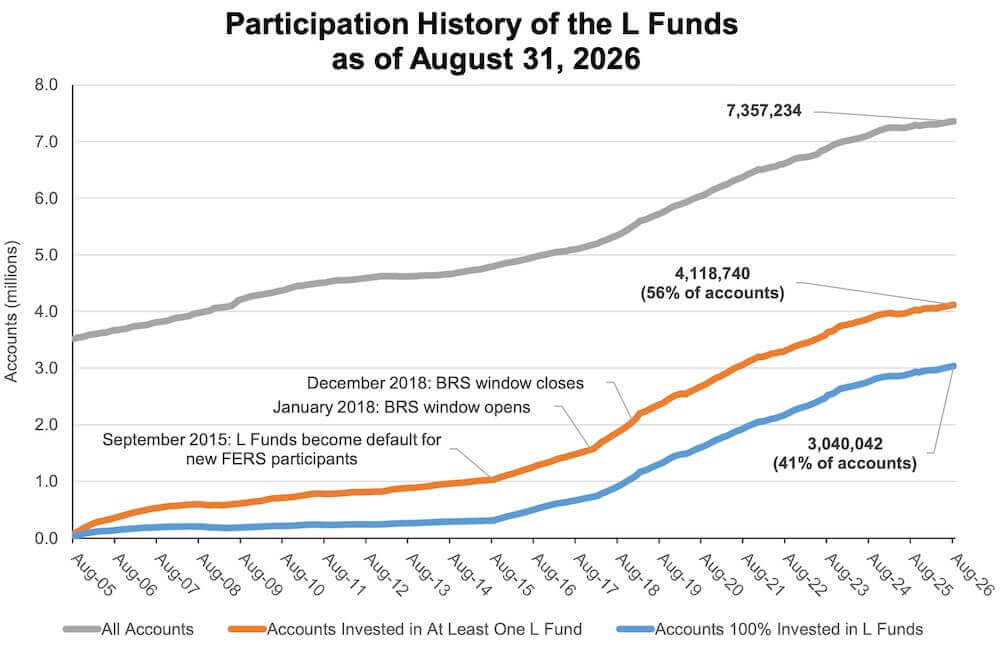
Another major development during the decade has been the increasing use of Lifecycle Funds. As of August 2026, participants directly held $316.6 billion in L Funds, 27.1% of all TSP assets. More than one dollar in every four in the TSP is now held through Lifecycle Funds.
 Source: FRTIB
L Funds automatically allocate money among the five core funds and adjust that allocation over time. The FRTIB has described them as providing diversification, rebalancing, and changing target weights as a participant’s investment horizon shortens.
This has an important behavioral consequence. A participant in an L Fund does not have to make an interfund transfer to alter the account’s asset allocation. The Lifecycle Fund does that automatically. Consequently, the monthly statistic showing fewer than 2% of participants transferring money understates how much investment allocation is actually changing inside the TSP.
The F Fund Has Become a Small Part of the TSP
One of the quieter trends is the relatively small role of the F Fund. Only 3.3% of TSP assets—about $39 billion—were ultimately invested in the F Fund at the end of August.
The F Fund provides exposure to the U.S. investment-grade bond market. In theory, it sits between the principal protection of the G Fund and the volatility of stock funds. In practice, TSP investors collectively hold far more in the G Fund and in equities.
For every dollar invested in the F Fund, more than $13 is now invested in the C Fund.
The I Fund Is Becoming More Important
The TSP’s I Fund shows another interesting change.
As of February 2022, only 8.5% of TSP assets were ultimately invested in the I Fund. By August 2026, that figure had risen to 13.5%. The I Fund now contains approximately $157.5 billion, including investments held indirectly through L Funds. Some of that growth reflects investment performance, some reflects Lifecycle Fund allocations, and some reflects participant decisions.
International stocks now represent roughly one dollar out of every seven invested in the TSP.
TSP Moves From Retirement Savings Plan to $1.17 Trillion Investment Giant
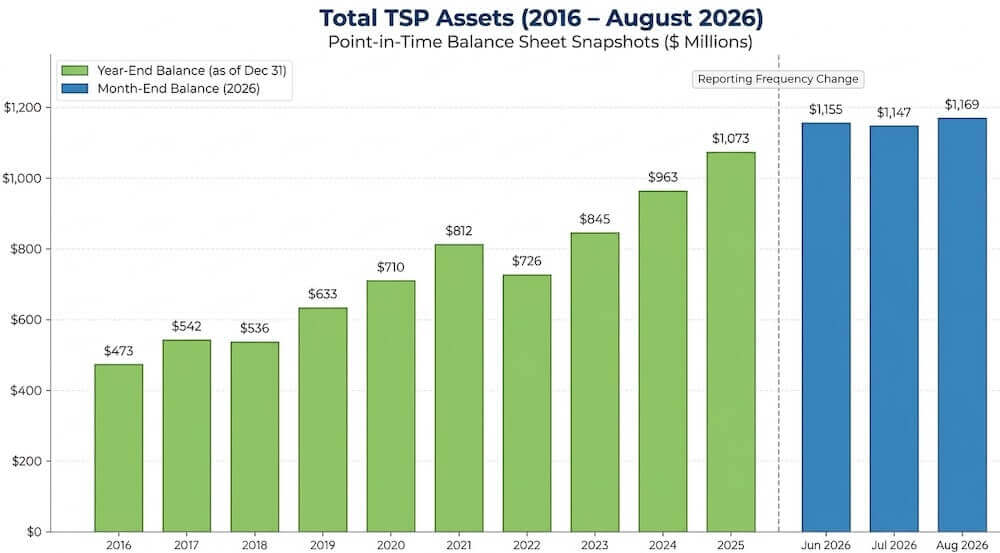
The change is not just about how participants divide their money. The pool of money has become enormous.
By February 2022, TSP assets totaled approximately $769.5 billion. By August 2026, assets had reached $1.1695 trillion. That is an increase of about $400 billion in only four and a half years.
The FRTIB describes the TSP as the world’s largest defined contribution plan. Its historical financial statements also provide annual records going back through 2016 and earlier, making it possible to track the plan’s growth over the decade.
 Source: FRTIB | Note: Total TSP assets represent point in time balance sheet snapshots at period end, not cumulative annual/monthly flows
What This Means for Individual TSP Investors
A 30-year-old federal employee with decades until retirement is in a very different financial situation from a 68-year-old retiree taking regular withdrawals. The aggregate figures do not indicate what any individual’s allocation should be.
But the TSP of 2026 is increasingly an equity-oriented retirement plan. Almost seven out of every ten dollars are ultimately invested in the C, S, or I Funds. More than four out of every ten dollars are invested in the C Fund alone. And more than one-quarter of participants’ assets are now held in Lifecycle Funds, meaning an increasing share of TSP asset allocation is being managed automatically rather than through participants personally moving money among the five core funds.
For federal employees reviewing the monthly TSP returns, the longer-term change is as important as which fund performed best over the last month.