How GDP Per Capita Compares Across the U.S. and Canada
Key Takeaways
U.S. states occupy most of the top positions in the combined ranking, while Canadian provinces generally appear further down the list.
Nunavut is the highest-ranking Canadian jurisdiction at $99,740 per person, placing eighth overall.
Alberta leads Canada’s provinces at $69,797 per person, placing 43rd in the combined ranking.
How does economic output per person compare across U.S. states and Canadian provinces and territories?
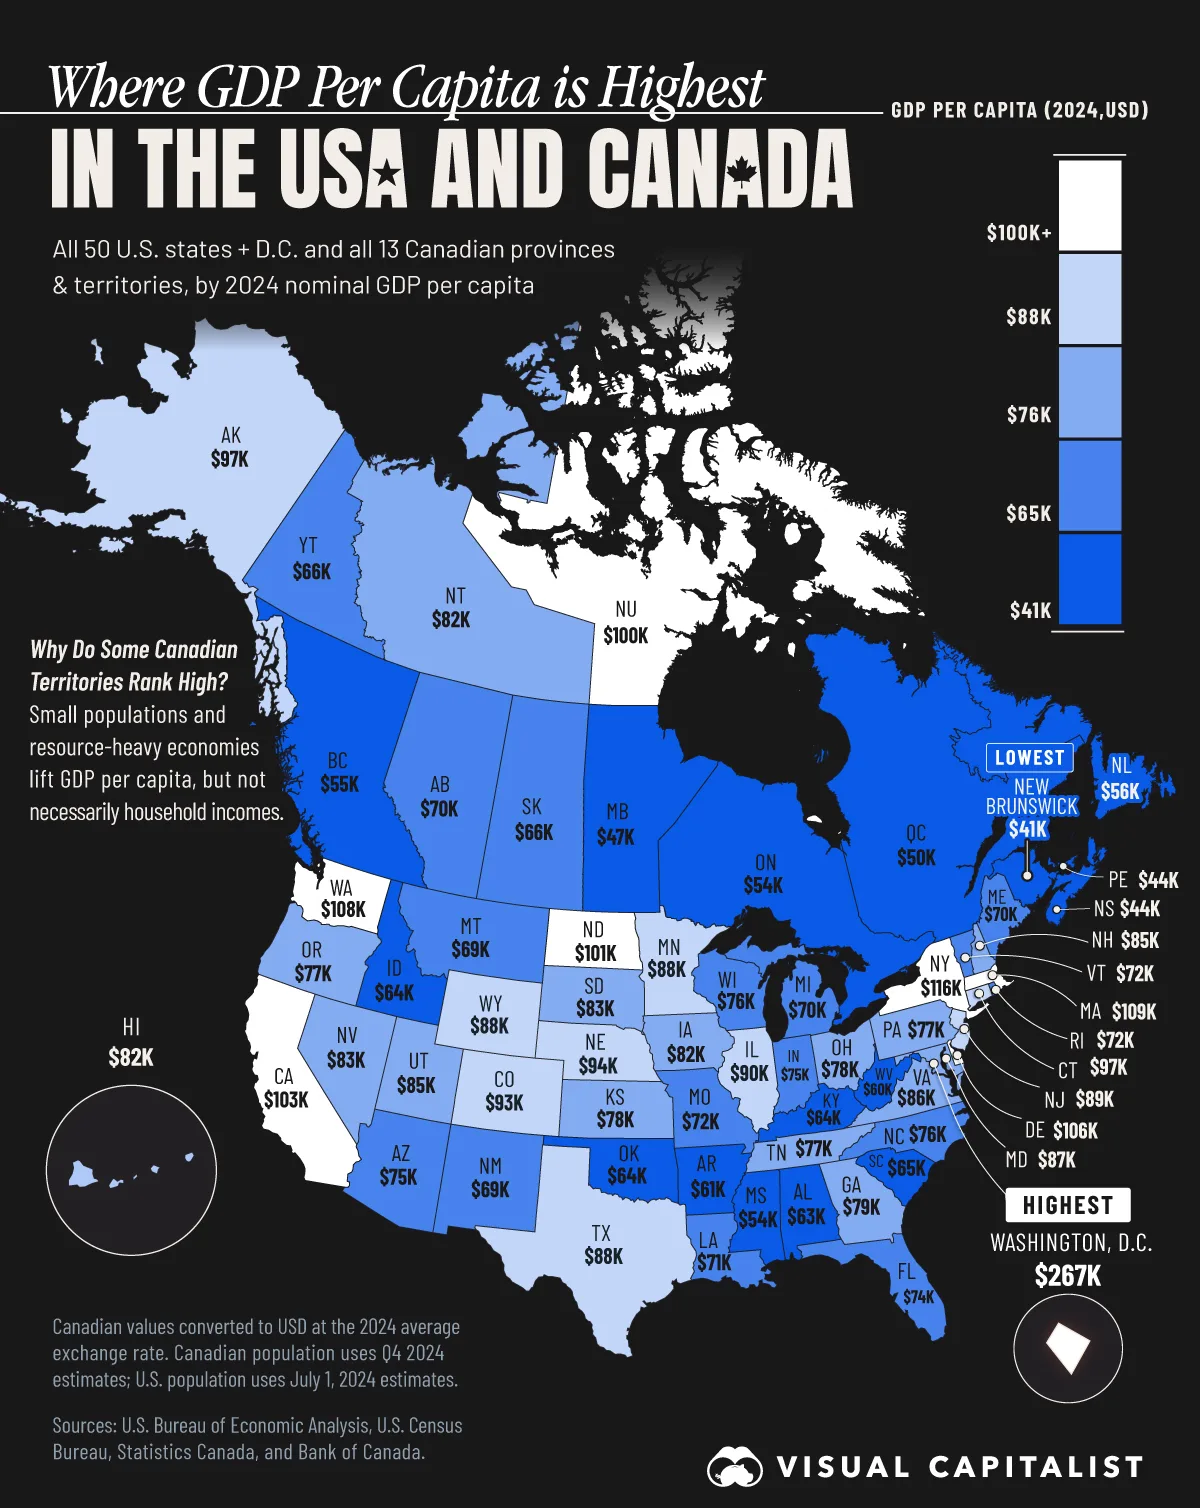
This map ranks jurisdictions across both countries by GDP per capita in 2024, highlighting a wide gap between many U.S. states and Canadian provinces, along with some notable Canadian exceptions.
The figures use data from the U.S. Bureau of Economic Analysis, U.S. Census Bureau, and Statistics Canada. Canadian figures are converted to U.S. dollars using the 2024 average exchange rate from the Bank of Canada.
Population figures use Q4 2024 estimates for Canada and July 1, 2024 estimates for the U.S. GDP per capita measures economic output per person and does not represent average income.
How the U.S. and Canada Compare
U.S. jurisdictions dominate the upper end of the ranking. New York, Massachusetts, Washington, Delaware, California, and North Dakota all record GDP per capita above $100,000.
RankState / Province / Territory2024 GDP per Capita (USD)
1🇺🇸 District of Columbia$266,592
2🇺🇸 New York$116,099
3🇺🇸 Massachusetts$109,059
4🇺🇸 Washington$107,974
5🇺🇸 Delaware$105,675
6🇺🇸 California$102,836
7🇺🇸 North Dakota$100,907
8🇨🇦 Nunavut$99,740
9🇺🇸 Alaska$97,167
10🇺🇸 Connecticut$97,112
11🇺🇸 Nebraska$94,358
12🇺🇸 Colorado$93,117
13🇺🇸 Illinois$90,380
14🇺🇸 New Jersey$88,993
15🇺🇸 Texas$88,438
16🇺🇸 Wyoming$87,773
17🇺🇸 Minnesota$87,572
18🇺🇸 Maryland$87,430
19🇺🇸 Virginia$86,368
20🇺🇸 Utah$85,490
21🇺🇸 New Hampshire$84,725
22🇺🇸 South Dakota$82,834
23🇺🇸 Nevada$82,682
24🇺🇸 Iowa$82,278
25🇨🇦 Northwest Territories$82,161
26🇺🇸 Hawaii$81,973
27🇺🇸 Georgia$78,677
28🇺🇸 Ohio$77,832
29🇺🇸 Kansas$77,741
30🇺🇸 Oregon$77,427
31🇺🇸 Tennessee$77,393
32🇺🇸 Pennsylvania$77,256
33🇺🇸 North Carolina$76,385
34🇺🇸 Wisconsin$76,093
35🇺🇸 Arizona$75,444
36🇺🇸 Indiana$74,915
37🇺🇸 Florida$74,217
38🇺🇸 Rhode Island$72,388
39🇺🇸 Missouri$71,868
40🇺🇸 Vermont$71,577
41🇺🇸 Louisiana$71,329
42🇺🇸 Maine$70,414
43🇨🇦 Alberta$69,797
44🇺🇸 Michigan$69,551
45🇺🇸 New Mexico$69,159
46🇺🇸 Montana$68,956
47🇨🇦 Yukon$66,228
48🇨🇦 Saskatchewan$65,535
49🇺🇸 South Carolina$65,037
50🇺🇸 Idaho$64,481
51🇺🇸 Kentucky$64,436
52🇺🇸 Oklahoma$64,351
53🇺🇸 Alabama$63,014
54🇺🇸 Arkansas$60,832
55🇺🇸 West Virginia$60,244
56🇨🇦 Newfoundland and Labrador$56,202
57🇨🇦 British Columbia$54,986
58🇨🇦 Ontario$53,849
59🇺🇸 Mississippi$53,621
60🇨🇦 Quebec$49,817
61🇨🇦 Manitoba$46,769
62🇨🇦 Prince Edward Island$43,949
63🇨🇦 Nova Scotia$43,830
64🇨🇦 New Brunswick$40,820
The District of Columbia is a notable outlier at $266,592 per person, more than twice the level of second-place New York at $116,099.
D.C.’s unusually high figure reflects its small resident population alongside a dense concentration of government, professional services, consulting, and other high-value economic activity.
Massachusetts and Washington state follow at roughly $109,000 and $108,000 per person, respectively, while Delaware, California, and North Dakota also exceed $100,000.
Why Canada’s Territories Rank So High
Nunavut is the highest-ranking Canadian jurisdiction at $99,740 per person, placing eighth overall, while the Northwest Territories ranks at $82,161.
These figures are exceptions within Canada and reflect how GDP per capita can behave in small, resource-heavy economies. Large mining, energy, and infrastructure projects can generate substantial output across relatively small populations, lifting the per-person figure.
That does not mean residents of the territories are necessarily wealthier than Canadians elsewhere.
Canadian Provinces Trail Most U.S. States
Alberta is Canada’s highest-ranking province, with GDP per capita of $69,797, placing 43rd in the combined ranking. Its relatively strong position reflects the province’s large energy sector and other resource-intensive industries. Saskatchewan follows at $65,535, while Newfoundland and Labrador reaches $56,202.
Canada’s three most populous provinces rank further down the list. British Columbia records GDP per capita of $54,986, Ontario stands at $53,849, and Quebec comes in at $49,817. Mississippi, at $53,621, is the only U.S. state positioned among this group of major Canadian provinces.
Several Atlantic Canadian provinces sit at the bottom of the combined ranking. Prince Edward Island and Nova Scotia each generate roughly $44,000 per person, while New Brunswick ranks last at $40,820.
Overall, the gap with the U.S. has widened over time. Canada’s GDP per capita tracked more closely with the U.S. through the early 2010s, but slower productivity growth since then has increased the difference between the two countries.
Learn More on the Voronoi App 
If you enjoyed today’s post, check out Charted: The United States Dominates Canada’s Trade on Voronoi.