
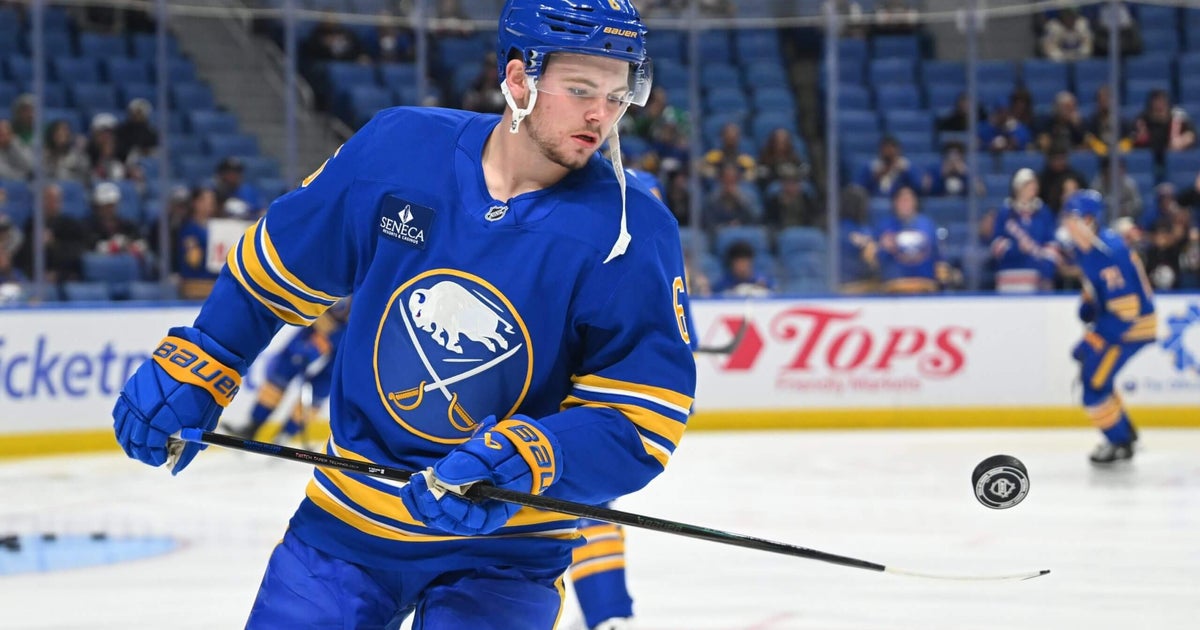
After a triumphant return to the postseason last spring, the Buffalo Sabres entered the 2026-27 season with one glaring weakness up front capable of stifling that momentum: The lack of a true difference-making star. After 18 games, it feels like that’s starting to change quickly. Zach Benson has arrived.
When it comes to Benson, it’s always been imperative to look beyond the box score. Benson has pushed his scoring pace up to 74 points this season, which is great, but it’s the totality of his game that’s really eye-popping.
It’s his two-way impact at five-on-five that’s the most transcendent, where the Sabres do an incredible amount of damage with him on the ice compared to off. That’s been taken to another level this year with some gaudy totals, where Benson currently has a 59 percent xG while outscoring opponents 18-6. When he’s off the ice, that drops to a 46 percent xG with the team being outscored 27-17. That’s massive.
The driving force of that is Benson’s ability to transition the puck up ice with control and create incredible opportunities off the rush with his playmaking and vision. Those were solid strengths of his last season; this season they’ve become genuinely elite.
That starts with Benson’s ability to enter the zone with control, which he’s doing 18.7 times per 60 this season. That’s not only up 12.5 from last year, but it lands just outside the league’s top 10. More impressive is how many scoring chances those entries have created: 6.1 per 60, up from 3.4 last season and sixth in the league.
And he seems to be only getting better as the season progresses. Over the last 10 games, only Nikolaj Ehlers has created more chances off entries than Benson’s 8.0. The Sabres have one of the league’s most dangerous offences off the rush; Benson is a big part of that.
A majority of those scoring chances off entries are created off Benson’s playmaking ability and that’s the big number: 6.0 rush passes per 60, the league’s best mark. Last year that category was led by Leo Carlsson, Leon Draisaitl, Martin Necas, Nathan MacKinnon and Connor McDavid. That’s special company that Benson is joining.
Benson’s transition game is the big thing currently driving his strong start, but there are other elements worth highlighting. He’s recovering more loose pucks and offensive rebounds, he’s driving the slot more with passes and carries, and he’s getting more involved in the offensive scheme with touches and puck-on-stick time. The most intriguing aspect, though, might be how clean he’s been in the defensive zone. Benson has only 0.8 turnovers per 60 in the defensive zone this season for a turnover rate of 3.8 percent — that’s the best mark in the league among forwards.
Mistake-free hockey in his own zone combined with an elite pass-rush threat in transition? That’s a lethal combo.
For Benson, it’s led to a plus-5.1 Net Rating this year — or a plus-25 pace that ranks 21st in the league. That’s star-level. His projected value isn’t quite there yet, but it’s getting close to the plus-10 range, currently sitting at plus-9.3. That’s up from plus-6.5 to start the season and could grow further if Benson can keep doing the elite things that have driven his current level of results. He’s certainly getting the opportunity to do so lately, earning over 22 minutes in three of his last four games.
When we previewed the Sabres going into the season, it was clear that the lack of star power up front was an issue, but that there were a few internal options that could make the jump. Benson was at the top of the list, and so far, he’s delivered.
Has NHL loyalty changed? (with Patrice Bergeron)
Sean Gentille and Sean McIndoe
16 stats1. Buffalo replacing Bowen Byram with Olen Zellweger working well so far
When the Sabres traded Bowen Byram in the offseason, they were losing a big-time puck-mover from the back end. Byram’s 12.5 controlled exits per 60 last season ranked sixth in the league; when Chicago GM Kyle Davidson called Byram a play-driver, that ability to exit the zone cleanly probably had a lot to do with it.
The Sabres didn’t have to look too far down that same list, though, to find Byram’s much cheaper replacement: Olen Zellweger ranked eighth with 12.2 controlled exits per 60. While Byram hasn’t played much this season, both defenders have been able to carry that skill over to their new teams and once again rank in the top 10 this season.
For Buffalo specifically, it’s been a seamless fit. Zellweger has a 59 percent xG rate with Owen Power this season, a decent bump over Power with Byram last season (51 percent).
2. Boston’s defensive zone denials led by Charlie McAvoy
The Bruins are off to a strong start, and their ability to defend their blue line has been a big help; Boston leads the league with a 55 percent denial rate. Charlie McAvoy’s presence has been huge there as he’s personally at a 66 percent denial rate, the second-best mark in the league. He was at 52 percent last season.
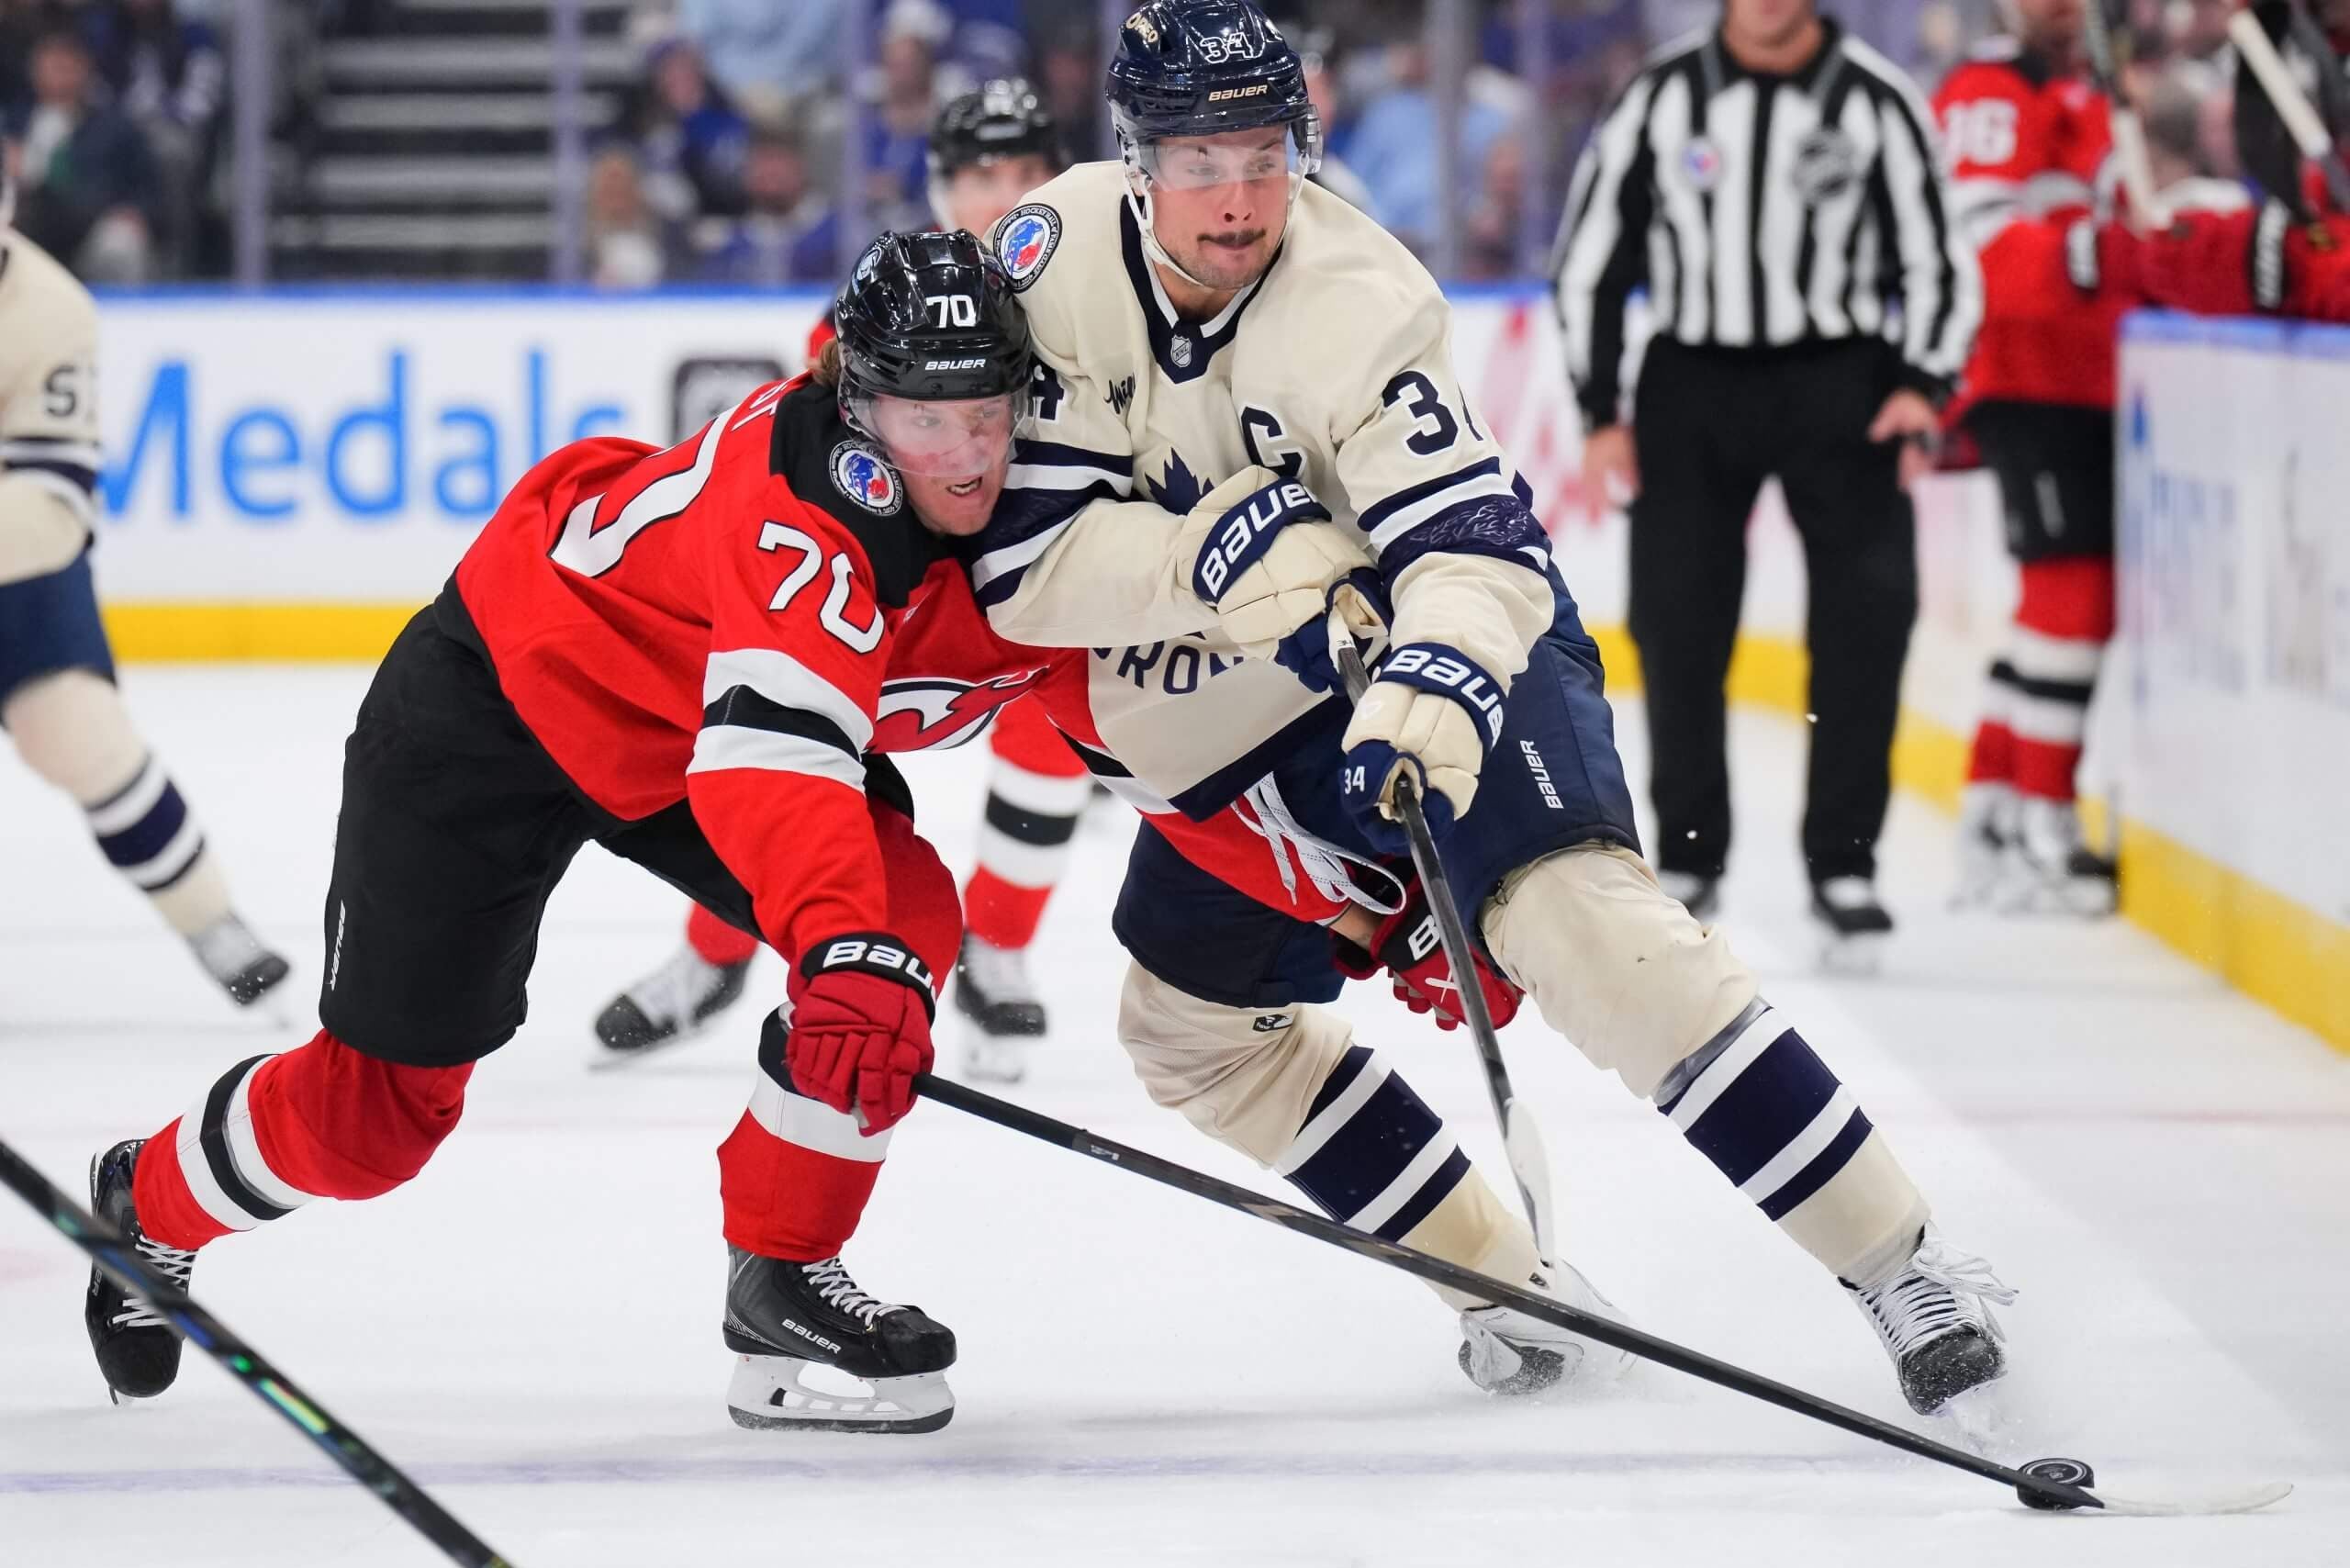
Auston Matthews looks like himself again this season. (Chris Tanouye / Getty Images)
3. Auston Matthews: Offensive-zone puck hound
Auston Matthews looks like himself again this season, and one of the most noticeable changes has been his pursuit of loose pucks in the offensive zone to keep plays alive. This season, Matthews has recovered 31.3 loose pucks per 60 in the offensive zone, the fifth-best mark in the league among forwards. That’s up from 22.8 last season, which ranked 99th — a major departure from his previous five seasons where Matthews ranked in the top-15 each time.
4. Former Leafs struggling to recover pucks
On the opposite end of the spectrum, I was a bit surprised to see Zach Hyman’s name near the bottom of the list considering his reputation and prior strength in that domain. Only Patrick Kane and Owen Michaels have recovered fewer pucks per 60 in the offensive zone than Hyman’s 12.3. That’s down from 19.5 last year.
Another former Leaf who finds himself near the bottom: Matthew Knies. Two seasons ago, when he broke through, Knies recovered 22.1 loose pucks per 60 in the offensive zone. That dropped to 16.7 last season and to just 13.4 this season. One clue as to why: Knies’ skating has sunk. His 20 mph speed bursts per 60 have dropped from 4.7 last season to just 2.7 this season.
5. Connor McDavid cutting mistakes away from the offensive zone
All of the focus on Connor McDavid this season has been on his gaudy point totals. Rightfully so. But when Mike Babcock was brought in as coach this summer, one of the reasons was more accountability toward the leadership group and what they needed to do better without the puck. So far, McDavid has done his part.
Over the last five seasons, McDavid’s success rate — the percentage of positive touches compared to failed touches — in the defensive and neutral zone hovered around 75 percent. That’s above average (69 percent in DZ, 73 percent in NZ), but not quite elite. This season has been a different story. McDavid has upped his success rate to 82 percent in the defensive zone and neutral zone. Both marks are close to the league lead and he’s the only forward above 80 percent in both zones.
Naturally, that’s also had an effect on his turnover rate. McDavid has gone from his usual 11 percent turnover rate in the defensive zone to 6.9 percent this season (average is 13 percent). In the neutral zone, he usually hovers around 7.5 percent; this year he’s at 5.7 percent (average is eight percent).
Probably related: McDavid’s xGA/60 has dropped to a career-low 1.95 this season. It was 2.92 last year.
6. Darnell Nurse’s season from hell
On that subject, Darnell Nurse’s defensive zone turnover rate has consistently hovered between 11 and 12 percent over the last seven seasons. This year he’s at 17.1 percent, the seventh-worst mark in the league among defensemen. That probably explains a lot of what’s gone wrong for him this season; he looks extremely over-extended in his role.
7. Filip Hronek losing defensive zone battles
After a strong 2025-26 campaign, Filip Hronek has looked extremely rough to start the year. Blame the outsized burden of playing tough minutes with no help on the league’s worst team, but it’s still noteworthy that his xG rate has dropped from 48 percent last season to 35 percent. The big issue is his xGA/60 going from 2.68 to 3.29; that’s the worst mark on the Canucks and in the league’s bottom 10.
One thing I’ve noticed with Hronek is how many battles he’s losing in his own zone. The average rate of successful contested puck recoveries in the defensive zone sits at 30 percent. Hronek was at 25 percent last season, a range he’s consistently found himself in as a Canuck. This season, though, his recovery rate has dropped to 16 percent. That’s one of the lowest marks in the league.
8. Canucks sink to new lows
Speaking of new lows for the Canucks, their current projected Net Rating has dropped to minus-99, by far the worst mark in the league and already 30 goals worse than what we expected at the start of the season.
It’s very rare for a team’s goal differential to be projected at minus-100, but that’s actually kind to the Canucks at the moment. They’re on a minus-143 pace.
9. Is Leo Carlsson a power-play merchant?
Look, I love seeing Leo Carlsson near the top of the scoring race; scoring at a 121-point pace after signing an $18 million contract is an awesome start to the season. But it is pretty funny that only seven of those points have come at five-on-five, giving him a 1.74 points-per-60 rate. That’s tied with Michael Misa for 151st in the league among forwards.
With the other 19 points coming on the man advantage, it’s clear that Carlsson has been a major part of Anaheim’s surge to the top of the power-play charts. It’s the reason the Ducks are winning games right now, and those goals count the same.
But there will come a time when the power-play well dries up; the Ducks are going to need Carlsson to start delivering more at five-on-five when it does.
10. Slot drivers from the back end
Slot driving plays (SDP) are the ability for a player to get to the slot via a pass or carry and they are often a who’s who of offensively gifted superstars. Here’s last year’s top five among defensemen.
1. Zach Werenski — 7.5 per 60
2. Cale Makar — 7.2
3. Lane Hutson — 6.8
4. Erik Karlsson — 6.7
5. Quinn Hughes — 6.5
Good list.
This year’s list, though, carries a lot more intrigue because of some fun surprises at the top. Makar and Hughes still make the top five and have increased their SDPs per 60 to nearly nine, but rank third and fifth with Matthew Schaefer between them. The guys ahead of them? Cole Hutson and Zayne Parekh with 9.2 SDPs per 60.
Obviously there’s a difference between driving the slot as a No. 1 defenseman compared to two sheltered young guns, but that’s still a big deal for the two budding offensive stars. They’re showing off just how dynamic they can be.
One interesting wrinkle on top of that: With 4.1 slot carries per 60, Makar was the only defenseman above 3.5 last season. This year, Cole Hutson is at 6.3 while Parekh is at 5.5.
11. Slot drivers up front
Same exercise as above; this time for the forwards. Here’s last year’s top five.
1. Connor McDavid — 21.1 per 60
2. Jack Hughes — 16.8
3. Nathan MacKinnon — 15.7
4. Macklin Celebrini — 14.9
5. Jordan Kyrou — 12.9
Kyrou is an obvious shock, but that helps explain his xG glow-up last season (and for what it’s worth, he’s dropped to 8.8 this season).
The other four make sense and three of them return this season to the top five with David Pastrnak replacing Celebrini for now. In fifth? Jackson Blake, who finished 12th last season. After dominating the playoffs and starting the season scoring at a point-per-game rate, it might be safe to call him the real deal. Blake’s projected Net Rating has already jumped from plus-5.8 to plus-9.8, one of the biggest shifts in the league.
12. Devils Grade-A defense
Year-to-year, there’s been a pretty sizeable variation between New Jersey’s ability to suppress expected goals and this year is no different. The Devils rank first by Hockey Stats at 2.1 xGA/60, but 11th by Sportlogiq at 2.44. That will have an effect on the way the goalies are viewed and that includes Connor Hellebuyck, whose GSAx, according to Sportlogiq, is 2.5, 1.8 goals better than the public’s estimation.
One reason that things are more difficult in New Jersey is a higher concentration of Grade A chances allowed. The Devils rank second in Grade B and C chances allowed, but are merely average when it comes to stifling the best chances.
13. Massive schedule differences for the best and worst teams
The average projected Net Rating of Carolina’s opponents so far this season: minus-19, the second-easiest schedule in the league.
The average projected Net Rating of Chicago’s opponents so far this season: plus-20, the hardest schedule in the league.
Feels kind of cruel to the Blackhawks to put them through that.
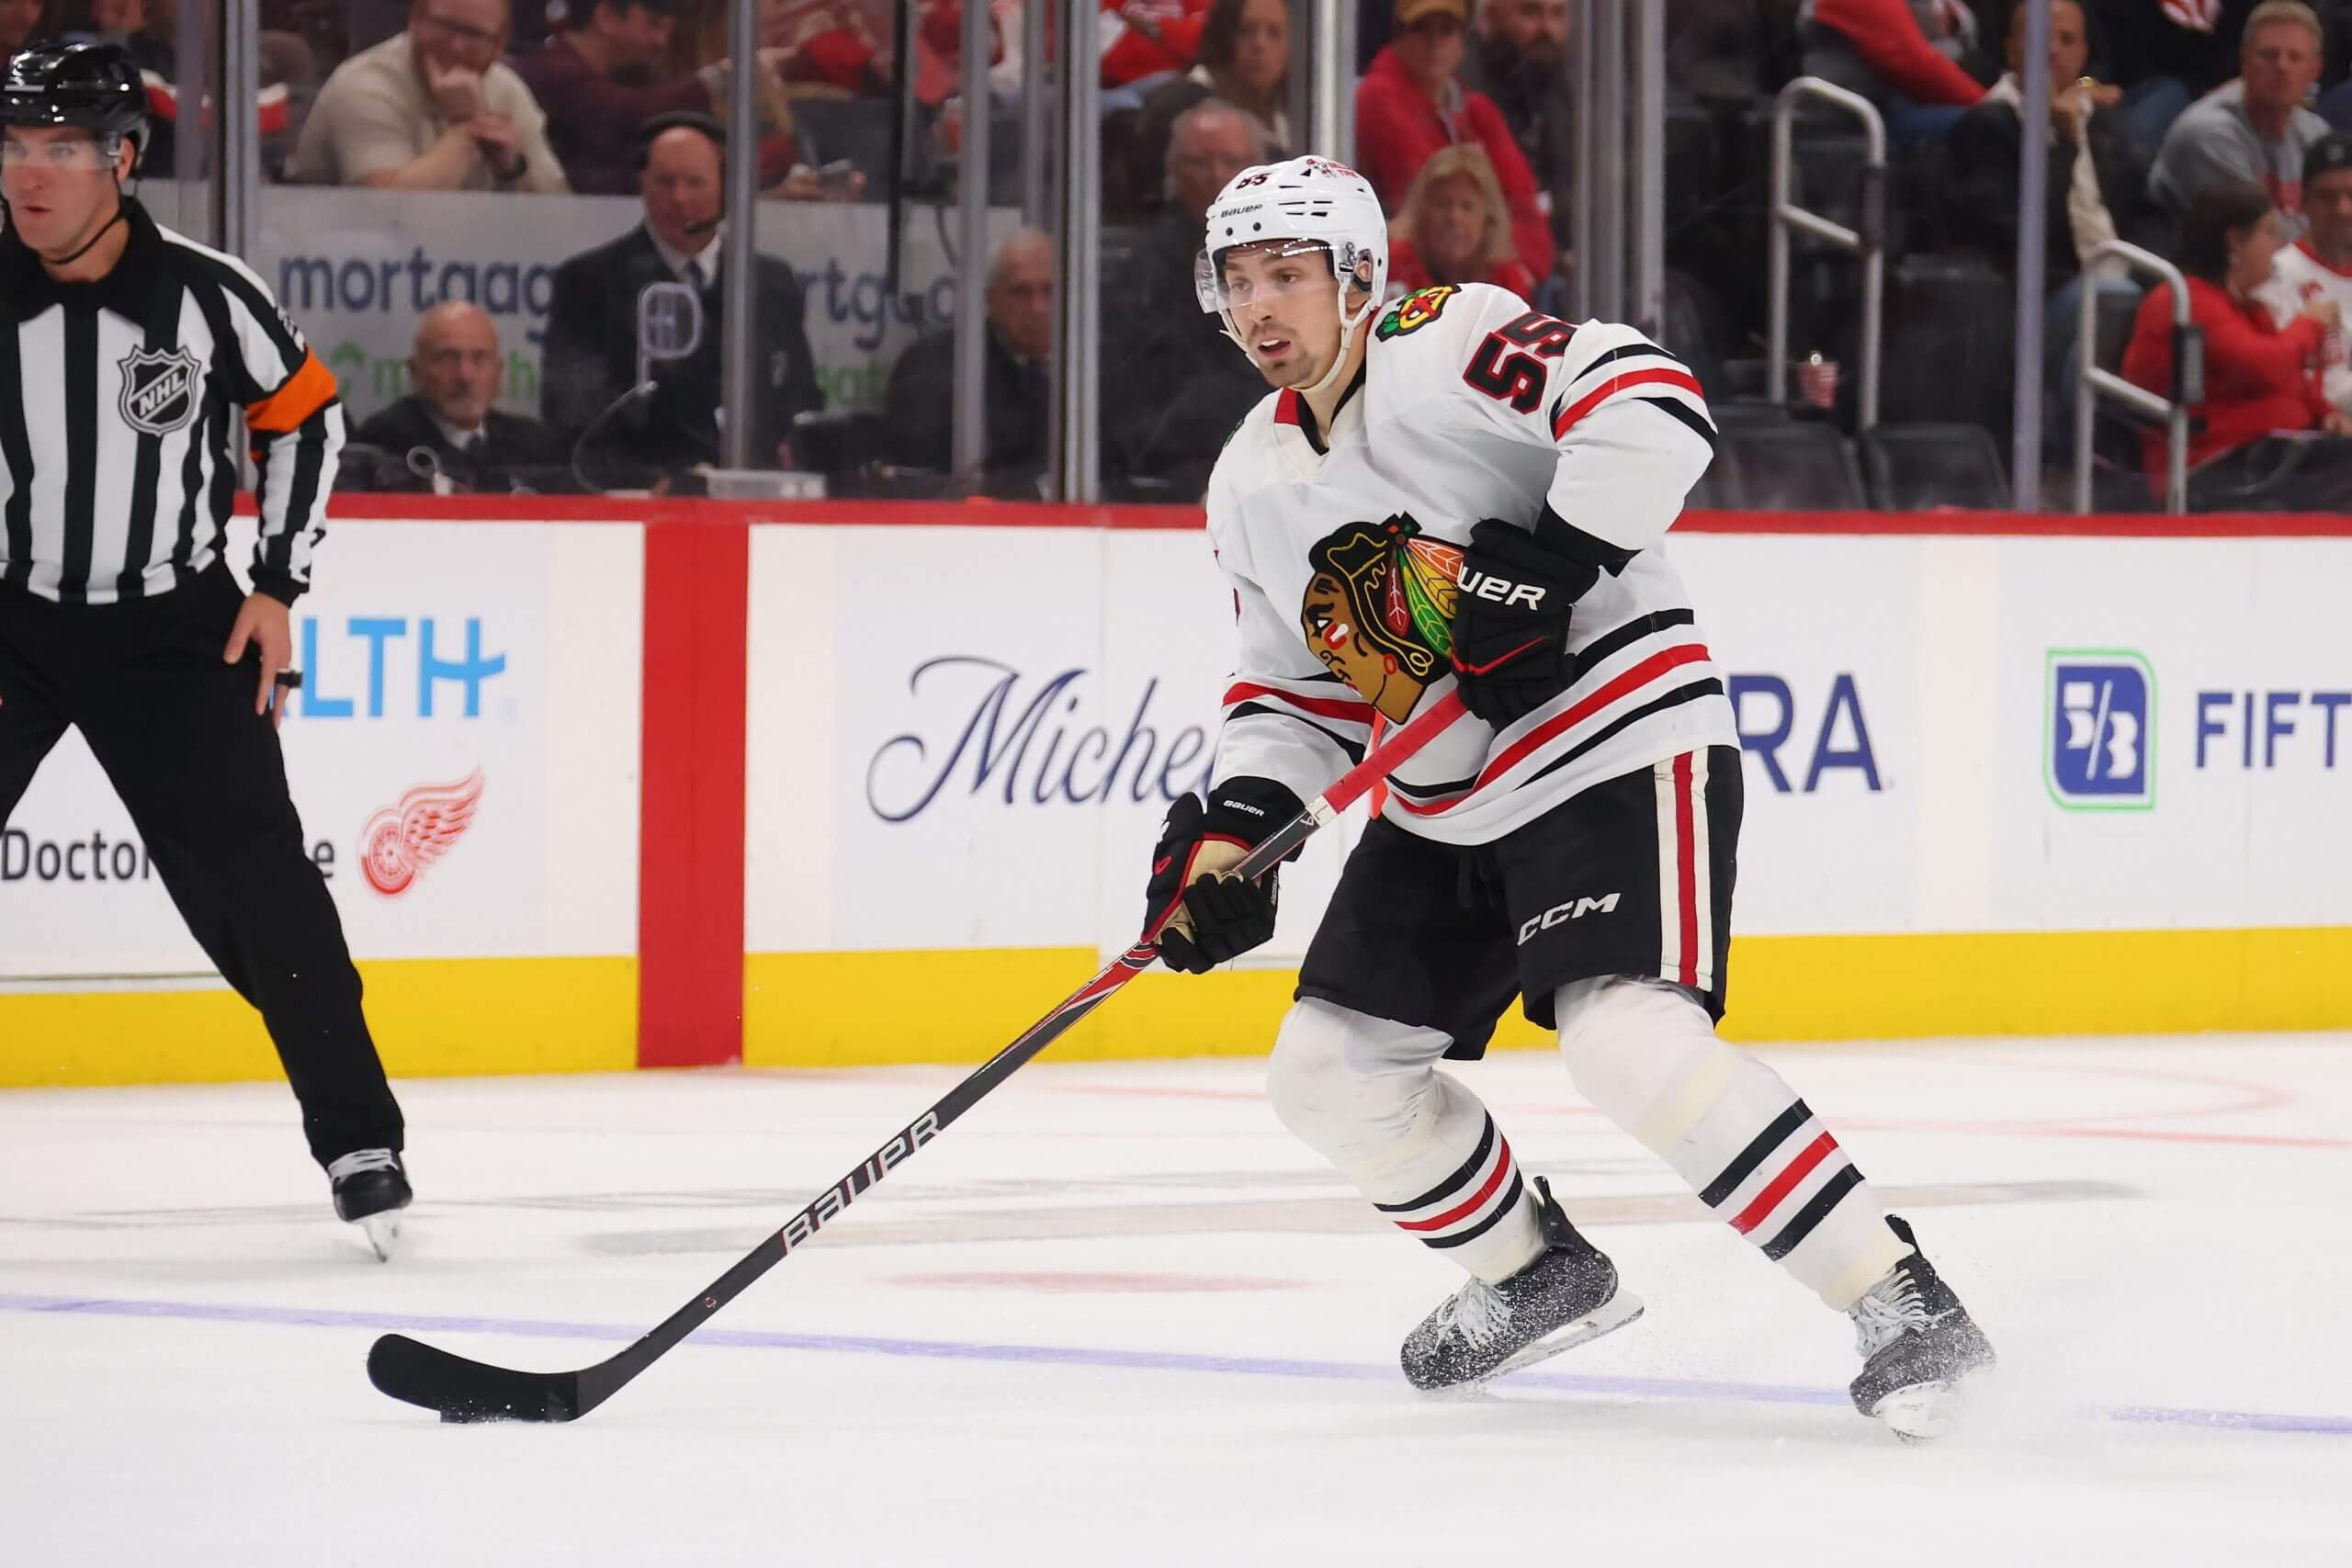
Artyom Levshunov has failed to take a positive step in his game this season. (Gregory Shamus / Getty Images)
14. Artyom Levshunov struggling to get pucks out
There aren’t many defensemen on the Blackhawks making a positive impact at the moment, but by far the most disappointing has to be 2024 No. 2 pick Artyom Levshunov. This was supposed to be a year where he took a step.
From the outside, it seems like one of the biggest issues with Levshunov’s game so far is his ability to get pucks out. His controlled exit rate is passable, but his dump-out attempts have been a disaster, with only 23 percent succeeding. That’s the second-worst mark in the league, where the average dump-out attempt from a defenseman succeeds 60 percent of the time.
15. Mikhail Sergachev makes it look easy on dump-ins
One of the most important skills for a defenseman is his ability to exit the zone after a dump-in. Mikhail Sergachev has been the league’s best at it this year, converting a recovery into an exit 84.1 percent of the time. That’s way up from last year’s 77 percent rate.
The Moment: Logan Cooley scores another hat trick
16. Logan Cooley is also turning into a star
To put a nice bookend to this week’s edition of 16 stats, let’s talk about another young forward who appears to be breaking out: Logan Cooley. A lot of the stuff off the rush that applied to Benson applies to him as well, though Cooley is more of a shooter than a passer there.
Scoring chances off entries over the last 10 games? Cooley ranks third, just behind Benson. Controlled entries per 60? He ranks first to Benson’s fifth. Individual scoring chances off the rush? He ranks fifth, mirroring Benson’s rush-pass dominance.
Overall, Cooley’s Net Rating sits at plus-4.8 on the season, just 0.3 back of Benson. That’s thanks to Cooley’s own 59 percent xG and leveled-up scoring rate.
— Data via Sportlogiq, Hockey Stats, Evolving Hockey and Hockey Stat Cards