

Markets are flashing textbook warning signs. Divergences are stacking up, valuations are stretched, and the crocodile’s jaws are wide open. History says they won’t stay that way for long — and investors must choose a side.
Optimieren Sie Ihre Browsereinstellungen
Themarket.ch benötigt JavaScript für wichtige Funktionen. Ihr Browser oder Adblocker verhindert dies momentan.
Bitte passen Sie die Einstellungen an.
«Crocodiles are easy. They try to take you out and eat you. People are harder. Sometimes they try to be your friend first.»
Steve Irwin, Crocodile Hunter (1962–2006)
Divergences.
In investing, that’s not a word you want to hear.
Why? Healthy markets confirm their trends. We want a bull market backed by broad participation and classic indicators: breadth (how many stocks are rising), momentum, and seasonal patterns. When price races ahead while those indicators stall, we don’t get confirmation; we get a divergence – a disconnect between price and the underlying engine that usually powers it.
That’s where we are in mid-August: red flags popping up across several well-watched gauges.
What usually happens in such a setup is best captured by the crocodile analogy: the market opens its jaws wide, just like the prehistoric predator.
And then, with high probability – or to put it in investor terms, with an unattractive risk/reward –, the gap between the upper and lower jaw has to close. That can happen in two ways:
The «outperforming» side pulls back,Or the «underperforming» side rallies to catch up.
But here’s the twist: in nature, crocodiles can only close their jaws from the top down. And in markets, when the gap is wide and risk/reward looks poor, history suggests the easier path is usually down, too.
And that’s why, given today’s market setup, the odds say just one thing.
The crocodile – a.k.a. the market – is about to snap.
Divergences: A classic warning sign
A great historic example of a hefty divergence is playing out right now – straight from the classic Dow Theory, a 100+ year-old framework used by market veterans to spot major trend shifts before they make headlines.
At its core, the Dow Theory says: for a market rally to be sustainable, both the broader market (Dow Jones Industrial Average or S&P 500) and the Dow Jones Transportation Index must move in the same direction.
And why transportation? Because it reflects the movement of goods – a direct proxy for real economic activity. No goods being shipped = no business being done = red flags.
Now, look at the chart:
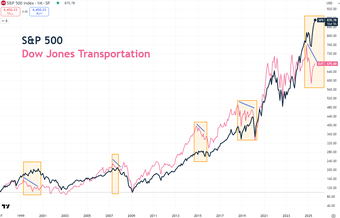 The dark line (S&P 500) has pushed to new highs.The pink line (Dow Jones Transportation) is not confirming; it has made lower highs inside the highlighted box even as the S&P 500 advances.The blue arrows and shaded boxes mark prior periods (e.g., late-1990s, 2007, 2015, 2018, 2021) when Transports rolled over first or failed to confirm. Those episodes resolved with either a sharp catch-down in the S&P or months of choppy, sideways trading that eventually broke lower.
This is textbook divergence. The Dow Theory is flashing bright red. When the leaders of the real economy falter while the market keeps climbing? That’s not momentum. That’s a disconnect.
But don’t panic just yet. A divergence doesn’t mean the market will collapse tomorrow. But historically, it has meant that reality eventually catches up.
And while classic divergences can resolve in two ways – one side pulling back or the other catching up – the chart above reminds us it can happen fast (and painfully) or drag on for months in a grinding sideways market, like 2015–2016.
Either way, the risk/reward skews negative. And divergences rarely come alone.
Another statistically strong one is market breadth: the percentage of stocks above their 200-day moving average compared to the S&P 500. This metric tells you how healthy a bull market really is by measuring participation.
Chart 2: Breadth (stocks above 200-day SMA) vs. the S&P 500 – participation is thinning

Let’s do a walk-through of the chart:
As the S&P 500 climbs (dark line), the breadth indicator (pink line) has been making lower highs (see the blue arrows) – meaning fewer stocks are participating in each new index high.The shaded boxes show this same pattern ahead of prior rough patches (2007–08, 2014–16, 2018, 2021–22, and now): the index grinds or dips, breadth weakens first, and eventually the gap closes – often via index weakness rather than a sudden burst of participation.
When only a handful of mega-caps pull the index higher and do the heavy lifting, the risk/reward degrades. Breadth says the rally’s getting narrower, which historically leaves the market vulnerable to a swift air-pocket or a slow, frustrating stall.
Or, in crocodile terms: it snaps.
So, what can investors do?
Go defensive or trim beta
When divergences start stacking up, you don’t have to dump your portfolio and run for the hills. But you also don’t want to pretend they’re not there.
The market is essentially sending the message that «the easy part of the rally is probably behind us» and the current rally is resting on increasingly narrow shoulders. Ten stocks – the «Magnificent 7» plus Broadcom, Oracle, and Palantir – have accounted for around 80% of the S&P 500’s returns since the so-called Liberation Day on April 2. As is so often the case, the difficulty lies in timing.
As we know from nature, crocodiles can stay still for a long time before snapping. But with markets at peak valuations and indices at all-time highs, a nimble, step-by-step shift makes sense.
There are two classic playbooks:
Go defensive: Rotate into sectors and companies with steady cash flows, pricing power, and less dependency on economic cycles. Think consumer staples, healthcare, utilities. These names tend to hold up better when growth expectations fade. Health care trades at its lowest valuation to the S&P 500 over the last 10 and 30 years and has the worst relative underperformance over decades (see chart 3 below). And utilities offer high single-digit to low double-digit returns, paired with low valuations (absolute level) and relatively low risk.Trim beta – in plain English: reduce exposure to the most volatile, high-beta names that move twice as fast as the market… in both directions. That could mean taking profits in high-flyers or scaling back positions in cyclical sectors like discretionary retail, small caps, or certain industrials/materials/financials and the cyclical part of technology (see chart 4 below). Here you will find our twelve sell rules.
Chart 3: S&P 500 sector P/E valuations relative to history
Source: Compustat, Factset, IBES, Goldman Sachs Investment Research
Chart 4: Growth versus defensive growth relative trend
Neither move means you’re turning into a doomsayer – you’re simply managing risk while the probability of turbulence is rising. During such phases, it is worth taking a critical look at your portfolio: Are there any unconscious cluster risks? Where is there a lack of balance? Often, adding complementary quality stocks is enough to reduce dependencies and improve the risk/reward profile.
Worry about the crocodile you don’t see
History shows that when divergences resolve negatively, the first hit often lands hardest on the riskiest corners of the market. By the time the «safe» names start wobbling, you’ve already bought yourself time — and optionality.
Appearances are currently deceptive: increasing concentration in the largest positions – which have consistently gained beta over recent years – has made the market riskier.
Chart 5: High market concentration always leads to mean reversion
For the savvy investor, this means not chasing short-term return maximization but staying true to their own strategy. Those who diversify consciously reduce cluster risks and create the basis for remaining invested even in difficult market phases. In the long term, this almost always leads to better results – not because you perfectly time every short-term movement, but because you are never forced to abandon your strategy in a panic.
In other words, to return to our crocodile analogy: concentrate on the crocodiles that you can see and therefore remain alert, because in the markets it is not the first crocodile that catches you.
After all, to quote another hero of my childhood, Jeremy Wade, alongside Steve Irwin: «It’s always the crocodile you don’t see that you have to worry about.»
Thierry Borgeat Thierry is co-founder of arvy, a Zurich-based investment manager specialized on quality stocks with a global focus. He has spent most of his career leading the management of various investment strategies focusing on equity and global macro strategies at private banks and investment boutiques. He was applying the long-term, quality-oriented approach that arvy uses today. Thierry holds a Bachelor degree in Finance and is a CFA charterholder.