

Best job markets in the US
The demand for different career paths and qualifications varies widely from place to place, often depending on local economic features, including geography, infrastructure, politics, culture and resources. Similarly, what makes one job market more appealing than others can depend on a job-hunter’s financial and familial circumstances. Not only does the presence of jobs and a high income count, but many households rely on health insurance, the possibility for income growth, a short enough commute to allow work-life balance, or even remote work in full.
With this in mind, SmartAsset ranked 348 U.S. cities based on six metrics from the latest Census Bureau data to help households determine which job markets might be most suitable for their financial goals.
The job market in Bend, OR ranks number one. Bend residents reflected a combination of relatively low unemployment (3.1%) and high income growth at 44.2% over three years. At the same time, work is accessible and flexible for many, with and an average commute time of 16 minutes, while 26.9% work remotely.Over three years, average worker earnings in Richmond, VA increased by 50%. Ranking third best job market overall, Richmond saw the median earnings for workers grow from $31,072 in 2019 to $46,443 in 2023, a climb of 49.4%.Olathe, KS boasts the lowest unemployment rate. Olathe, KS clocked an unemployment rate of just 1.27% for 2023, compared to a studywide median of 4.45%. The median earnings for workers ranked in the top quartile at $50,868, but income growth since then was particularly slow at 11% between 2020 and 2023.The job market in Santa Clara, CA offers the most health insurance coverage. 88.6% of workers in Santa Clara have private health insurance through their employer. This helps the city rank for sixth-best job market overall. On the opposite side of this metric, less than half of workers in three cities don’t have health insurance through their employer: Paterson, NJ; Santa Maria, CA; and Bridgeport, CT.Workers in Boulder, CO have a particularly good work-life balance. Despite ranking 309th for the job market overall due to relatively low income, low income growth, and high unemployment, Boulder ranks second when considering just median commute times (19.3 minutes) and remote work (25.4% of workers).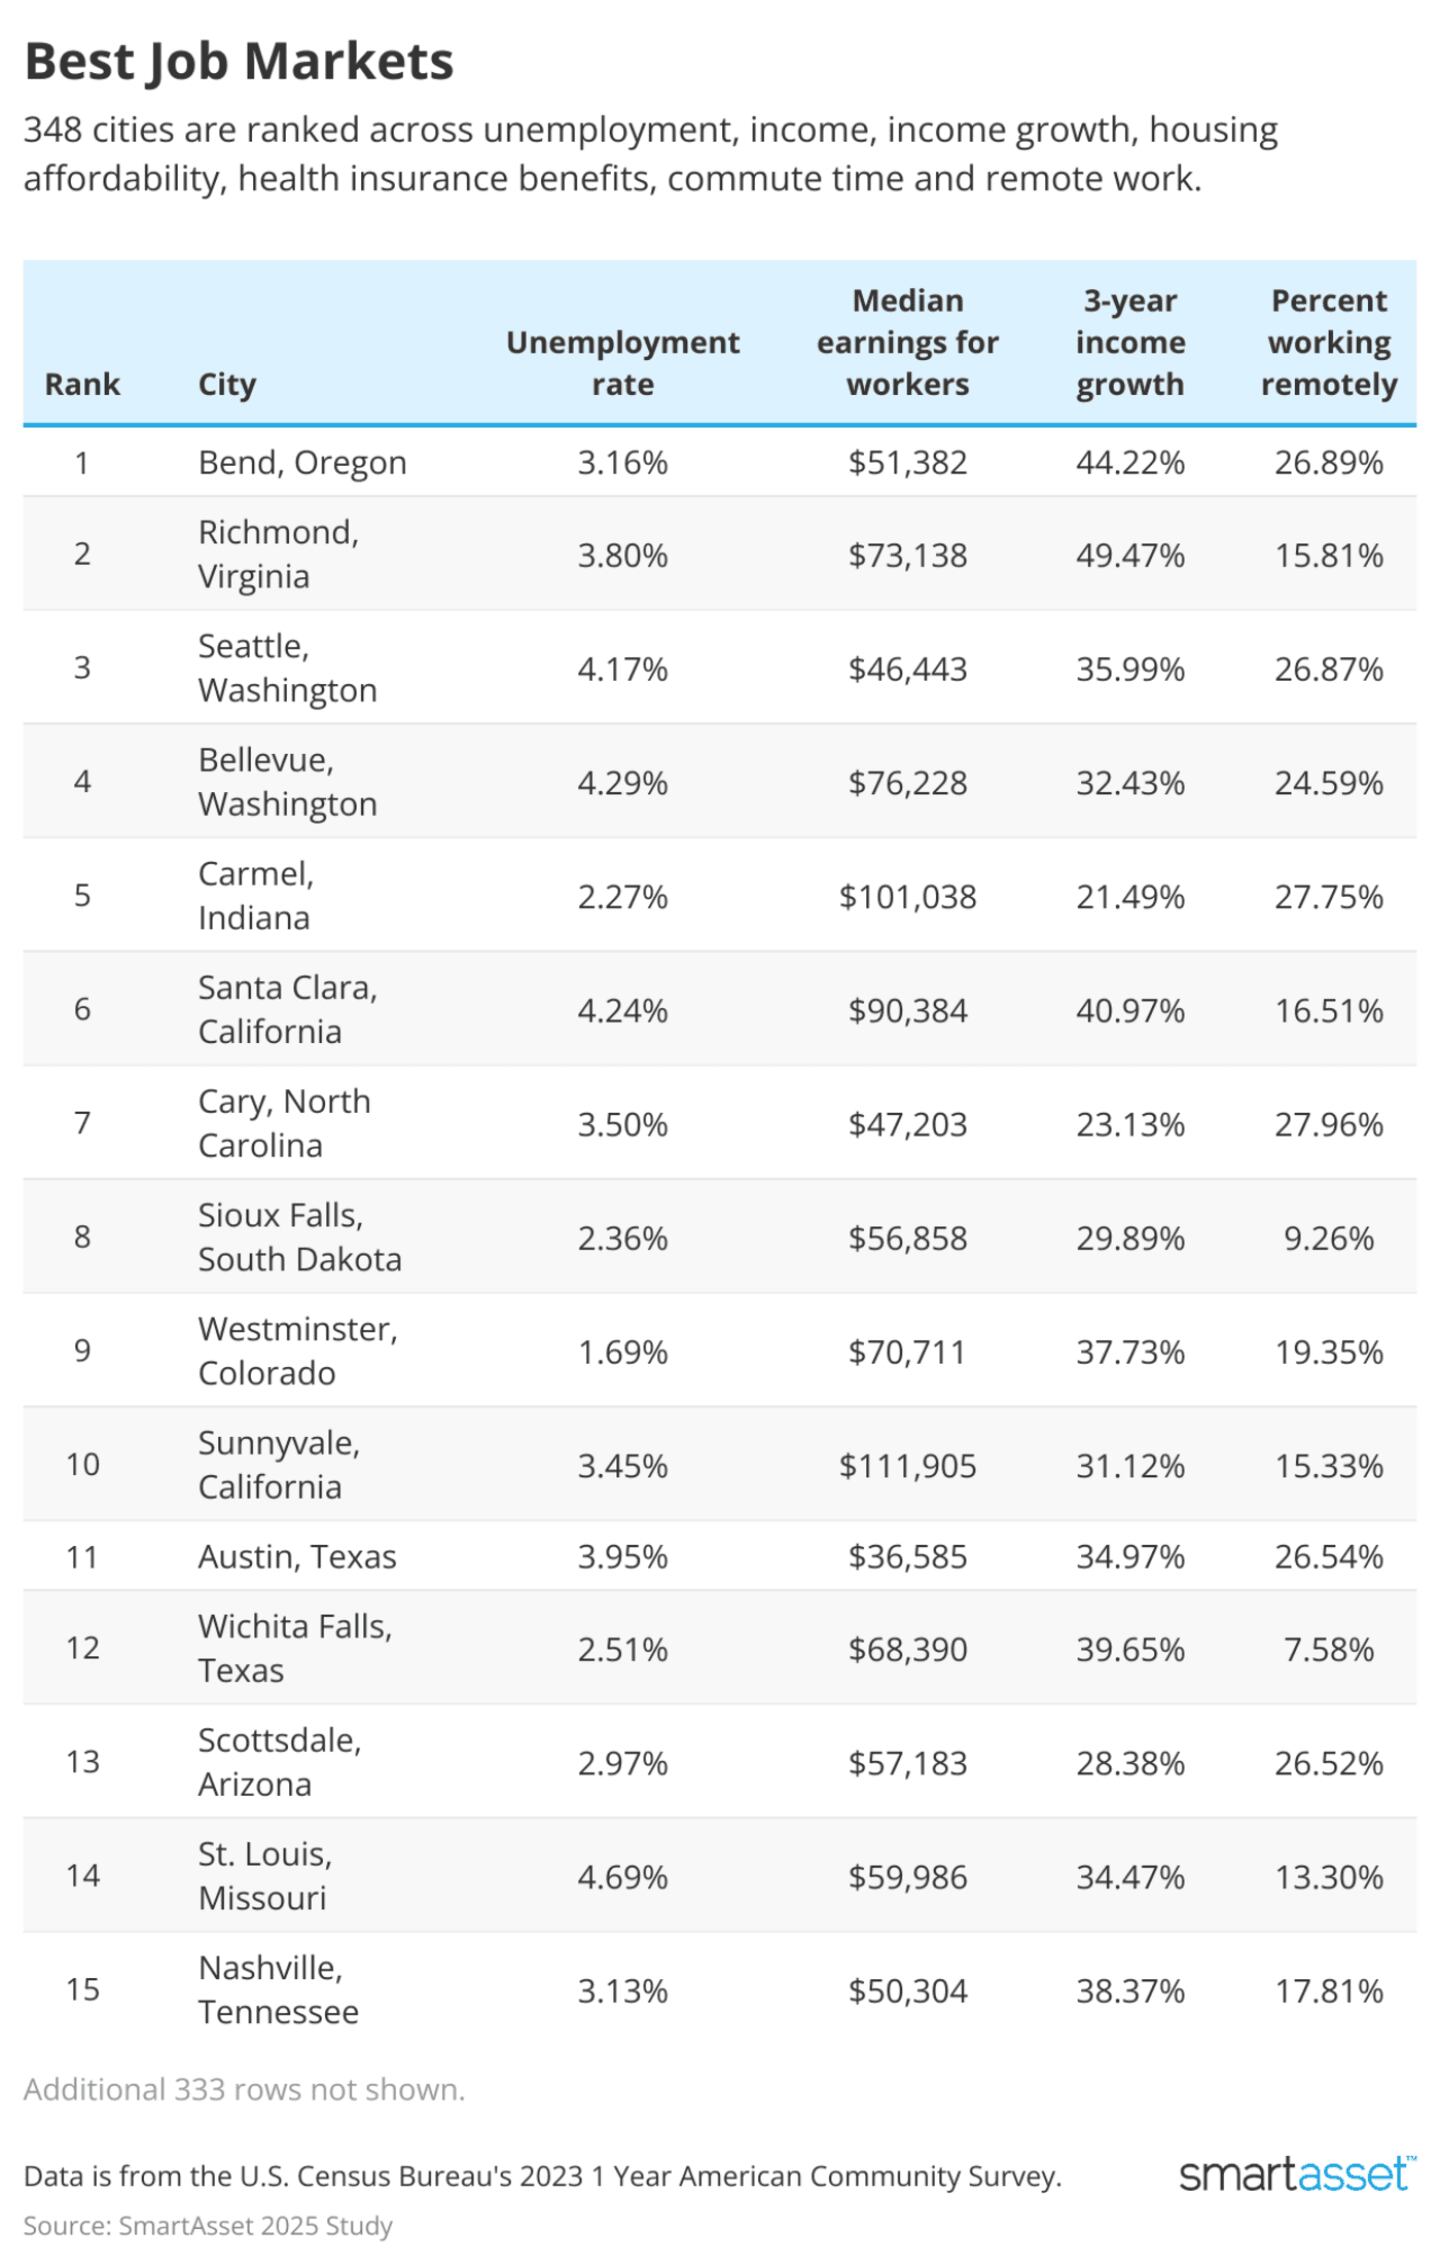
SmartAssetTop 20 Best Job MarketsBend, OregonUnemployment rate, 2023: 3.16%Median earnings for workers, 2023: $51,382Housing costs as a percentage of income: 42.74%Median monthly housing costs: $1,830Income growth, 2020 to 2023: 44.22%Median commute time in minutes: 16Percent of workers who work from home: 26.89%Number of remote workers: 15,883Percent of workers with private health insurance through their employer: 75.35%Richmond, VirginiaUnemployment rate, 2023: 3.80%Median earnings for workers, 2023: $73,138Housing costs as a percentage of income: 37.75%Median monthly housing costs: $1,718Income growth, 2020 to 2023: 49.47%Median commute time in minutes: 21.6Percent of workers who work from home: 15.81%Number of remote workers: 20,613Percent of workers with private health insurance through their employer: 77.40%Seattle, WashingtonUnemployment rate, 2023: 4.17%Median earnings for workers, 2023: $46,443Housing costs as a percentage of income: 33.92%Median monthly housing costs: $1,461Income growth, 2020 to 2023: 35.99%Median commute time in minutes: 25.5Percent of workers who work from home: 26.87%Number of remote workers: 132,724Percent of workers with private health insurance through their employer: 85.49%Bellevue, WashingtonUnemployment rate, 2023: 4.29%Median earnings for workers, 2023: $76,228Housing costs as a percentage of income: 30.30%Median monthly housing costs: $2,155Income growth, 2020 to 2023: 32.43%Median commute time in minutes: 25.4Percent of workers who work from home: 24.59%Number of remote workers: 21,082Percent of workers with private health insurance through their employer: 87.08%Carmel, IndianaUnemployment rate, 2023: 2.27%Median earnings for workers, 2023: $101,038Housing costs as a percentage of income: 28.19%Median monthly housing costs: $2,551Income growth, 2020 to 2023: 21.49%Median commute time in minutes: 22.8Percent of workers who work from home: 27.75%Number of remote workers: 15,989Percent of workers with private health insurance through their employer: 86.21%Santa Clara, CaliforniaUnemployment rate, 2023: 4.24%Median earnings for workers, 2023: $90,384Housing costs as a percentage of income: 39.05%Median monthly housing costs: $2,941Income growth, 2020 to 2023: 40.97%Median commute time in minutes: 23.9Percent of workers who work from home: 16.51%Number of remote workers: 13,540Percent of workers with private health insurance through their employer: 88.63%Cary, North CarolinaUnemployment rate, 2023: 3.50%Median earnings for workers, 2023: $47,203Housing costs as a percentage of income: 30.29%Median monthly housing costs: $1,116Income growth, 2020 to 2023: 23.13%Median commute time in minutes: 23Percent of workers who work from home: 27.96%Number of remote workers: 27,469Percent of workers with private health insurance through their employer: 86.63%Sioux Falls, South DakotaUnemployment rate, 2023: 2.36%Median earnings for workers, 2023: $56,858Housing costs as a percentage of income: 28.37%Median monthly housing costs: $1,861Income growth, 2020 to 2023: 29.89%Median commute time in minutes: 18Percent of workers who work from home: 9.26%Number of remote workers: 10,956Percent of workers with private health insurance through their employer: 81.36%Westminster, ColoradoUnemployment rate, 2023: 1.69%Median earnings for workers, 2023: $70,711Housing costs as a percentage of income: 39.28%Median monthly housing costs: $1,785Income growth, 2020 to 2023: 37.73%Median commute time in minutes: 26.9Percent of workers who work from home: 19.35%Number of remote workers: 13,356Percent of workers with private health insurance through their employer: 80.50%Sunnyvale, CaliforniaUnemployment rate, 2023: 3.45%Median earnings for workers, 2023: $111,905Housing costs as a percentage of income: 32.30%Median monthly housing costs: $3,012Income growth, 2020 to 2023: 31.12%Median commute time in minutes: 23.8Percent of workers who work from home: 15.33%Number of remote workers: 14,543Percent of workers with private health insurance through their employer: 86.92%Austin, TexasUnemployment rate, 2023: 3.95%Median earnings for workers, 2023: $36,585Housing costs as a percentage of income: 38.36%Median monthly housing costs: $966Income growth, 2020 to 2023: 34.97%Median commute time in minutes: 23.2Percent of workers who work from home: 26.54%Number of remote workers: 166,315Percent of workers with private health insurance through their employer: 81.24%Wichita Falls, TexasUnemployment rate, 2023: 2.51%Median earnings for workers, 2023: $68,390Housing costs as a percentage of income: 31.69%Median monthly housing costs: $1,875Income growth, 2020 to 2023: 39.65%Median commute time in minutes: 14.4Percent of workers who work from home: 7.58%Number of remote workers: 3,658Percent of workers with private health insurance through their employer: 69.88%Scottsdale, ArizonaUnemployment rate, 2023: 2.97%Median earnings for workers, 2023: $57,183Housing costs as a percentage of income: 32.90%Median monthly housing costs: $1,828Income growth, 2020 to 2023: 28.38%Median commute time in minutes: 22.7Percent of workers who work from home: 26.52%Number of remote workers: 34,047Percent of workers with private health insurance through their employer: 78.82%St. Louis, MissouriUnemployment rate, 2023: 4.69%Median earnings for workers, 2023: $59,986Housing costs as a percentage of income: 26.40%Median monthly housing costs: $1,793Income growth, 2020 to 2023: 34.47%Median commute time in minutes: 21.8Percent of workers who work from home: 13.30%Number of remote workers: 21,751Percent of workers with private health insurance through their employer: 79.55%Nashville, TennesseeUnemployment rate, 2023: 3.13%Median earnings for workers, 2023: $50,304Housing costs as a percentage of income: 37.09%Median monthly housing costs: $1,555Income growth, 2020 to 2023: 38.37%Median commute time in minutes: 24.7Percent of workers who work from home: 17.81%Number of remote workers: 73,091Percent of workers with private health insurance through their employer: 78.90%Chandler, ArizonaUnemployment rate, 2023: 2.77%Median earnings for workers, 2023: $50,854Housing costs as a percentage of income: 35.87%Median monthly housing costs: $1,567Income growth, 2020 to 2023: 30.60%Median commute time in minutes: 24.8Percent of workers who work from home: 22.55%Number of remote workers: 35,558Percent of workers with private health insurance through their employer: 81.95%Durham, North CarolinaUnemployment rate, 2023: 3.17%Median earnings for workers, 2023: $36,282Housing costs as a percentage of income: 36.98%Median monthly housing costs: $1,113Income growth, 2020 to 2023: 35.58%Median commute time in minutes: 22Percent of workers who work from home: 19.24%Number of remote workers: 33,185Percent of workers with private health insurance through their employer: 78.65%Columbia, MissouriUnemployment rate, 2023: 3.37%Median earnings for workers, 2023: $46,270Housing costs as a percentage of income: 36.81%Median monthly housing costs: $1,018Income growth, 2020 to 2023: 35.03%Median commute time in minutes: 16.5Percent of workers who work from home: 10.33%Number of remote workers: 7,380Percent of workers with private health insurance through their employer: 80.55%Denver, ColoradoUnemployment rate, 2023: 3.74%Median earnings for workers, 2023: $60,250Housing costs as a percentage of income: 37.56%Median monthly housing costs: $1,886Income growth, 2020 to 2023: 37.66%Median commute time in minutes: 25.7Percent of workers who work from home: 24.78%Number of remote workers: 111,924Percent of workers with private health insurance through their employer: 77.10%Washington, District of ColumbiaUnemployment rate, 2023: 5.26%Median earnings for workers, 2023: $60,409Housing costs as a percentage of income: 30.76%Median monthly housing costs: $1,919Income growth, 2020 to 2023: 36.19%Median commute time in minutes: 30.4Percent of workers who work from home: 25.73%Number of remote workers: 104,626Percent of workers with private health insurance through their employer: 80.81%Data and Methodology
For this SmartAsset study, 348 cities with 100,000 or greater population for which data was available were considered. All data comes from the U.S. Census Bureau’s American Community Survey for 2023. Six main categories evaluating different aspects of a city’s job market were considered, with commute time and remote work each receiving a half-weighting:
Unemployment rate: Average for the year 2023.Income to housing payment ratio: Median housing payments were compared to the median income to gauge the relative quality of local incomes.Commute time: For workers not working from home, this measures the median minutes spent in transit to work.Remote work: The percent of workers working remotely.Healthcare: The percent of employed people who have private health insurance, i.e. health insurance through their employer.Income growth: This is the three-year growth in median income between 2020 and 2023.
This story was produced by SmartAsset and reviewed and distributed by Stacker.