
Participants
In this study, we used 11 independent datasets comprising 863 total participants after quality control. These datasets include (1) PIPD dataset99: 166 patients with PD and 60 HC individuals; (2) DBS-fMRI dataset: 14 patients with PD, with evaluations conducted both before and after DBS surgery, along with 25 HC individuals; (3) TMS dataset: 36 patients with PD; (4) DBS-SS dataset: 342 patients with PD; (5) DBS-ECoG dataset: 17 patients with PD who underwent STN-DBS surgery and DBS-evoked ECoG recording; (6) MRgFUS dataset: 10 patients with tremor-dominant PD; (7) aDBS dataset: 4 patients with PD; (8) LCT dataset: 21 patients with PD; (9) ET dataset100: 45 patients with ET and 45 HC individuals from the PIPD dataset; (10) dystonia dataset: 42 patients with dystonia and 21 HC individuals; and (11) ALS dataset: 30 patients with ALS and 30 HC individuals. PD was diagnosed according to the revised clinical diagnostic criteria of the International Movement Disorder Society (MDS, 2015 version) or the Chinese Parkinson’s Disease Diagnostic Criteria (2016 version). The following sections provide detailed descriptions for each dataset.
PIPD datasetPatients
In total, 180 patients with PD were recruited from Henan Provincial People’s Hospital (HPPH), China. The inclusion criteria included being aged 18 years or above and a clinical diagnosis of PD. Exclusion criteria comprised the following: (1) MRI contraindications; (2) a history of neurological disorders aside from PD, including stroke, cerebrovascular disease, seizures and brain tumours; (3) previous invasive neurosurgeries such as DBS or ablation; and (4) average relative head motion larger than 0.2 mm during rsfMRI scanning. Four patients did not complete MRI scanning, and ten patients were excluded owing to excessive head motion. Ultimately, 166 patients were included in the analysis (64 women, 102 men; mean ± s.d. age = 61.8 ± 7.84 years; demographic and clinical details are provided in Extended Data Table 1).
HC participants
In total, 71 healthy participants aged 18 years or older, lacking neurological or psychiatric disorders, were enrolled. Exclusion criteria included MRI contraindications and an average relative head motion exceeding 0.2 mm. After excluding 11 participants owing to excessive head motion, the analysis included 60 HC participants (34 women, 26 men; mean ± s.d. age = 56.10 ± 6.64 years; Extended Data Table 1). The control group exhibited significantly different demographics from the PD group. We therefore sampled a subset of 65 patients with PD from the 166 patients to ensure demographic matching when performing case–control analyses (Extended Data Table 1). The experimental protocol was approved by the HPPH Institutional Review Board (IRB). Written informed consent was obtained from all of the participants.
MRI acquisition
The participants underwent one structural MRI scan lasting 8 min and 50 s, and five scans, each spanning 6 min and 14 s, resulting in a cumulative scan duration of 31 min and 10 s. MRI was performed using the Siemens 3 T Prisma MRI scanner equipped with a 64-channel head coil. The structural scans involved T1-weighted images acquired through a MP2RAGE sequence (TI1 = 755 ms, TI2 = 2500 ms, TE = 3.43 ms, TR = 5,000 ms, flip angle1 = 4°, flip angle2 = 5°, matrix size = 256 × 256, 208 sagittal slices, spatial resolution = 1 × 1 × 1 mm3). An acceleration factor of 3 (with 32 reference lines) was applied in the primary phase encoding direction, with online GRAPPA image reconstruction. rsfMRI data were acquired using a gradient-echo echo planar imaging (GE-EPI) sequence (TE = 35 ms, TR = 2,000 ms, flip angle = 80°, and 75 slices, spatial resolution = 2.2 × 2.2 × 2.2 mm3). During data acquisition, the participants were instructed to keep their eyes open, remain awake while keeping their body still and minimize head movement.
DBS-fMRI datasetPatients
This dataset is a part of the 3 T MRI-compatible DBS cohort. A total of 14 patients (5 women, 9 men; mean ± s.d. age = 54.71 ± 7.65 years) diagnosed with the akinetic-rigid dominant form of clinically diagnosed PD were recruited from three centres, including Tiantan Hospital, Beijing; Peking Union Medical College Hospital, Beijing; and Qilu Hospital, Jinan, China. Ethics approval for this project was granted by the ethics committees of Tiantan Hospital (QX2016-009-02, 21 July 2016), Peking Union Medical College Hospital (HS2016094, 21 September 2016) and Qilu Hospital (2016008, 28 August 2016), with ClinicalTrails.gov identifier NCT02937727. Written informed consent was obtained from all of the participating individuals. Inclusion criteria consisted of: (1) aged between 18 and 75 years; (2) MMSE score above 24; (3) Hoehn–Yahr scale above stage two in the medication off status; (4) PD duration exceeding 5 years; (5) established positive response to dopaminergic medication (at least 30% UPDRS-III improvement with levodopa); and (6) ability to provide informed consent, assessed through preoperative neuropsychological evaluation. Exclusion criteria encompassed: (1) ineligibility for DBS, such as anaesthesia complications; (2) history of hydrocephalus, brain atrophy, cerebral infarction or cerebrovascular diseases; (3) inability to comply with verbal instructions; (4) the presence of severe pathological chronic conditions that might confound treatment effect or data interpretation; (e) MRI contraindications or inability to complete MRI scans. Out of the initial cohort, 11 patients had a complete dataset, whereas three patients had incomplete data due to missing post-surgical visits (DBS01 after the 1-month follow-up, DBS03 after the 3-month follow-up, and DBS08 at the 1-month follow-up only).
Each patient underwent standard frame-based stereotaxic DBS implantation surgery at one of the aforementioned medical institutions. The bilateral STNs were the targeted regions for DBS, localized through presurgical structural MRI scans, intraoperative electrophysiological recordings and observed motor symptom improvement during the surgery. Two quadripolar DBS electrodes (Model L301C, Pins Medical) were bilaterally implanted into the STN for each patient. A low-field-potential sensing-enabled neurostimulator (G106R, Beijing Pins Medical) was connected to the leads (Model E202C, Pins Medical) during a single operation. The DBS stimulator and electrodes were compatible with the 3 T MRI environment and proven safe for MRI scans with implantation. At each post-surgical visit, a team of two neurologists managed each patient’s DBS system. Optimized DBS programming, resulting in optimal motor symptom improvement, was achieved by selecting positive and negative contacts and determining stimulation frequency, amplitude and pulse width.
HC participants
HC participants matched in age to the patient group were recruited. Similar exclusion criteria were applied, encompassing relevant medical history, ability to follow instructions, conditions that could complicate data interpretation, MRI contraindications and average relative head motion exceeding 0.2 mm. The control group comprised 28 participants. One participant was excluded owing to incomplete MRI data caused by discomfort in the scanner, and two participants were excluded owing to excessive head motion, leaving 25 participants suitable for the case–control analysis (Extended Data Table 1; 13 women and 12 men; mean ± s.d. age = 56.32 ± 6.88 years).
MRI acquisition
The participants underwent data acquisition across five visits—one presurgical and four post-surgical follow-up visits. The presurgical visit occurred approximately 1 month before the DBS surgery, whereas the post-surgical visits occurred at 1, 3, 6 and 12 months after surgery. MRI scans, neurological assessments and computerized tomography (CT) scans were performed. Notably, the presurgical visit involved one T1w MRI run and five rsfMRI runs (totalling 31 min of rsfMRI). For each post-surgical visit, the participants underwent four runs of DBS ON (130 Hz continuous stimulation) blood-oxygen-level-dependent (BOLD) fMRI (25 min) followed by four runs of DBS OFF fMRI (25 min). The control participants had one visit, involving one T1-weighted MRI run and three BOLD fMRI runs lasting 19 min in total.
All MRI data were collected using the 3 T Philips Achieva TX whole-body MRI scanner equipped with a 32-channel head coil. T1-weighted structural images were acquired using a MPRAGE sequence, lasting 4 min and 14 s (TE = 3.70 ms, TR = 7.52 ms, flip angle = 8°, 180 sagittal slices, spatial resolution = 1 × 1 × 1 mm3). Functional images were acquired with a 6-min and 14-s transversal GE-EPI sequence (TE = 30 ms, TR = 2,000 ms, flip angle = 90°, 37 slices, spatial resolution = 2.875 × 2.875 × 4 mm3, 184 frames per run). CT images were acquired using the uCT 760 (United Imaging) scanner 1 month after surgery. A head helical sequence, with FOV = 512 × 512, pixel spacing = 0.449 mm × 0.449 mm, 204 slices, slice thickness = 0.625 mm, was used.
TMS datasetPatients
The participants were recruited at HPPH from 29 May 2023 to 28 April 2024. The study protocol was approved by the institutional ethics committee of HPPH (2023LS37, 7 May 2023). Written informed consent was obtained from all of the participating individuals. Registration of this study was not required according to ClinicalTrials.gov. However, the study was registered to ensure transparency, with the ClinicalTrials.gov identifier NCT06734676. Inclusion criteria included: (1) confirmed diagnosis of PD; (2) age 18 to 75 years; (3) stable anti-PD medication treatment for a minimum of 2 months; (4) MMSE score above 24; and (5) providing signed informed consent. Exclusion criteria included: (1) confirmed diagnosis of other neurological disorders; (2) implanted medical devices; (3) contraindications to MRI scanning and TMS; (4) personal or family history of epilepsy; (5) previous neuromodulation treatments within the past 3 months; (6) other health abnormalities that the investigator deems unsuitable for study participation.
In the study, 36 patients with PD (13 women, 23 men; mean age = 65.06 ± 6.82 years; Extended Data Table 1) were randomly divided into two groups at a ratio of 1:1, where one group received SCAN stimulation (SCAN group, n = 18) and the other M1 effector-specific stimulation (effector group, n = 18), over a span of 14 consecutive days. The randomization codes were generated using a custom script by an independent research assistant before the start of the recruitment. The group allocation was kept in a sealed opaque envelope, which was only opened when a patient was enrolled. The assistant sent the target coordination according to the group allocation for each patient to TMS operators. Patients, assessors, TMS operators and other research staff were all blinded to the group allocations. The sample size was estimated according to a preliminary experiment with an expected effect size of 1.0 and a low dropout rate, yielding a minimum of 18 participants per group to achieve 80% power with an alpha level of 0.05. Group differences in baseline demographics and clinical characteristics of participants between the SCAN and effector groups were statistically assessed using two-tailed independent t-tests or Fisher’s exact tests, as appropriate (Supplementary Table 5). One patient in the effector group discontinued stimulation owing to a scheduling conflict, leaving 17 patients in the group for outcome analysis. On each treatment day, two sessions of 1,800-pulse iTBS were administered at 50-min intervals in the morning and afternoon (Supplementary Fig. 13). In the SCAN group, all of the patients received stimulation in the middle SCAN region due to its easier accessibility to TMS. In the effector group, the patients received either foot or hand network stimulation according to the limb that was most affected. This was assessed by summing up the hand- and foot-related subscores of the MDS-UPDRS-III. Both groups received unilateral stimulation targeting the hemisphere contralateral to the side of the body with more severe motor symptoms. Stimulation targets were individualized based on personalized functional networks on the precentral gyrus identified using the patients’ pretreatment scans. The stimulations were administered using an MT20A system (Neural Galaxy) equipped with a figure-of-eight coil, at 90% of the resting motor threshold (RMT). The RMT was defined as the minimum stimulation intensity required to elicit MEPs, recorded from the contralateral first dorsal interosseous muscle, with amplitudes ≥50 μV in at least 5 out of 10 consecutive trials. An experienced TMS operator, blinded to group assignment, identified the hand knob region based on anatomical landmarks and determined the motor hotspot for RMT without reference to the planned stimulation coordinates. The system also incorporates a real-time neuronavigation system to guide the placement of the coil throughout the stimulation procedure to ensure stimulation accuracy101.
MRI acquisition
The same MRI scanner and parameters were used as in the PIPD dataset. In total, 900 functional image frames were collected from each participant, equivalent to 30 min, both before and after TMS treatment. The SCAN group had one patient who did not complete the follow-up scanning. Moreover, three patients from each group were excluded from the RSFC analysis owing to average relative head motion during scans greater than 0.25 mm, leaving 14 patients in each group.
DBS-ECoG datasetPatients
This dataset was documented in a previous report48. In brief, 17 patients with PD (5 women, 12 men; mean ± s.d. age = 66.02 ± 6.33 years) who were candidates for STN DBS surgery were recruited at the University of Pittsburgh Medical Center. The protocol was approved by the local IRB (REN15020171/PRO13110420, 5 March 2015), and all of the participants provided written informed consent. Before the DBS surgery, dopaminergic medications were paused for 12 h. Before insertion of the microelectrodes, one or two subdural high-density ECoG arrays (63 channels, 3 × 21 contact array, 1-mm contact diameter, 3-mm separation; PMT) were temporarily placed on the left-hemisphere cerebral cortex. The ECoG strip locations were preoperatively planned to cover cortical regions of interest (ROIs), including the motor cortex.
STN stimulation and ECoG recording
Before starting the clinical microelectrode recordings, sedation was temporarily suspended, ensuring that the patients were at their standard neurological status as determined by clinical evaluations. Recordings were acquired using microprobe electrodes and monopolar stimulation of the STN was performed using a macro cylindrical contact (ring electrode, diameter 0.7 mm, length 1 mm) with the Neuro Omega stimulation software (Alpha Omega). After clinical assessments were concluded, anaesthesia monitoring was performed for at least 45 min. Subsequently, research-oriented stimulation was carried out at frequencies of 1 Hz for 30 s (totalling 30 stimulation pulses) and 10 Hz for 30 s (totalling 300 stimulation pulses) at intensities of 1, 2 and 3 mA at two different depths in the STN, each separated by at least 2 mm vertically. Concurrently with the stimulation, cortical evoked potentials were captured, amplified and digitalized using the Grapevine Neural Interface Processor (Ripple Neuro). The signals were captured at a 30 kHz sampling rate, with all of the channels referenced to a scalp ground.
The detailed approach to identify the locations of the ECoG strips was documented in a previous study102. The localization is based on preoperative stereotactic CT scans (General Electric, 9800) after placement of the Laksell frame, intraoperative fluoroscopy imaging (512 × 512 pixels, General Electric, OEC 9900) or CT imaging, and postoperative MRI (Siemens Allegra 1.5 T). Stereotactic CT images, either pre- or intra-operatively acquired, consisted of axial slices with a thickness of 1.5 mm. MRI scans were performed using a T1w volumetric fast spoiled gradient echo (FSPGR) sequence (slice thickness = 1.5 mm, repetition time = 33.33 ms, echo time = 6 ms, flip angle = 35°).
MRgFUS datasetPatients
A cohort of 10 patients with tremor-dominant PD (2 women, 8 men, mean ± s.d. age = 55.40 ± 7.24 years) was recruited for VIM-MRgFUS treatment at HPPH. The study was approved by the local IRB (2018-064-02, 29 December 2018), with ClinicalTrails.gov identifier NCT04002596. Written informed consent was obtained from all of the participating individuals. Inclusion criteria and clinical information for these patients were described in detail in our previous report49. MRgFUS was used to lesion the VIM contralateral to the most affected hand. The approximate target location was set on the anterior commissure (AC)– posterior commissure (PC) plane, at 75% of the AC–PC line and 14 mm lateral to the AC–PC line. When there was third ventricle enlargement, the approximate target was set to 11.5 mm lateral to the third ventricle wall.
MRI acquisition
MRI data were collected using the same MRI scanner and T1w and BOLD fMRI sequences as in the PIPD dataset. Moreover, T2w scans were collected the day after the MRgFUS intervention to image the brain lesions, using a 3 T MRI scanner (Discovery MR750, GE Healthcare) equipped with an 8-channel head coil (axial scans, TE = 98 ms, TR = 6,279 ms, flip = 111°, matrix = 288 × 384, FOV = 240 × 240 mm, slice thickness = 2 mm, slice interval = 2 mm, 31 slices; coronal scans, TE = 98 ms, TR = 6,264 ms, flip = 111°, FOV = 240 × 240 mm, matrix = 224 × 384, slice thickness = 2 mm, slice interval = 2 mm, 25 slices; sagittal scans, TE = 98 ms, TR = 6,268 ms, flip = 111°, FOV = 240 × 240 mm, matrix = 288 × 384, slice thickness = 2 mm, slice interval = 2 mm, 31 slices).
Lesion delineation
The MRgFUS lesions were manually delineated based on T1w and T2w images by a radiologist who was blinded to patients’ clinical information using MRIcro (www.mccauslandcenter.sc.edu/mricro/). These lesions were subsequently overlapped to generate a lesion overlap map of the VIM target.
DBS-SS dataset
DBS sweet spots were extracted from a comprehensive retrospective multicohort DBS study39. In this dataset, there were 275 patients who underwent STN-DBS (80 women, 195 men, mean ± s.d. age = 59.8 ± 7.1 years), 28 patients with GPi-DBS (13 women, 15 men, mean ± s.d. age = 64.4 ± 7.0 years), and 39 patients with VIM-DBS (13 women, 26 men, mean ± s.d. age = 64.3 ± 11.6 years; Supplementary Table 1), following the IRB approval (15-9777). Written informed consent was obtained from all participants. Sweet spot atlases for STN-, GPi- and VIM-DBS were constructed based on probabilistic stimulation mapping, with sweet spots defined as voxels where the stimulation was consistently yielded above-average clinical improvement. The specific atlas used was the preinstalled version within the LEAD-DBS software103. We generated the target ROIs by applying a binary transformation to the probabilistic values of the sweet spot or overlap maps using a threshold greater than zero.
aDBS dataset
The aDBS dataset was reported in a previous study28, including four male patients with PD (mean ± s.d. age = 58.50 ± 8.74 years), enrolled from the Departments of Neurology and Neurological Surgery at the University of California, San Francisco. The study was approved by the IRB of the University of California, San Francisco (18-24454, 2 August 2018) with ClinicalTrails.gov identifier NCT03582891. Written informed consent was obtained from all of the participants. Each patient underwent the bilateral STN-DBS implantation (Medtronic, 3389) along with the implantation of bilateral quadripolar subdural cortical electrode strips (Medtronic, 0913025) over the sensorimotor cortex. On the basis of a data-driven identification of optimal neural biomarkers of symptoms, cortical electrodes were used to extract real-time neural signals in three participants and four independently controlled hemispheres, serving as control signals in the aDBS control system. The remaining participant used subthalamic signals for adaptive control. Two patients received unilateral aDBS in the left hemisphere (patient 1 and patient 4) using cortical control, while the one other received independent bilateral aDBS using cortical control (patient 3), yielding six independent cortical hemispheres. The cortical electrode placements were identified by aligning postoperative CT scans with preoperative MRI. The locations of the electrodes were registered to the Montreal Neurological Institute (MNI) coordinate system. The study protocol is accessible at OSF (https://osf.io/cmndq/).
LCT datasetParticipants
A total of 21 patients with PD (mean ± s.d. age = 65.43 ± 4.12 years, 13 female individuals) were recruited to participate in a simplified LCT. The inclusion criteria included being aged between 40 and 75 years currently, with age ≥ 40 years at the time of diagnosis, and having a confirmed diagnosis of PD. Moreover, the participants must be in Hoehn–Yahr stages I–IV and show responsiveness to levodopa treatment, with a LCT improvement rate of ≥30%. The disease duration must be ≥3 years. Exclusion criteria comprised the following: (1) MRI contraindications; (2) Parkinson-plus syndromes or secondary parkinsonism; (3) a history of neuropsychiatric disorders aside from PD, including stroke, cerebrovascular disease, seizures and psychosis; (4) the presence of alcohol or other substance abuse; (5) inability to cooperate with MRI data collection. One patient was excluded owing to excessive head motion (mean relative motion >0.25 mm). The experimental protocol was approved by the IRB of Changping Laboratory (ER-25001-01, 17 April 2025). Written informed consent was obtained from all of the participants.
MRI acquisition
All MRI data were acquired using a 3 T GE SIGNA UHP scanner equipped with a 48-channel head coil at Changping Laboratory. In the medication off state (≥12 h after medication withdrawal), five rsfMRI runs (6 min each, totalling 30 min) were acquired with a gradient-echo EPI sequence (TR = 3,000 ms, TE = 30 ms, flip angle = 90°, voxel size = 3 × 3 × 3 mm3, 47 axial slices). After the medication off scanning, the patient was instructed to take 150% of their regular morning levodopa dose by a neurologist from the Peking University First Hospital, and once peak motor response was jointly confirmed by the patient and the evaluator, the medication on scan was conducted using the same imaging protocol. Subsequently, structural images were collected using a 3D MPRAGE T1-weighted sequence with 1 mm isotropic resolution (192 sagittal slices, TR = 2,708 ms, TE = 3.5 ms, TI = 900 ms, flip angle = 8°, FOV = 256 × 256 mm2). During all MRI sessions, the participants were instructed to keep their eyes closed, remain awake, minimize head motion and stay as still as possible.
ET datasetParticipants
A total of 45 patients with ET (mean ± s.d. age = 62.02 ± 13.10 years, 15 female individuals; Supplementary Table 7) were recruited from HPPH, China. The inclusion criteria included being aged 22 years or above and having a confirmed diagnosis of ET. Exclusion criteria comprised the following: (1) MRI contraindications; (2) the presence of any other neurodegenerative disease, such as Parkinson-plus syndromes; and (3) a history of neuropsychiatric disorders aside from ET, including stroke, cerebrovascular disease, seizures and psychosis. In total, 45 age- and sex-matched healthy participants (mean ± s.d. age = 58.28 ± 5.68 years, 19 female individuals) were sampled from the HC group from the PIPD dataset. Two male patients with ET were excluded owing to excessive head motion (mean relative motion >0.25 mm). The experimental protocol was approved by the IRB of HPPH (2018-065-02, 29 December 2018). Written informed consent was obtained from all of the participants.
MRI acquisition
The MRI scanning protocol was identical to that used in the PIPD dataset.
Dystonia datasetParticipants
In total, 63 participants were enrolled, including 24 patients with laryngeal dystonia (LD, 4 abductor type, 20 adductor type; mean ± s.d. age = 60.5 ± 11.1 years, 17 female individuals), 18 patients with focal hand dystonia (FHD, mean ± s.d. age = 55.1 ± 14.6 years, 6 female individuals) and 21 HC individuals (mean ± s.d. age = 53.4 ± 12.7 years, 5 female individuals; Supplementary Table 8). The study was approved by the IRB of the Mass General Brigham (2017P002446/PHS, 22 January 2018), and all of the participants provided written informed consent in accordance with the Declaration of Helsinki. For all of the participants with focal dystonia, it had been at least 3 months since their last botulinum toxin injection and they were symptomatic during the performance of their dystonia-related tasks. Two participants from the LD group and one participant from the HC group were excluded from further analysis owing to excessive head motion during rsfMRI (mean relative motion > 0.25 mm).
MRI acquisition
Participants underwent one structural MRI scan, and four rsfMRI scans, each spanning 6 min, resulting in a cumulative scan duration of 20 min. MRI data were acquired using a 3 T Siemens Magnetom Prisma fit scanner equipped with a 32-channel head coil (Siemens Healthineers). T1-weighted structural imaging used a 3D MPRAGE sequence (TR = 2.5 s, TI = 1.0 s, 0.8 mm isotropic voxels, FOV = 256 mm, 208 sagittal slices, flip angle = 8°, bandwidth = 740 Hz per px). rsfMRI was obtained with a GE-EPI sequence (TR = 3,000 ms, TE = 30 ms, 3.0 mm isotropic voxels, FOV = 216 mm, 47 sagittal slices, flip angle = 85°, bandwidth = 2,240 Hz per px, echo spacing = 0.51 ms). During the resting-state scans, the participants were instructed to remain still with their eyes closed, stay awake and relax without focusing on any specific thoughts.
ALS datasetParticipants
In total, 30 patients with ALS (mean ± s.d. age = 59.52 ± 8.72 years; 14 female individuals) and 30 HC individuals (mean ± s.d. age = 62.68 ± 6.83 years, 15 female individuals; Supplementary Table 9) were enrolled. Inclusion criteria of ALS participant were: (1) current age between 40 and 80 years; (2) diagnosis of probable or higher-level motor neuron disease according to the revised El Escorial criteria; and (3) meeting the UMND ALS diagnostic criteria, presenting with upper motor neuron involvement in at least three segments and lower limb dysfunction with a Berg Balance Scale score below 40. Exclusion criteria were as follows: (1) MRI contraindications; (2) history of neurological or psychiatric disorders such as stroke, cerebrovascular disease, epilepsy or psychosis; (3) alcohol or other substance abuse; and (4) severe depression or anxiety (HAMD-17, ≥18; HAMA, ≥21). No participants were excluded for excessive head motion during rsfMRI (mean relative motion > 0.25 mm). The experimental protocol was approved by the IRB of Changping Laboratory (CPNL-IRB-0002-2, 21 June 2024). Written informed consent was obtained from all of the participants.
MRI acquisition
The MRI scanning protocol was identical to that used in the LCT dataset.
Clinical assessments
The primary outcome measure of patient motor symptoms was assessed using the UPDRS-III. In the DBS-fMRI dataset, the original version of the UPDRS-III was used in the medication off state, with patients refraining from taking medication for a minimum of 12 h before assessment. Subsequently, two experienced neurologists independently scored each UPDRS-III subitem based on recorded video material. Rigidity-related subitems were assessed by an on-site neurologist. These assessments exhibited substantial inter-rater reliability (ICC = 0.90)104. The scores used in this study represent the averages of the two assessors’ scores. In the TMS dataset, the MDS-UPDRS-III105 evaluations were conducted at the baseline as well as at 1 week and 2 weeks into treatment in the on-medication state. The primary and secondary outcomes were the changes in MDS-UPDRS-III score at the end of treatment (week 2 − baseline) and at week 1 (week 1 − baseline), respectively. These assessments were conducted by the same experienced neurologist who was blinded to the patients’ group allocation. Moreover, we extracted specific subscores from the MDS-UPDRS-III to assess more targeted motor symptoms (Supplementary Table 4). In the PIPD and MRgFUS datasets, motor symptoms were evaluated in the on-medication state using the MDS-UPDRS-III. In the PIPD dataset, additional clinical assessments included the MMSE for cognitive function, the HAMD for depressive symptoms and the HAMA for anxiety symptoms. In the LCT dataset, motor symptoms were assessed using the MDS-UPDRS-III in both off and on medication states, conducted by the same neurologist from Peking University First Hospital to ensure consistency.
MRI preprocessing
The processing of both and structural data was conducted using the personalized Brain Functional Sectors (pBFS) Cloud v.1.0.7 (Neural Galaxy). The preprocessing pipeline, developed from our previously described pipeline101,106,107, was adapted with software substitutions. The fMRI preprocessing sequence encompassed the following steps: (1) slice timing correction through stc_sess from the FreeSurfer v.6.0.0 software package (http://surfer.nmr.mgh.harvard.edu); (2) head motion correction using mc_sess from FreeSurfer (https://surfer.nmr.mgh.harvard.edu/fswiki/mc-sess); (3) linear detrending and bandpass filtering within the range of 0.01–0.08 Hz; and (4) regression to account for nuisance variables, which encompassed the six motion parameters, white matter signal, ventricular signal, global signal108,109 and their first-order temporal derivatives.
For MP2RAGE T1w images of the PIPD, TMS and MRgFUS dataset, the brain was first extracted from the uniform T1-weighted image using Advanced Normalized Tools (ANTs)110. The subsequent preprocessing steps are consistent across structural sequences from the three datasets. The FreeSurfer v.6.0.0 software package (http://surfer.nmr.mgh.harvard.edu) was used for processing111. Surface mesh representations of the cerebral cortex were reconstructed from T1w images and non-linearly aligned to a shared spherical coordinate system. The functional and structural images were co-registered using boundary-based affine registration from the FsFast software package (http://surfer.nmr.mgh.harvard.edu/fswiki/FsFast). For the surface preprocessing pipeline, the functional images were aligned with the FreeSurfer cortical surface template (fsaverage6, 40,962 vertices per hemisphere). The fMRI surface data were smoothed by applying a 6-mm full-width half-maximum (FWHM) surface smoothing kernel. For the volumetric preprocessing pipeline, the preprocessed functional images in native space were normalized to a 2-mm spatial resolution volumetric template (the FSL version of the MNI ICBM152 non-linear template) using a co-registration matrix and volumetric non-linear registration with ANTs110. Then, a 6-mm FWHM isotropic smoothing Gaussian kernel was applied to the registered fMRI data within the brain mask.
RSFC analyses
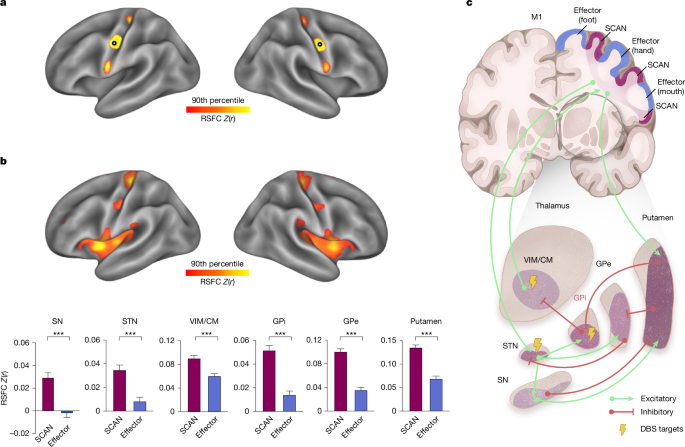
In this study, we conducted three kinds of seed-based RSFC analyses. First, we performed cortico–cortical RSFC analysis to identify the SCAN inter-effector regions in participants. Second, we performed cortical RSFC analyses using seed ROIs derived from well-recognized subcortical regions in the widely accepted circuit models of PD pathophysiology3,5,19, including the SN, STN, thalamus/VIM, GPi, GPe and putamen using the HyraPD atlas112,113. The SN pars compacta (SNpc) and pars reticulata (SNpr) were combined into a single ROI—the SN—due to the limited spatial resolution of fMRI and the close anatomical proximity of these two structures. We also used seeds from the DBS sweet spot atlases. Lastly, we investigated whole-brain RSFC based on the seeds of the SCAN or the effector-specific network. To estimate the seed-based RSFC maps, we calculated Pearson correlations between the average BOLD fMRI signals within the seed ROI and the signals from cortical vertices or whole-brain voxels, in each participant. Subsequently, we converted the correlation coefficients (r values) into z values through Fisher’s r-to-z transformation, normalizing the correlation coefficients. To generate group-averaged RSFC maps, we calculated the mean of the individualized z-maps across all participants in the group. To estimate cortical or whole-brain RSFC within a specific functional network or a ROI, we averaged the RSFC across all vertices within the network or region. To compare SCAN to effector RSFC (Fig. 1) or SCAN RSFC between patients with PD and HC individuals (Fig. 2) or changes in SCAN RSFC before and after treatment (Figs. 4 and 5), we averaged the RSFC across all six subcortical regions important in PD.
To assess differences in RSFC across networks, we used two-tailed paired t-tests when comparing RSFC between the SCAN, effector and other cortical networks. For group comparisons between patients with PD and healthy control individuals, we used two-tailed independent t-tests. Once we established that PD exhibited SCAN hyperconnectivity, we hypothesized that PD treatments would be associated with reduced hyperconnectivity. Thus, for longitudinal comparisons between the pretreatment baseline and post-treatment follow-up timepoints, including post-DBS, post-TMS and post-levodopa conditions, one-tailed paired t-tests were used, based on an a priori directional hypothesis that therapeutic STN-DBS, SCAN-targeted TMS and levodopa would reduce the SCAN hyperconnectivity observed in PD. To control for multiple comparisons across timepoints, networks or subcortical structures, FDR correction was applied.
Identification of the cortical SCAN regions
To identify the cortical SCAN regions, we performed a two-stage analysis consisting of an exploration stage and a network identification stage. First, to explore the existence of both individualized and group-level cortical SCAN regions, we placed a continuous line of seeds along the precentral gyrus and estimated their individual-specific or group-averaged RSFC, according to a previously described procedure6. Second, to delineate the personalized SCAN, we used an iterative precision functional mapping approach, as previously reported in detail114,115,116. In brief, the personalized functional parcellation was initiated from an atlas consisting of 17 group-average canonical functional networks and the SCAN from ref. 6. Each cortical vertex was assigned to one of the networks according to the correlation between the vertex’s BOLD signal and the average BOLD signals of the 18 networks. The assignment was iteratively adjusted according to the same procedure described in ref. 114. Effector-specific network mapping was performed using the same procedure.
RSFC–symptom association analyses
To explore the relationship between SCAN-subcortical RSFC and both motor and non-motor symptoms, we performed separate partial least squares (PLS) regression analyses linking RSFC between six subcortical ROIs and the cortical SCAN to each of four clinical measures—MDS-UPDRS-III, MMSE, HAMA and HAMD—in the PIPD dataset. The regression analyses controlled confounds, including age, sex and disease severity measured by the Hoehn–Yahr scale. For each domain, we extracted the first latent variable (PLS1), which captures the optimal weighted combination of ROI-to-SCAN RSFC patterns and the corresponding symptom scores. We then assessed the strength of these associations using Pearson correlation between the RSFC-derived PLS1 scores and the clinical PLS1 scores for each symptom domain. To examine whether different symptom domains were associated with distinct subcortical connectivity profiles, we further calculated Spearman correlation between the PLS loadings (that is, weights of the six subcortical ROIs) derived from each symptom-specific model. The PLS analysis for MDS-UPDRS-III was replicated in the independent pretreatment data from the TMS dataset.
Winner-takes-all parcellation of subcortical structures
We followed a previously established winner-takes-all approach to parcellate subcortical structures that are important in PD into multiple functional networks corresponding to the large-scale cortical functional networks51,117,118. Specifically, we included the SN, STN, thalamus, GPi, GPe and striatum as delineated in the HybraPD atlas112. For each given voxel within these subcortical structures, we regressed out the average BOLD signals across cortical vertices within a 20-mm radius, thereby mitigating signal bleeding from adjacent cortical areas51. The functional connectivity between each subcortical voxel and all cortical networks of interest was then calculated. Each voxel, of which the functional connectivity with any network was significantly positive (one-sample t-tests, P < 0.05, uncorrected), was assigned to the functional network with the strongest connectivity. We performed an analysis using 11 functional networks, including the SCAN and 10 canonical functional networks51: the foot, hand, mouth, visual (VIS), action mode (AMN)36, dorsal attention (DAN), ventral attention (VAN), default mode (DMN)119, frontoparietal (FPN)120 and salience (SAL)121 networks. A Wilcoxon signed-rank test was performed to compare proportions of volume between the SCAN and effector-specific networks across six subcortical structures. To compare the proportions of voxels belonging to SCAN territory within six subcortical structures in patients versus control individuals, we conducted χ2 tests for 11-network parcellations, FDR correcting for the six tests conducted.
Cortical evoked potential analyses
In the DBS-ECoG dataset, stimulation onsets were determined by identifying the initial time-bin with the largest voltage deflection in a channel exhibiting a significant stimulation artifact. Subsequently, the remaining ECoG channels were synchronized to these stimulation onsets, with each stimulation defining a trial. To filter out low-frequency fluctuations and avoid introducing filter artifacts, the raw voltage values for each trial were detrended by subtracting an eighth-order polynomial fit of the signal. For 1 Hz stimulation, 30 trials within each session were averaged for each channel and subsequently smoothed with a 5-bin (0.17 ms) moving window122. We then measured the amplitude and latency of positive voltage peak deflections after stimulation. To assess the antidromic activation of the hyperdirect pathway between the STN and cortex48, we identified the cortical evoked potential 1 (P1) according to the previously reported approach48. Specifically, P1 was defined as the first positive voltage peak deflection occurring between 2 and 10 ms after stimulation onset, thereby excluding transcortical motor evoked potentials mediated by excitation of the corticospinal tract (<2 ms) and orthodromic activation through basal ganglia–thalamocortical pathways (> 2 ms).
We applied a two-step procedure to screen out ECoG electrodes of interest from 1,721 available ECoG electrodes and 9,147 voltage–time traces (Supplementary Fig. 9). First, we excluded electrodes without a well-defined P1 value. Second, it was observed that stimulation of the posterior-lateral STN yielded significantly higher evoked potential voltages in cortical areas proximal to the central sulcus48. We screened the most motor-related stimulation sites, following a procedure used in a previous report48. Specifically, we defined a one-dimensional STN axis using two points: the centre of the STN associative subregion (MNI coordinates = [−10.4, −11.7, −7.6] mm) and the centre of the STN motor subregion (MNI coordinates = [−12.6, −15.0, −7.1] mm). All STN stimulation sites were projected onto this axis, and the most posterior-lateral sites (at the 50th percentile) were selected (Supplementary Fig. 9a). The screening procedure resulted in 1,174 unique ECoG electrodes and 2,160 traces (Supplementary Fig. 9b). The trace with the largest P1 was selected for each electrode from multiple corresponding traces stimulated using different parameter sets, including the stimulation site, frequency and intensity. To focus on M1 responses, we retained electrodes within the precentral gyrus label of the DKT atlas123 only, yielding 284 electrodes—118 located in cortical SCAN regions and 166 in the mouth effector network (Supplementary Fig. 9b). For visualization of evoked traces, a zero-phase low-pass filter with a 2 kHz cut-off was applied to each mean voltage–time trace.
The probability distribution of the most responsive electrodes in the SCAN and mouth networks was examined using two-tailed χ2 tests, with responsiveness thresholds ranging from the top 5% to 50% (Supplementary Fig. 9c). The P1 amplitudes of the most responsive electrodes in the SCAN and effector networks were compared using two-tailed independent sample t-tests. Furthermore, cluster-based permutation tests were performed to examine the differences in evoked traces between the two networks (Supplementary Fig. 9d), with multiple comparisons corrected at the cluster level. An alpha of 0.05 was defined as a cluster-building threshold, and 1,024 permutations were performed124.
DBS electrode localization and VTA estimation
DBS electrode localization and VTA estimation were performed using the LEAD-DBS software103. Presurgical T1w MRI scans and post-surgical CT images were co-registered through linear registration to localize the electrodes according to a previously reported procedure125. Both CT and presurgical T1-weighted images were subsequently normalized to the MNI ICBM152 non-linear 2009b template using ANTs. Semi-automated identification of DBS electrode contacts was then performed on normalized CT images. The DBS electrodes from all 14 patients were reconstructed in MNI space103.
Estimation of the VTA was performed according to a previously established procedure126. This process entailed generating a tetrahedral volume mesh based on the surface mesh of DBS contacts and subcortical regions using the Iso2Mesh toolbox within the LEAD-DBS software. Different regions were modelled as containing electrode materials, grey matter or white matter, with assigned conductivity values of 0.33 S m−1 and 0.14 S m−1, respectively. For platinum/iridium contacts and insulated electrode segments, values of 108 S m−1 and 10,216 S m−1 were used, respectively. Using the volume conductor model, the potential distribution stemming from DBS was simulated through the integration of the FieldTrip-SimBio pipeline. The applied voltage to active electrode contacts served as a boundary condition. Subsequently, the gradient of the potential distribution was computed through finite element method (FEM) derivation. The resulting gradient, being piecewise continuous due to the application of first-order FEM, was thresholded for magnitudes surpassing the commonly used threshold of 0.2 V mm−1. This delineated the extent and configuration of the VTA. To confirm that DBS stimulation site targeted appropriate locations, we examined the spatial overlapping, measured by Dice coefficient, between the VTA overlap across patients and the STN sweet spot from the DBS-SS dataset39.
Patient-specific targeting procedure for TMS
Patient-specific TMS targets were generated based on personalized functional network mapping using pretreatment rsfMRI data from each participant127, according to the procedure described in our previous reports101,128,129. First, the personalized SCAN and effector-specific motor regions were identified using the aforementioned personalized functional parcellation approach. Second, taking TMS accessibility into account, we restricted the candidate target searching area for each network in the precentral gyrus through excluding sulcal vertices and vertices in the medial surface. Third, we identified personalized targets in the candidate searching area based on the highest confidence value of the network parcellation. The confidence value of each vertex was estimated by ratio of the strongest and the second strongest correlation coefficient with all functional networks, indicating the likelihood of the vertex belonging to the assigned network. The automatically generated targets were visually inspected based on the anatomical locations and their RSFC patterns by two authors (J.R. and W.Z.), who were blinded to the group allocations.
TMS was delivered using a figure-of-eight coil. A real-time neuronavigation system incorporated in the TMS system was used throughout the procedure to ensure positioning accuracy. This system continuously monitored the positions of both the participant and the coil, and the TMS operator maintained coil positioning accuracy based on the real-time feedback. In practice, the distance between the coil centre and the cortical target was consistently maintained within 3 mm, and the angular deviation between the coil plane and the optimal tangential plane was kept within 3°. For orientation, a line normal to the longitudinal fissure within the coil plane was used as the reference axis, and the coil was rotated 45° around its normal130.
LME models in DBS-fMRI and TMS analyses
To take advantage of the longitudinal DBS-fMRI dataset with multiple follow-up timepoints for each participant, we used three LME models to evaluate the DBS long-term effects on motor symptoms and RSFC. The UPDRS-III score served as the dependent variable, with follow-up timepoints (from preoperative to 1-, 3-, 6- and 12-month postoperative assessments) defined as a fixed effect, and participant identity as a random effect. Post hoc pairwise t-tests were conducted to compare the preoperative scores and the postoperative scores. Similarly, an LME model was applied to the RSFC of the SCAN circuit. Moreover, an LME model was used to investigate the relationship between changes in clinical outcomes and STN-SCAN RSFC across different follow-up visits. The dependent variable was the observed change rate in UPDRS-III scores, while the fixed effects included the change rate of STN-SCAN RSFC and the follow-up timepoints; participant was also considered as a random effect.
In the TMS study, the rTMS effect on motor symptoms or RSFC was evaluated among participants who had at least one post-treatment assessment131. An LME model was used to assess the effects on motor symptoms of different stimulation targets on score changes across all clinical assessments, including the MDS-UPDRS-III total scores (Fig. 5b) and four subdomains of motor symptoms (Extended Data Fig. 8). Fixed effects included stimulation target group (SCAN or effector), time of assessment (baseline, week 1, week 2), and their interaction, with disease duration, levodopa equivalent dose (LEDD) and baseline Hoehn–Yahr staging as covariates. Participant identification was the random effect. Similarly, an LME model was used to evaluate the changes in RSFC of the SCAN circuit.
Distance analysis of aDBS cortical electrodes
To investigate the spatial relationship between cortical electrodes of aDBS and the cortical SCAN nodes, we compared the distances from the cortical electrodes to the centres of the superior SCAN node with the distance from the electrodes to the hand and foot regions. The centre position for each network in each hemisphere was determined based on the group-averaged centre coordinates of personalized functional networks across 166 patients with PD from the PIPD dataset. In the six hemispheres from four patients, four cortical electrode pairs in four hemispheres from three patients (patient 1, 3 and 4) were eventually selected for adaptive stimulation28. We then calculated the Euclidean distances from each cortical electrode pair to the corresponding hemispheric network centres and averaged the distances across the electrode pairs.
MRgFUS target distance estimation
To determine the theoretically optimal target within the thalamus using SCAN functional connectivity, we used a cluster-based strategy, which was adapted from a method previously used to identify individualized rTMS targets in the dorsolateral prefrontal cortex for depression132 and in the superior frontal gyrus for post-stroke aphasia101. We specifically identified contiguous thalamic voxel clusters that exhibited the highest connectivity correlation with the SCAN regions. The centre of gravity of the largest such cluster was determined as the optimal target coordinate. We quantified the Euclidean distance between this optimal target coordinate and the actual target coordinate, which was determined by the centre of gravity of each patient’s lesion. Moreover, as part of our control analyses, this method was applied to other effector-specific networks including the foot, hand and mouth networks, as well as a combination of the three networks. We calculated the Spearman correlation between MDS-UPDRS-III scores changes (before − after) and the Euclidean distance between the SCAN-based optimal target and the actual target. Spearman correlations were also calculated using the distance between the optimal target based on foot, hand and mouth networks or a combination of all effector-specific networks.
Reporting summary
Further information on research design is available in the Nature Portfolio Reporting Summary linked to this article.