
Psilocybin induces emergence of high-frequency oscillations in infralimbic cortical LFP
We chronically implanted Neuropixels probes to record neural activity across the medial prefrontal cortex (mPFC) of freely-behaving rats. Rats performed an operant task in which nose-pokes were rewarded in 15 min blocks (task blocks) interleaved with 15 min, reward-free blocks of resting behaviour (rest blocks; Fig. 1A, Supplementary Fig. 1). Neither 0.3 mg/kg psilocybin, 1 mg/kg psilocybin, nor saline significantly altered movement or behavior based on video tracking or task performance. There was also no evidence of sleep during these recording periods based on local field potentials (LFP). Drug effects on neurophysiology were therefore unlikely to be confounded by modulation of global arousal state, though we cannot rule out subtle changes potentially discernible using other measures.
Fig. 1: Psilocybin induces frequency-dependent changes in oscillations in medial prefrontal cortical local field potentials (LFP).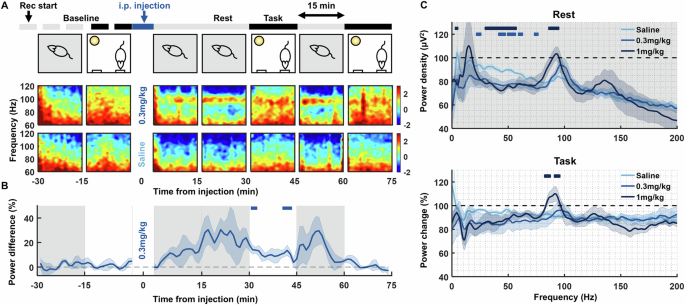
A LFP spectrograms from a single recording channel in the infralimbic cortex of one rat, aligned to rest and operant task 15 min epochs pre- and post-injection of 0.3 mg/kg psilocybin (top row spectrograms) and saline (bottom row). Note the sustained power around 100 Hz during the rest block after injection of 0.3 mg/kg psilocybin. B Average time course of ~100 Hz high frequency oscillation 1/f power difference at baseline and post-injection, shown as a difference in power between 0.3 mg/kg psilocybin and saline. Grey shaded and white backgrounds delineate rest and operant task blocks respectively. Bars above trace mark times of significant difference to saline (partial-Bonferroni corrected post-hoc t-tests, p < 0.05, N = 4). C Average change in power density during the rest (top) and task (bottom) blocks from baseline (rest: average from −30 min to −15 min pre-injection, task: from −15 min to 0 min) to post injection (rest: average from 15–30 min and 45–60 min post-injection, task: from 30–45 min and 60–75 min) of saline (N = 4), 0.3 mg/kg psilocybin (N = 5) and 1 mg/kg psilocybin (N = 4). Bars above power change spectra represent significant differences to saline for 0.3 mg/kg psilocybin (lighter blue) and 1 mg/kg (darker blue; partial-Bonferroni corrected post-hoc t-tests, p < 0.05).
0.3 mg/kg psilocybin unmasked a sustained ~100 Hz high frequency oscillation (HFO) in infralimbic cortex LFP, evident during both task and rest periods (Fig. 1A). HFO power peaked 15–30 min and lasted at least 60 min post-injection (Fig. 1B; RM-ANOVA: drug: F(1,6) = 5.74, p = 0.054, time: F(104,624) = 5.26, p < 0.001, drug x time: F(104,624) = 2.63, p < 0.001). Power spectra revealed a broadband decrease in power after 0.3 mg/kg psilocybin, except at ~100 Hz. This effect was most prominent during rest blocks (Fig. 1C; Supplementary Fig. 3). Psilocybin also led to significantly decreased 20–80 Hz power compared to saline (ANOVA2 rest blocks: drug: F(2,8010) = 67.04, p < 0.001, frequency: F(800,8010) = 7.94, p < 0.001; drug x frequency: F(1600,8010) = 0.77, p = 1.000). 1 mg/kg psilocybin induced similar changes, albeit with a slowing in the peak of the HFO to ~93 Hz (Fig. 1C).
Psilocybin-induced HFO centered on the infralimbic cortex
To determine the anatomical topography of the HFO, spectral power was calculated during post-psilocybin rest blocks across all Neuropixels channels (Fig. 2A). Mapping the 1/f power difference at 80–110 Hz (Fig. 2B) to the histological verification of the Neuropixels placement revealed a continuum of HFO power that was maximal within the infralimbic cortex (Fig. 2C, D). In Rat 1, the probe bypassed the infralimbic cortex; there was no increase in the HFO power discernible in this rat. The strongest increases in HFO power were clearly identified when the probe spanned deeper layers of the cortex (Rats 3, 4, 6 with the probe in layers III, V, VI). In addition to main effects of distance along the probe (β = 0.01, SE = 0.01, t = 2.53, p = 0.011, generalised linear model using a log-linked inverse gaussian distribution) and drug (β = 0.20, SE = 0.01, t = 32.07, p < 0.001), a significant interaction was also identified between distance and drug condition on HFO 1/f power difference (β = −0.05, SE = 0.01, t = −20.95, p < 0.001; Fig. 2D).
Fig. 2: Sustained 80–110 Hz oscillations (HFO) following psilocybin are most pronounced in infralimbic cortex.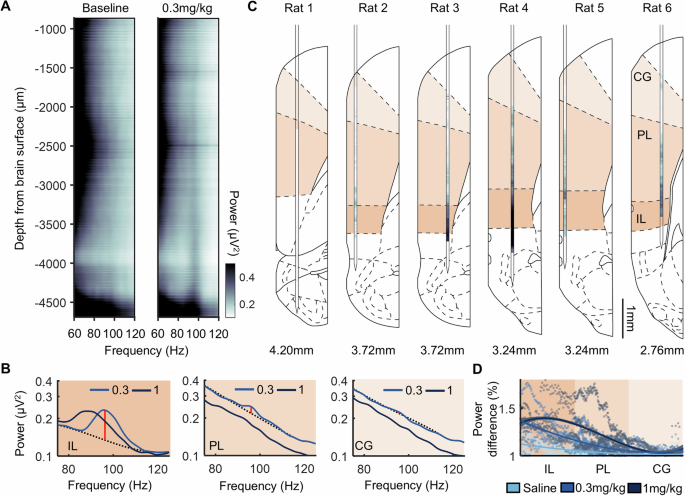
A LFP power between 60–120 Hz across all electrode channels spanning the medial prefrontal cortex of one rat, averaged across the 15 min rest period pre- (left) and post- (right) injection of 0.3 mg/kg psilocybin. B Power density from an LFP channel in the cingulate cortex (CG; top), prelimbic cortex (PL, middle) and infralimbic cortex (IL, bottom) during post-injection of 0.3 mg/kg and 1 mg/kg psilocybin. Dotted line denotes interpolated signal. Red line denotes HFO 1/f power difference between raw and interpolated signal. C HFO 1/f power difference across all recorded channels for each rat. Darker hues indicate greater difference in HFO power. Value below denotes anterior-posterior stereotaxic coordinate of the probe placement based on post-mortem reconstruction (N = 6). D HFO 1/f power difference from all LFP electrodes in all rats as a function of their estimated dorsal-ventral location within the prefrontal cortex. Locations were normalised according to the size of each of the three regions assessed. Plot shows data from individual electrodes (dots) and polynomial fits (curves) for each drug condition with shaded areas depicting 95% prediction intervals (N = 6).
Psilocybin leads to an overall decrease in cell firing rates
Spike-sorting identified a median of 280 (between 66–669) stable single units per animal during each single ~2 h recording session, with similar numbers of units detected in each drug condition (Supplementary Fig. 4A). 0.3 mg/kg psilocybin significantly decreased RS-cell firing rates within the prelimbic cortex compared to saline. This effect was specific to rest blocks and not apparent when the animal was actively engaged in the task (Fig. 3A), or in cingulate or infralimbic cortex. In contrast, 1 mg/kg psilocybin led to a significant decrease in firing rates in all three brain areas, during both rest and task blocks (Infralimbic: SRH: Drug: H(2,47460) = 245.81, p < 0.001, Time: H(104,47460) = 553.96, p < 0.001, Drug x Time: H(208,47460) = 425.11, p < 0.001; Wilcoxon: p < 0.05 (at 1 mg/kg only); Prelimbic: SRH: Drug: H(2,174510) = 779.20, p < 0.001, Time: H(104,174510) = 954.46, p < 0.001, Drug x Time: H(208,174510) = 583.07, p < 0.001; Wilcoxon: p < 0.05 (at 0.3 m/kg and 1 mg/kg); Cingulate: SRH: Drug: H(2,22575) = 452.03, p < 0.001, Time: H(104,22575) = 99.65, p = 0.603, Drug x Time: H(208,22575) = 309.08, p < 0.001; Wilcoxon: p < 0.05 (at 1 mg/kg only)). Psilocybin did not induce any significant changes in NS-cell firing rates across time or conditions (Supplementary Fig. 4B).
Fig. 3: Psilocybin leads to a dose dependent net decrease in RS-cell firing rates that differs across brain regions and behavioural state.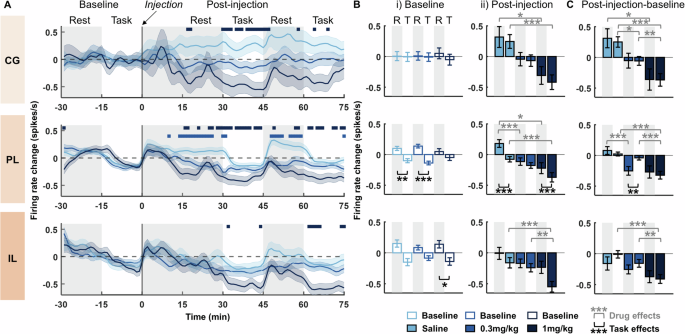
A Time-course of change in firing rates of RS-cells in the cingulate cortex (CG; top), prelimbic cortex (PL; middle) and infralimbic cortex (IL; bottom) relative to pre-injection baseline (injection at time 0). Firing rates are shown as a difference from the average firing rates during the 30 min pre-injection baseline. Bars above the rate change indicate significant differences of 0.3 mg/kg (light blue) and 1 mg/kg (dark blue) versus saline vehicle injection (post-hoc Bonferroni corrected Wilcoxon rank sum test: p < 0.05). Grey shaded and white backgrounds delineate rest and operant task blocks respectively (N = 4). B Average change in firing rates during rest (R) and task (T) blocks for RS-cells within the CG (top row), PL (middle row) and IL (bottom row). (i) average firing rate change during individual 15 min rest and task blocks at baseline (shown as a difference from average firing rate across the whole 30 min baseline period). (ii) average firing rate change from baseline to post-injection (N = 4). C Difference in firing rate change between post-injection blocks (shown in Bii) and baseline blocks (shown in Bi), calculated separately for rest (post injection rest – baseline rest) and task (post-injection task – baseline task; N = 4). Asterisks denote significant post-hoc Bonferroni corrected Wilcoxon rank sum or signed rank differences between rest and task blocks (signed rank; black) or between drugs (rank sum; grey): ***p < 0.001, **p < 0.01, *p < 0.05. Shaded bands in A and error bars in B, C denote SEM.
Prelimbic and infralimbic cortical RS-cell firing rates were significantly higher during rest blocks compared to task blocks during baseline conditions (Fig. 3Bi). This behavioral modulation of firing rates was not evident in cingulate cortex, and there were no baseline differences in any brain region across drug conditions (SRH: Cingulate: Task: H(1,430) = 0.33, p = 0.568; Drug: H(2430) = 0, p = 1.00; Task x Drug: H(2430) = 0.41, p = 0.815; Prelimbic: Task: H(1,3324) = 75.80, p < 0.001; Drug: H(2,3324) = 0, p = 1.00; Task x Drug: H(2,3324) = 13.04, p = 0.002; Infralimbic: Task: H(1904) = 21.68, p < 0.001; Drug: H(2904) = 0, p = 1.00; Task x Drug: H(2904) = 2.94, p = 0.230; Wilcoxon: p < 0.05). The prelimbic difference between task and rest blocks remained significant post-injection of both saline and 1 mg/kg psilocybin but was diminished after 0.3 mg/kg psilocybin (Fig. 3Bii). All three brain regions showed a significant main effect of drug condition, post-injection (SRH: Cingulate: Task: H(1,430) = 0.30, p = 0.583; Drug: H(2430) = 23.74, p < 0.001; Task x Drug: H(2430) = 0.79, p = 0.674; Prelimbic: Task: H(1,3324) = 9.99, p = 0.002; Drug: H(2,3324) = 34.68, p < 0.001; Task x Drug: H(2,3324) = 3.98, p = 0.137; Infralimbic: Task: H(1904) = 3.71, p = 0.054; Drug: H(2904) = 24.10, p < 0.001; Task x Drug: H(2904) = 1.57, p = 0.456; Wilcoxon: p < 0.05).
A comparison of the scale of change in firing rates from baseline to post-injection revealed significantly greater change in firing rates during rest blocks, compared to task blocks, after 0.3 mg/kg psilocybin within the prelimbic cortex (Fig. 3C). This suggests the diminished differences between rest vs. task firing rates after 0.3 mg/kg psilocybin are driven by greater decreases in firing rates during rest blocks. Again, all three brain regions showed a significant main effect of drug condition (SRH: Cingulate: Task: H(1430) = 0. 30, p = 0.87; Drug: H(2430) = 32.91, p < 0.001; Task x Drug: H(2,430) = 1.97, p = 0.373; Prelimbic: Task: H(1,3324) = 2.32, p = 0.128; Drug: H(2,3324) = 40.91, p < 0.001; Task x Drug: H(2,3324) = 18.54, p < 0.001; Infralimbic: Task: H(1904) = 0.02, p = 0.890; Drug: H(2904) = 27.56, p < 0.001; Task x Drug: H(2904) = 1.04, p = 0.594; Wilcoxon: p < 0.05).
Population-level averages masked heterogenous changes in the firing rates of individual RS- and NS-cells across injection conditions (Fig. 4A). To detail this heterogeneity, we next compared the proportion of RS- and NS-cells across regions that showed significant changes in firing rates pre- to post-injection, revealing a significantly higher proportion of RS-cells within the infralimbic and prelimbic cortex that had either decreased or no change in firing rates post-injection of 0.3 mg/kg psilocybin, compared to saline (Fig. 4B; chisq: saline vs 0.3 mg vs 1 mg; infralimbic decrease: X2 = 11.98, p = 0.003; infralimbic no change: X2 = 10.13, p = 0.006; infralimbic increase: X2 = 10.03, p = 0.007; prelimbic decrease: X2 = 26.05, p < 0.001; prelimbic no change: X2 = 18.61, p < 0.001; prelimbic increase: X2 = 8.60, p = 0.014; post-hoc chisq, p < 0.05). There were no differences in the proportion of cells changing firing rates in the cingulate cortex between 0.3 mg/kg psilocybin and saline (chisq: saline vs 0.3 mg vs 1 mg; cingulate decrease: X2 = 11.88, p = 0.003; cingulate no change: X2 = 2.17, p = 0.338; cingulate increase: X2 = 7.94, p = 0.019; post-hoc chisq, p > 0.05). Following 1 mg/kg psilocybin, the proportion of cells with decreased post-injection firing rates was significantly higher in all three brain regions, in comparison to saline (post-hoc chisq, p < 0.05).
Fig. 4: RS-cells and NS-cells of the medial prefrontal cortex respond to systemic psilocybin with heterogeneous changes in firing rate.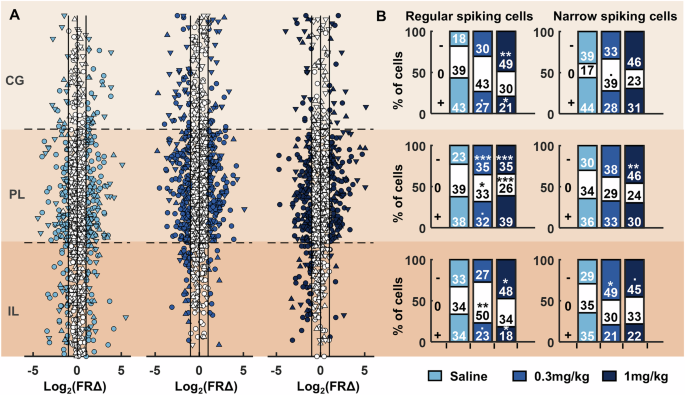
A Individual cell firing rate changes during pre- to post-injection rest blocks sorted according to estimated dorsal-ventral location within the prefrontal cortex. Each of the three brain regions (IL, PL, CG) were normalised in size with approximate location of each cell determined by proximity to electrodes along the probe. Cells coloured in white showed either less than a twofold change in firing rates, or the change did not reach significance. Distributions are shown separately for saline (left), 0.3 mg/kg psilocybin (middle) and 1 mg/kg psilocybin (right). Circles denote RS-cells, triangles pointing up denote NS-cells, triangles pointing down denote WS-cells. B Proportion of RS-cells (left) and NS-cells (right) showing a significant decrease (−), increase (+) or no change (0) from baseline to post-injection of psilocybin or saline within each brain region during rest blocks (N = 4). Asterisks denote significant post-hoc chi-squared test differences in the proportion of cells between saline and 0.3 mg/kg or 1 mg/kg psilocybin; ***p < 0.001, **p < 0.01, *p < 0.05, •p < 0.05 but did not survive Bonferroni multiple comparison correction.
In general, a greater proportion of NS-cells decreased firing rate in both infralimbic and prelimbic cortices, but this only reached significance in the infralimbic cortex at 0.3 mg/kg psilocybin and in the prelimbic cortex at 1 mg/kg psilocybin in comparison to saline, after controlling for multiple testing (chisq saline vs 0.3 mg vs 1 mg; infralimbic decrease: X2 = 7.15, p = 0.028; infralimbic no change: X2 = 0.43, p = 0.808; infralimbic increase: X2 = 5.08, p = 0.079; prelimbic decrease: X2 = 8.72, p = 0.013; prelimbic no change: X2 = 4.47, p = 0.107; prelimbic increase: X2 = 1.03, p = 0.598; cingulate decrease: X2 = 1.57, p = 0.456; cingulate no change: X2 = 6.12, p = 0.047; cingulate increase: X2 = 2.91, p = 0.233; post-hoc chisq, p < 0.05).
Psilocybin reduces the complexity of mPFC network activity
To quantify mPFC network dynamics, time-binned spikes from all units were binarized and the mean-squared displacement (MSD) was calculated to describe the scale of network state transition across time (Fig. 5A). This analysis revealed a significant increase in MSD from pre- to post- injection of saline, in contrast to a significant, dose-dependent decrease after psilocybin (Fig. 5B, C; KW: Rest blocks: saline: X2(1,359598) = 3357.1 p < 0.001, 0.3 mg/kg: X2(1,359598) = 46604.58 p < 0.001, 1 mg/kg: X2(1,359598) = 26416.76 p < 0.001). Consistent with LFP and firing rate analyses, psilocybin’s effects were larger during rest periods (Cohen’s d, Rest blocks: saline vs 0.3 mg/kg: d = 1.04, saline vs 1 mg/kg: d = 0.81) than task periods (Task blocks: saline vs 0.3 mg/kg: d = 0.27, saline vs 1 mg/kg: d = 0.54).
Fig. 5: Psilocybin leads to decreased mean square displacement (MSD) of neural spiking activity and decreased Lempel-Ziv complexity (LZC).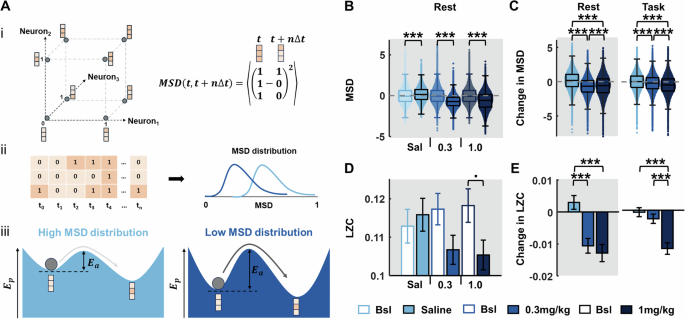
A The spiking activities of recorded single units in the mPFC can be used to describe the binary state transitions of a representative network of the units: (i, left) An example three-neuron network is shown, with possible states visualised as the vertices of a unit cube. The possible 3-bit binary states, where 0 (light-orange) represents no spikes in the time bin, and 1 (dark-orange) represents spiking. The axes represent the binary values of the individual neurons. The neural network (dark-grey ball) transitions from one state to another with time. (i, right) The MSD is a Euclidean jump distance between any two network states over a discrete time-step ∆t. (ii) The temporal dynamics of the network are shown as consecutive 3-bit states at discrete time points, t1 to tn. At every time point, an average MSD of the network transitions over the next 1 s is computed, giving a distribution of MSDs characterising network transitions across the entire time duration. MSD distributions centred on lower values reflect restricted state transitions, while higher values indicate relatively free network state transitions. (iii) Schematic descriptions of the potential energy landscapes, Ep, for the low and high MSD distributions are shown. Shallower landscapes (left) require less activation energy leading to more frequent state transitions (light grey arrow) and a high MSD distribution. Network states sitting in a deep basin of attraction (right) requires larger activation energy, Ea, to jump to neighbouring states, causing less-frequent transitions (dark grey arrow) and low MSD distribution. B MSD from all single units across pre- and post-injection rest blocks for each drug condition, indicating a decrease in MSD under psilocybin. C Change in MSD from pre- to post-injection rest blocks (left) and task blocks (right), across drug conditions, indicating a dose-dependent decrease in MSD with psilocybin. D LZC from all single units across pre- and post-injection rest blocks for each drug condition. E Change in LZC from pre- to post-injection rest blocks (left) and task blocks (right), across drug conditions, indicating a decrease in LZ complexity with psilocybin (0.3 and 1 mg/kg) in both rest and task contexts. Error bars denote SEM (N = 4). Asterisks denote significant post-hoc t-test Bonferroni corrected differences between saline and 0.3 mg/kg or 1 mg/kg psilocybin; ***p < 0.001, •p < 0.05 but did not survive Bonferroni multiple comparison correction.
Less frequent network state transitions lead to lower entropy activity [42]. We therefore computed Lempel-Ziv complexity (LZC) as a measure of entropy in neural spiking [39]. While there were no significant differences pre- to post-saline, a significant decrease in LZC was observed after both 0.3 mg/kg and 1 mg/kg psilocybin (Fig. 5D; PT, one-tailed: saline: p = 0.3131, 0.3 mg/kg: p = 0.0280, 1 mg/kg: p = 0.0148; PT, two-tailed: saline: p = 0.6260, 0.3 mg/kg: p = 0.0595, 1 mg/kg: p = 0.0304). Pair-wise subtracting the units’ LZC values during the pre-drug rest/task blocks from values during the post-drug rest/task blocks showed that 0.3 mg/kg psilocybin led to a significant decrease in complexity compared to saline during rest, but not task blocks (Independent 2-sample t-test: rest p < 0.001, task p = 0.3096). 1 mg/kg psilocybin led to a significant decrease in complexity compared to saline during both rest and task blocks (Fig. 5E; Independent 2-sample t-test: rest p < 0.001, task p < 0.001). Collectively, these results suggest that psilocybin leads to more ordered and less chaotic mPFC activity, by deepening the underlying energy landscape of mPFC dynamics, hence restricting wide and frequent network state transitions.
Long-term effects of psilocybin on coordinated oscillations in the infralimbic cortex
To identify potential long-term effects of low-dose psilocybin, recordings on Day 0 were compared with drug-free activity on post-injection days 1, 2 and 6. The post-injection infralimbic HFO was an acute effect of psilocybin and absent from day 1 onwards. However, across days there was a gradual increase in power between 20–60 Hz during both rest and task blocks (Fig. 6A, Supplementary Fig. 5; ANOVA2: Rest Day 6: Frequency: F(800,4806) = 7.4, p < 0.001; Drug: F(1,4806) = 177, p < 0.001; Frequency x Drug: F(800,4806) = 1.24, p < 0.001; Task Day 6: Frequency: F(800,4806) = 0.48, p = 1.000; Drug: F(1,4806) = 28.94, p < 0.001; Frequency x Drug: F(800,4806) = 1.31, p < 0.001). This psilocybin-induced evolution of 20–60 Hz power across days was not evident for LFPs in the prelimbic or cingulate cortices (Supplementary Fig. 6).
Fig. 6: A single injection of psilocybin induces long-term changes in LFP power in infralimbic cortex across 6 days post-injection.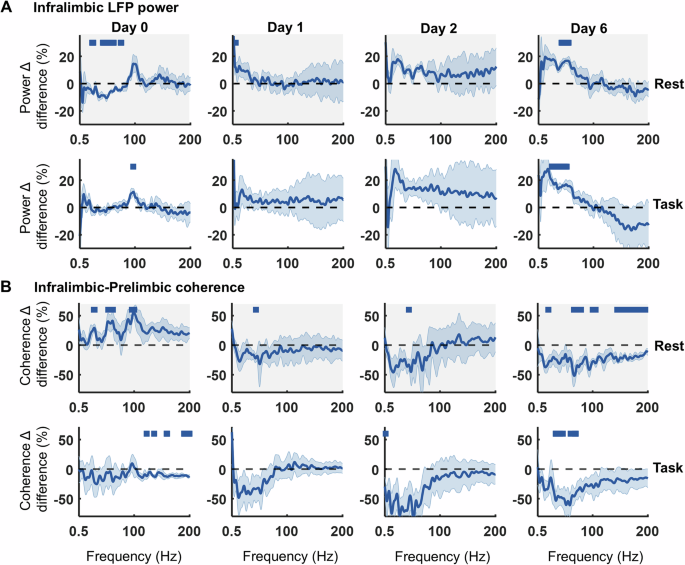
A Difference between 0.3 mg/kg psilocybin in comparison to saline in the change in power density from baseline to post injection during rest (top, grey) and task (bottom, white) blocks, on the day of injection (Day 0) and subsequent days 1, 2 and 6 (all compared to day 0 baseline, N = 4). B Difference between 0.3 mg/kg psilocybin in comparison to saline in the change in infralimbic-prelimbic coherence from baseline to post injection across days during rest (top, grey) and task (bottom, white) blocks (all compared to day 0 baseline, N = 4). Bars indicate significant differences between 0.3 mg/kg psilocybin and saline (partial-Bonferroni corrected post-hoc t-tests, p < 0.05). Shaded bands denote SEM.
On Day 0, a broad increase in coherence between pairs of LFP channels was identified across all frequencies following 0.3 mg/kg psilocybin during rest blocks but a significant decrease in coherence >100 Hz during task blocks (Fig. 6B, shown for IL-PL, with similar findings for IL-CG and PL-CG; ANOVA2: IL-PL, Rest Day 0: Frequency: F(800,4806) = 7.86, p < 0.001; Drug: F(1,4806) = 2176.07, p < 0.001; Frequency x Drug: F(800,4806) = 0.73, p = 1.000; IL-PL, Task Day 0: Frequency: F(800,4806) = 1.05, p = 0.186; Drug: F(1,4806) = 427.64, p < 0.001; Frequency x Drug: F(800,4806) = 0.28, p = 1.000). Similar results were found for both power and coherence at 1 mg/kg dose of psilocybin in comparison to saline (Supplementary Fig. 7). These coherence patterns evolved across Days 1–6, gradually decreasing at frequencies below 100 Hz and culminating in a broadband decrease in coherence by day 6 (Fig. 6B, shown for IL-PL LFPs; ANOVA2: Rest Day 6: Frequency: F(800,4806) = 2.38, p < 0.001; Drug: F(1,4806) = 1744.14, p < 0.001; Frequency x Drug: F(800,4806) = 0.34, p = 1.000; Task Day 6: Frequency: F(800,4806) = 0.61, p = 1.000; Drug: F(1,4806) = 1809.94, p < 0.001; Frequency x Drug: F(800,4806) = 0.59, p = 1.000; ANOVA2 results for day 1 and 2 can be found in Supplementary Table 1).