
Search results and study characteristics
The initial search yielded 2,633 studies from PubMed and 3,637 studies from MEDLINE (Ovid); After removing duplicates and screening titles and abstracts, 29 full-text articles were reviewed for eligibility. Of these, 21 studies were excluded: Six were diagnostic, six were prognostic, four focused on symptomatic individuals, three did not develop multivariate risk models, and two did not predict EC incidence. An additional study was identified through a manual reference search. The study selection flow diagram is provided in Additional Fig. 1.
The nine studies (Additional File 3, Table S1) that met our eligibility criteria developed models to predict EC incidence in a population without cancer or cancer symptoms [29,30,31,32,33,34,35,36,37]. Four studies focused exclusively on epidemiological risk factors [29,30,31, 34]. The earliest model, developed by Pfeiffer et al. [29] in the United States (US), was followed by a similar model by Hüsing et al. [30], using data from ten European countries. In 2017, Fortner et al. [32] enhanced the Hüsing [30] model by incorporating serum biomarkers as additional predictors. In 2020, Hart et al. [31] used the same dataset as Pfeiffer et al. to propose machine learning (ML) algorithms for predicting EC risk. In 2020, several models began considering genetic markers, including single nucleotide polymorphisms (SNPs) [33, 35,36,37]. In 2023, Kitson et al. [34] proposed a new epidemiological model using data from the United Kingdom (UK). In the same year, Shi et al. [33] developed two models using a dataset which spanned the US, Alberta (Canada), Australia, and Europe. The details of the models are presented in Additional File 3, Table S2.
Datasets for model development
Most datasets used in model development included individuals at risk, with an intact uterus, who had not undergone a hysterectomy [29, 30, 32, 34, 36]. Additionally, the majority of datasets excluded individuals with pre-existing cancer, with Hüsing et al. [30] and Fortner et al. [32] including non-melanoma skin cancer [29, 30, 32, 34,35,36,37]. Additional exclusions included age restrictions [33, 34] as well as SNPs and genetic exclusion for some models [35,36,37]. In one case, exclusion criteria were not clearly outlined [31]. Models and datasets used in model development are summarized in Table 1 and detailed in Additional File 3, Tables S2 and S3, and visually depicted in Fig. 1.
Table 1 Summary of the development and validation datasets, and the performance of the included risk modelsFig. 1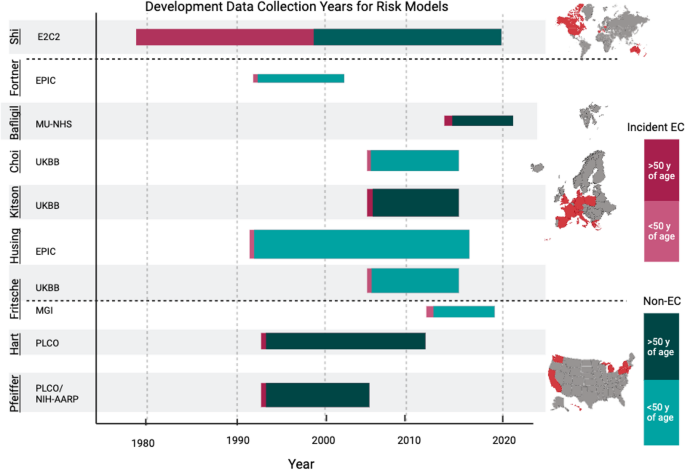
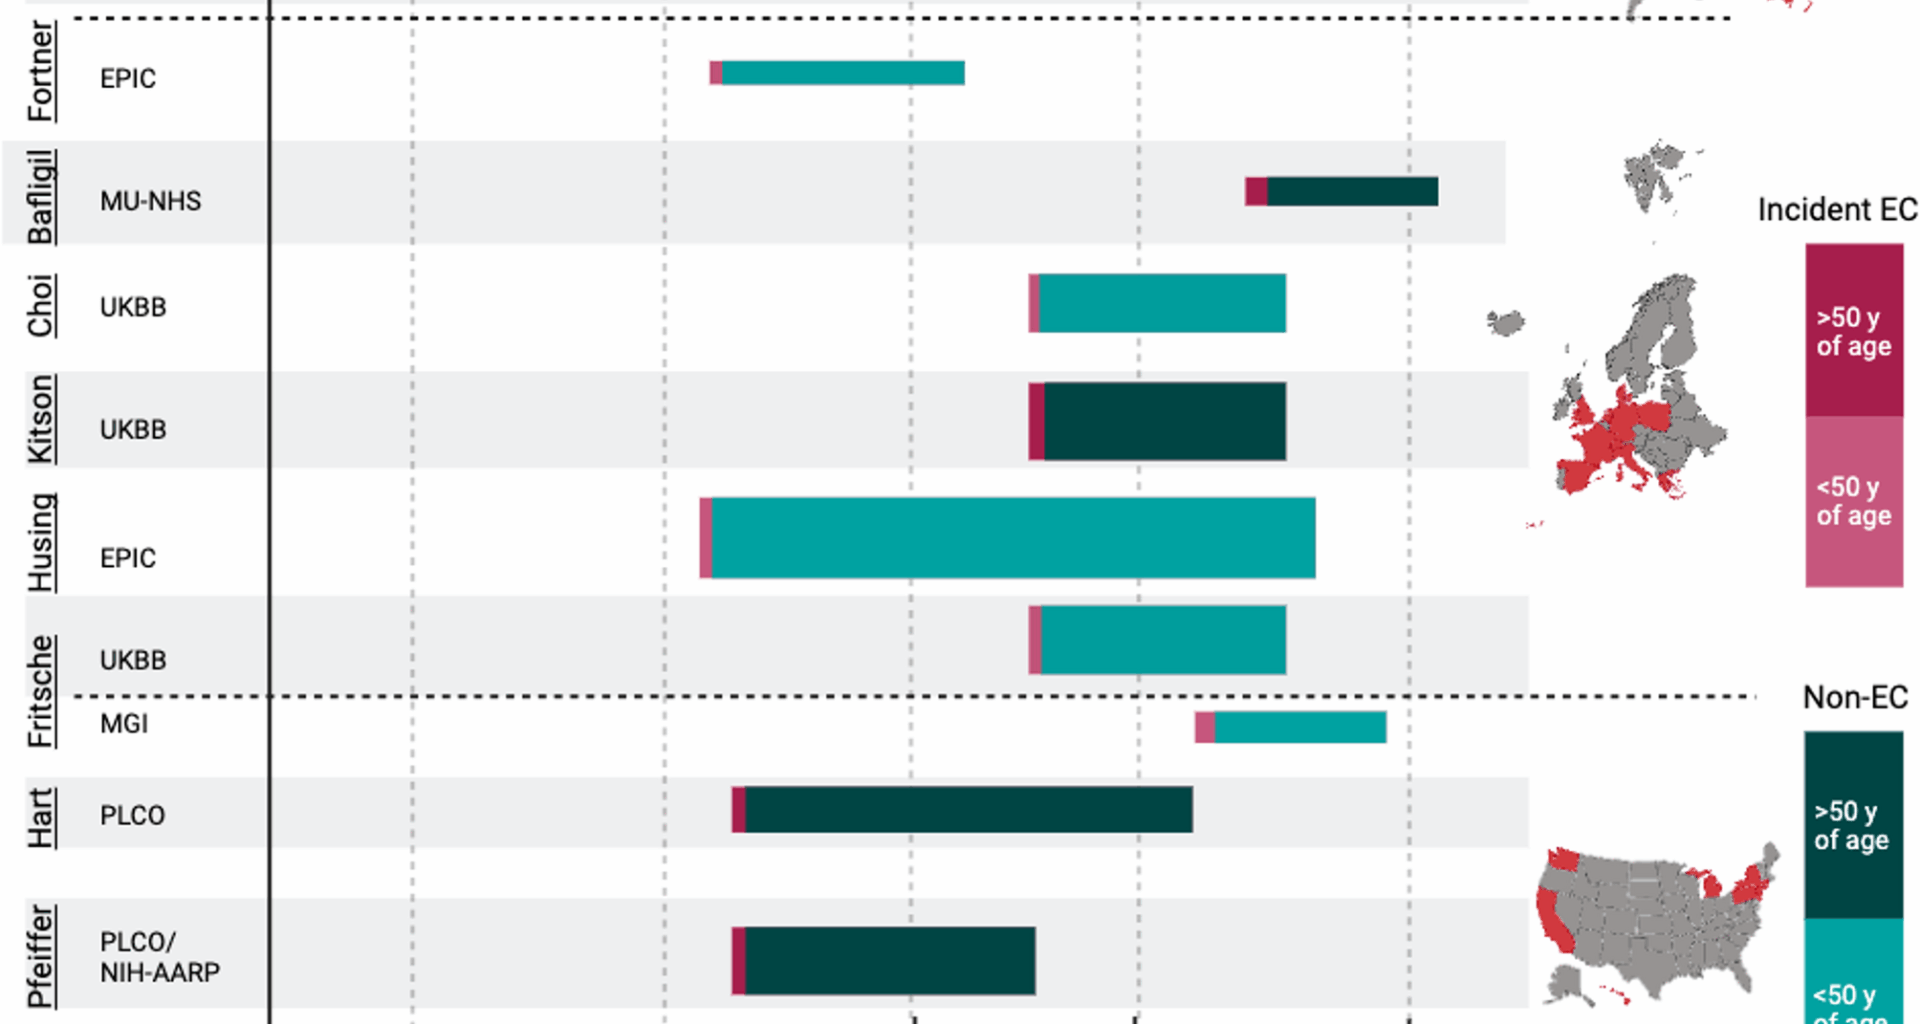
Development data collection years for each risk model by dataset. Graphical representation of the data collection span, from recruitment years to estimated follow-up, for each dataset used to develop the predictive risk models. The size of the bar represents the sample size of the dataset. The red portion represents the proportion of incident EC cases in the dataset, and green portion represents non-cases; darker red or green indicates an age range starting at or above 50 years, while lighter red or green indicates an age range starting below 50 years. Created with Biorender.com. Abbreviations: Prostate, Lung, Colorectal, Ovarian (PLCO) Cancer Screening Trial; National Institutes of Health – American Association of Retired Persons (NIH-AARP) Diet and Health Study; Michigan Genomics Initiative (MGI); United Kingdom Biobank (UKBB); European Prospective Investigation into Cancer (EPIC); Manchester University National Health Services (MU-NHS) Foundation Trust; Epidemiology of Endometrial Cancer Consortium (E2C2)
The models were predominantly developed in datasets from Western regions (US and Europe) with limited ethnic or racial diversity. Six of the nine models were based exclusively on data from people of White or European ancestry [29, 31, 33, 35,36,37]. Hüsing et al. [30] and Fortner et al. [32] did not report on ethnicity, while Kitson et al. [34] had a predominantly White population (94%). Shi et al. [33] used data from the Epidemiology of Endometrial Cancer Consortium (E2C2) database, which pooled data from regions including North America, Europe, China, and Australia [42]; however, their model development was restricted to White females from the US, Alberta (Canada), Australia, and Europe.
The study design and the age of the population significantly influenced the observed incidence rate of EC, which was the primary outcome in all studies. For example, Shi et al. [33] had the highest incidence of EC (42.4%), with a case-control design and only postmenopausal participants from the E2C2 dataset. Bafligil et al. [36] used MU-NHS (Manchester University National Health Services) dataset [43] which also followed a case-control design with a high proportion of EC cases (31.6%). Fortner et al. [32] used a select subset of the European Prospective Investigation into Cancer (EPIC) dataset [44] where blood collection data were available; they followed a case-control design (34.5% incident EC). In contrast, the Hüsing [30] model, which considered a broader set of the EPIC dataset [44], was predominantly composed of pre- or perimenopausal participants (60%) and reported significantly lower EC incidence (0.4%). Fritsche et al. [37] used case-control data from the Michigan Genomics Initiative (MGI) [45] (3.2% incident EC) and UK Biobank (UKBB) [46], which followed a prospective design (0.6% incident EC). The remaining datasets [46, 47] were all prospective in design, with incidence varying from 0.3% to 1.2%. A detailed description of the datasets is available in Additional File 3, Table S3.
Risk factors used in models
A diverse range of traditional epidemiological risk factors, novel biomarkers, and genetic factors were considered in model training. Some models also explored first-order interactions between risk factors [29, 30, 32,33,34]. The most frequently included predictors were body mass index (BMI), smoking status, and oral contraceptive (OC) use. Reproductive factors such as parity, menopausal status, age at menopause, and age at menarche were also considered, highlighting the role of reproductive history and hormonal influences in the etiology of EC. Recognizing that BMI may not fully capture obesity, several studies considered anthropomorphic variables such as weight and waist circumference [31, 34]. Hormonal exposures, like menopausal hormone therapy (MHT) (including both status and duration) and tamoxifen use, were often included [29, 30, 32,33,34]. Pfeiffer et al. and Hart et al. specified MHT as a combination of estrogen and progesterone therapy; Husing et al. and Kitson et al. did not indicate formulation, and Shi et al. used estrogen-only MHT. Co-morbidities, such as hypertension or diabetes, were also considered in some models [29,30,31,32,33,34]. To account for familial risk, some studies included the family history of breast, ovarian, endometrial or colorectal cancer [31, 34]. One study [32] incorporated biological data from serum biomarkers (e.g., C-reactive protein, interleukin 6, adiponectin, etc.) and evaluated those alone and in combination with epidemiological risk factors.
In contrast to models that relied on familial risk through epidemiological risk factors, some quantified genetic susceptibility by employing polygenic risk scores (PRS) derived from combining multiple SNPs [35,36,37]. The PRS models by Choi [35], Bafligil [36], and Fritsche [37] adjusted also for age, and Bafligil’s [36] model included BMI as well. Choi et al. [35] and Bafligil et al. [36] used 19 SNP models with 1 SNP varying between them, and Fritsche et al. [37] used a 20 SNP model, of which 15 were shared with all models. Shi et al. [33] explored the same 18 SNPs from Choi et al. [35], combining them with other epidemiological risk factors, without using a PRS model. Fig. 2; Table 2 illustrate the various risk factors across EC prediction models, while Table 3 details the various SNPs. See Additional File 4, Table S4 for all SNPs.
Fig. 2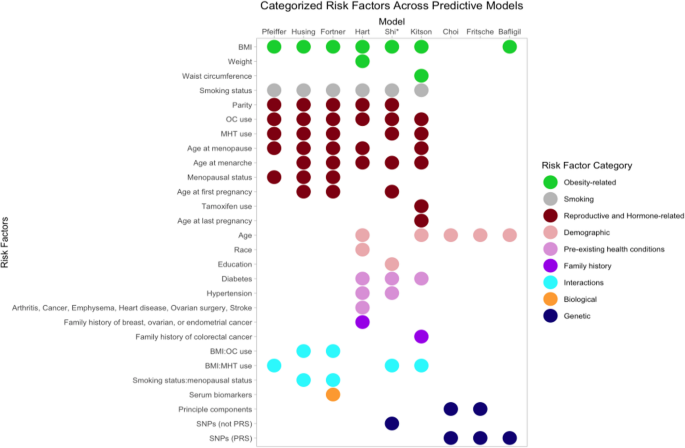
Categorized risk factors across predictive models. This visual representation facilitates easy comparison of risk factor inclusion across the various models. *Shi et al.’s model reports using SNP data directly and not through a PRS; they develop a model with epidemiological risk factors and one with epidemiological risk factors and SNPs. This figure shows Shi’s genetic model. Abbreviations: BMI (Body Mass Index); OC (Oral Contraceptive); MHT (Menopausal Hormone Therapy); SNP (Single Nucleotide Polymorphism); PRS (Polygenic Risk Score)
Table 2 Hazard ratios associated with final epidemiological models*Table 3 Odds ratios associated with final PRS models only*Methodologies for risk computation
Six predictive models calculated absolute risk (AR) [29,30,31,32,33,34], which provides a personalized estimate of the likelihood of developing EC over a specific period (usually 5 or 10 years). These models integrate individual risk factors with baseline risk derived from a comparable population reference dataset and account for competing risks. Models used variations of the cause-specific hazard function, which calculates the instantaneous risk of EC at a given specific time, conditional on the event not having occurred yet. The Hüsing [30] model incorporated country-specific incidence adjustments to improve its predictive accuracy by tailoring it to different European populations.
To compute AR, models need to first estimate relative risk (RR), which measures how the presence or absence of specific risk factors affects the likelihood of developing EC [38]. While RR is useful for identifying risk factors, it does not offer a personalized risk measure. Cox proportional hazards regression was used by several models [29, 30, 34, 35], while others used logistic regression [32, 36, 37]. Cox regression enables the modelling of time-to-event outcomes and accounts for censored data due to loss to follow-up [38]. Logistic regression predicts the occurrence of an event at a specific time point. While considered simple, logistic regression cannot account for the censoring due to the loss of follow-up [48]. Hart et al. [31] evaluated seven ML algorithms and compared their performance, but did not publicly publish any model codes or parameters, making reproducibility difficult.
To refine their models, many studies used backward elimination to remove the least significant variables iteratively [29, 30, 32, 34]. Some used penalized likelihood and shrinkage approaches for variable selection and to mitigate overfitting [33, 37]. In genetic models, Fritsche et al. [37] used three methods to develop distinct PRSs for EC, with their final model using pruning and thresholding to optimize SNP selection. Bafligil et al. [36] created PRSs by assigning log odds ratios to each SNP and summing the product of the ratios with corresponding weights to obtain a standardized risk score. Similarly, Choi et al. [35] used regression coefficients from prior literature for each SNP to compute PRS scores.
Performance of risk models
Model performance was assessed by considering both discrimination and calibration [49]. Discrimination reflects how well a model distinguishes between those who develop EC and those who do not, typically measured using the AUROC or C-statistic [50]. Conversely, calibration measures how closely predicted risks align with observed outcomes, often evaluated using the expected-to-observed (E/O) ratio or calibration slopes [50]. Calibration requires the assessment of AR. Many models were only internally validated, with only five externally validated in datasets not used for training [29, 30, 33, 34, 36]. Most EC risk models demonstrated moderate to good discrimination, with AUROCs ranging between 0.60 and 0.79.
The Pfeiffer et al. [29] model showed moderate discriminative ability, with an AUROC of 0.68 in the Nurses’ Health Study (NHS), which included White participants aged 30–55, a cohort composition different from the one the model was trained on [51]. The model overestimated risk, with an E/O ratio of 1.20, which worsened during validation in the UKBB [46] and Clinical Practice Research Datalink (CPRD) datasets [52]. The Hüsing [30] model had better discrimination and calibration with AUROC of 0.77 (95% CI: 0.68–0.85) and an E/O ratio of 0.99 in internal validation. When validated externally in UKBB and CPRD cohorts, the Husing et al. model resulted in discrimination similar to Pfeiffer et al. [29] but continued to be better calibrated. Fortner et al. [32] attempted to improve upon Hüsing’s [30] model by introducing biological markers, but the improvement in discrimination was modest. Hart et al. [31] used ML approaches that showed promising internal validation results, particularly for Random Forest (AUROC 0.95) and Neural Networks (AUROC 0.88). The Shi et al. [33] models validated on the NHS [51], NHS II [51], and the Prostate, Lung, Colorectal, and Ovarian Cancer Screening Trial (PLCO) [47], all US datasets of non-Hispanic White, postmenopausal females and showed moderate discrimination, with AUROCs between 0.64 and 0.69. Adding SNP data resulted in only modest improvements in discrimination in the PLCO [47] dataset and did not improve performance in the NHS [51] datasets. Shi’s [33] epidemiologic model was well-calibrated in NHS II [51] and PLCO [47], but poorly calibrated in the NHS [51] dataset. The Kitson et al. [34] model was validated only on the CPRD [52] data and showed good overall performance, with a C-statistic of 0.70 (95% CI: 0.69–0.70), a calibration slope of 1.14 (95% CI: 1.11–1.17), and an E/O ratio of 1.03 (95% CI: 1.01–1.05).
The PRS-based models [35,36,37] generally demonstrated poor to moderate discriminative abilities in validation. The Choi [35] and Fritsche [37] models exhibited AUROCs below 0.60 when internally validated in the UKBB [46], indicating poor discrimination. In contrast, the Bafligil [36] model, which included both PRS and BMI, performed better with an AUROC of 0.79 during internal validation and 0.75 in external validation on the UKBB dataset. Fritsche [37] accounted for correlation among SNPs through linkage disequilibrium pruning and penalized regression, whereas Balfigil [36] and Choi [35] assumed independence of SNPs. Both the Kitson et al. [34] and Bafligil et al. [36] models (PRS only) were also considered for predicting overall and non-endometrioid EC risk, demonstrating comparable results for both outcomes.
Quality assessment of models
Evaluation of quality of reporting as per the TRIPOD checklist [41] demonstrated that among epidemiological models, Hart et al. [31] had the lowest level of reporting quality, especially in the methods section. Key shortcomings included insufficient reporting of risk factor handling, model parameters including tuning and hyperparameters, and feature selection. Moreover, the final ML model was not provided, and therefore their results would be difficult to reproduce. The Pfeiffer [29], Shi [33], and Kitson [34] models followed high reporting quality, with Kitson et al. [34] performing highest across all sections. The Husing [30] model was of medium overall quality, as well as Fortner et al. [32], who did not share their codes and missed several key points in their title and introduction. For PRS-based models, Bafligil et al. [36] had high overall quality. Choi et al. [35] as medium, while Fritsche et al. [37] were considered of poor reporting quality due to their vague abstracts and titles lacking clear descriptions of the models and outcomes. Fritsche et al. [37] also failed to provide necessary details on model parameters and omitted important evaluation metrics from the results section, further contributing to poor quality. Full details of the quality of reporting assessment are presented in Additional File 5, Table S5.