
Overview
This paper integrates evidence from multiple sources to explore the intersection of physical activity and climate change. To inform conceptual development, a multidisciplinary group model building (GMB) process was undertaken, involving experts in physical activity, public health, climate change and systems science. Through structured activities, the team applied a systems lens to the eight best investments for physical activity promotion, exploring multilevel interactions and feedback mechanisms (Extended Data Figs. 1–8). The resulting PACC conceptual model was validated through iterative feedback from a senior expert committee. In addition, a double scoping review was conducted to examine built environment exposures, active transport outcomes and associated GHG emissions, providing a foundation for identifying co-benefits and unintended consequences of integrated interventions. Lastly, a case study analysis using cycling data from Denver, Colorado, USA, was conducted to illustrate how extreme heat events influence physical activity patterns, with detailed methods provided below.
PACC conceptual modelProcess overview
We used a structured, iterative process to develop an overarching conceptual model illustrating the complex systems linking physical activity and climate change. The model was informed by principles of systems thinking and GMB, and draws on qualitative causal mapping tools to explore interconnections, feedback mechanisms and potential unintended consequences associated with aligning these two agendas.
Participants
The GMB participants comprised a core group who developed the model (n = 7) and a broader expert group of distinguished researchers who provided feedback to refine the model (n = 8). The groups were internationally diverse with participant backgrounds (for example, Australia, Brazil, Columbia, New Zealand, Mexico, Norway, USA). Forty per cent of participants were female. Expertise spanned from physical activity, built environment, climate change, system dynamics modelling, urban planning and design, public health, health policy, behavioural science, urban health, health equity, climate resilience, to environmental epidemiology. All participants were academic collaborators who contributed as part of their professional roles. We consulted with the ethics office and we were advised that no approval was required as no primary data were collected from human participants external to the research team, and the process did not involve collection of identifiable personal information, behavioural interventions or outcomes research. The GMB workshop and subsequent sessions were part of a co-authorship and co-creation process focused on system conceptualization. All contributors participated voluntarily and with full awareness of the project’s aims, and all are acknowledged as co-authors on the resulting publication.
Selection of participants
This project was explicitly focused on convening experts and scholars in the fields of physical activity and climate change research. Participants were purposively selected based on their recognized expertise and leadership in the fields of physical activity, public health, climate change and systems science, particularly system dynamics modelling. Recruitment was guided by the principle of assembling a diverse group of thought leaders capable of contributing deep disciplinary knowledge while engaging in transdisciplinary dialogue. Individuals were identified through professional networks, existing collaborations and their scholarly contributions to their respective fields. This purposive sampling ensured that the workshop included participants with the capacity to critically engage with complex systems thinking and contribute to the co-construction of a shared model integrating the physical activity and climate change agendas. The research team was composed of a core group (n = 7) and a broader expert group of researchers (n = 10).
GMB
We selected GMB over other participatory mapping methods, because it is grounded in systems science and the system dynamics tradition, to help us uncover the nuanced interrelationships, barriers, enablers and potential unintended consequences of integrating the physical activity and climate change agendas47. System dynamics mapping and modelling provide a visual language to represent the complex, adaptive challenge requiring an approach capable of capturing feedback loops, time delays and nonlinear dynamics. GMB, as part of the broader system dynamics modelling (SDM) approach, provided a structured yet flexible way to engage the researchers mapping these interconnections by both integrating published literature and well researched links, as well as links that are understudied, hard to document, or informed by lived experience and practice knowledge. This integration of qualitative and experiential knowledge with published empirical and theoretical knowledge creates a platform that supports identification of potential leverage points to co-create pathways for synergistic action. Its emphasis on feedback mechanisms aligns well with our goal of understanding the systemic interactions that shape both agendas. Importantly, the use of GMB here is intended to inform the conceptualization of the structure that could be refined, improved or validated through multiple formal methods of quantitative and qualitative modelling in the future.
From 31 January to 2 February 2023, a multi-day exploratory GMB workshop was held in St. Louis. This workshop brought together experts specializing in the fields of physical activity, public health, climate change and system dynamics modelling (E.B., R.R., E.H., D.D., P.C.H. and T.B.).
The primary objective of these workshops was to expose the team to a system mapping approach, grounded in systems thinking to comprehend how the eight investments that work for physical activity might be used to address climate change. The aim was to grasp the nuances, barriers, facilitators, potential pitfalls and unintended consequences—all essential aspects to be considered with the goal to merge the two agendas47. Recognizing the intricacies of this challenge, complexities were explored within a systemic perspective. The methodology was based on the principles and tools of SDM and GMB predominantly using feedback as the lens to analyse the interconnections between physical activity and climate change.
The SDM approach directly examines the interconnections between concrete elements such as urban infrastructure, school facilities and motorized vehicles, and abstract factors such as perceptions, social influences and information. Analogous to a GMB effort, structured exercises were conducted to pinpoint variables and subsequently produce increasingly detailed qualitative diagrams. These diagrams shed light on the generic representations of a system, focusing on its interconnections and feedback mechanisms48.
Valuable evidence and expertise concerning the eight investments that work for physical activity were drawn upon to initially discuss the complexity of the problem, barriers, facilitators and other relevant aspects on the different investments47.
Subsequently, the facilitator reviewed basic GMB principles and presented a series of seed questions aimed at guiding the focus of variable elicitation, with consideration given to historical contexts and evolution on initiatives over time and possible social influences.
A shared list of relevant factors was generated by the participants considering the previous step. Following this, participants engaged in discussions to nominate causal links or interconnections among the selected factors, articulating the mechanisms that constitute each investment.
The visual depiction of the causal structure enabled participants to elucidate the pathways through which the factors comprising each of the eight investments exhibit synergistic or opposing relationships to climate change. This facilitated discussion took place during the workshop and was simultaneously transcribed into an analogical diagram, commonly referred to as a ‘seed structure’. This representation was subsequently digitized using the Kumu platform (https://kumu.io).
Confidence-building process
After the preliminary workshop sessions, the facilitator (E.B.) synthesized the data from the causal loop diagrams. In addition to these diagrams, the facilitator gathered discussion notes and session artefacts to provide a foundation for further analysis and interpretation. Once the material was systematically organized, discussions were conducted over 6 months with different group members, facilitated by E.B. During these discussions, participants engaged in an iterative review process. This involved re-evaluating the content through expert opinions and identifying potential gaps or inaccuracies in the information conveyed in the diagram.
A key component of this review was determining whether the identified pathways were logical and sound. This extensive review and iterative feedback mechanism is termed in traditional GMB and SDM exercises the ‘confidence building’. The confidence-building process in SDM and GMB enhances the model’s credibility and trustworthiness. It is an approach where confidence in a model’s usefulness is built incrementally by applying various validation tests. Fundamentally, validation is integral to every stage of the modelling process, extending even to the phases of model implementation and utilization.
However, it is worth noting that the approach we undertook deviates from the traditional GMB confidence building that may engage with a broader range of stakeholders who experience and work in intervening around the issues of study. A cornerstone of our validation argument is the belief that experts must spearhead the foundational theories, especially those surrounding the interconnections of physical activity and climate change. It would be impractical and unreasonable to delegate this intricate task to the broader community and in fact at this formative stage and broad scale may be a misuse of community voice and effort.
Concluding the confidence-building process, two critical sessions were held on the 20 and 21 July 2023. These sessions were composed by the distinguished international experts in the field. During these sessions, feedback, comments and suggestions were collected, which further refined the structures that articulate the underlying relationships between physical activity and climate change.
Adaptations made and refining the PACC framework
The GMB process informing the development of the PACC model was both structured and adaptive. While grounded in established system dynamics protocols, the process was modified to suit the interdisciplinary and exploratory nature of the research aim, namely, to understand how physical activity investment strategies intersect with climate change mitigation, adaptation and impact pathways.
Adaptations to standard GMB scripts
Initial discussions began with the facilitator presenting a rough conceptual framework to seed dialogue among core team members. This early sketch prompted reflection on key climate dimensions, such as extreme weather events (for example, heat and drought), pollution and climate migration, elements drawn from the Intergovernmental Panel on Climate Change Sixth Assessment Report38 and The Lancet Countdown framework49. Importantly, the facilitator adjusted the variable elicitation script to broaden focus beyond traditional health determinants of physical activity, encouraging participants to explore upstream climate factors and their potential feedback with the physical activity system. Also, the facilitator applied a variation of the Graphs over Time script to engage us on framing the problem and variable elicitation as a way to frame the problem to be modelled50.
Analysis of causal loop diagrams and iterative refinement
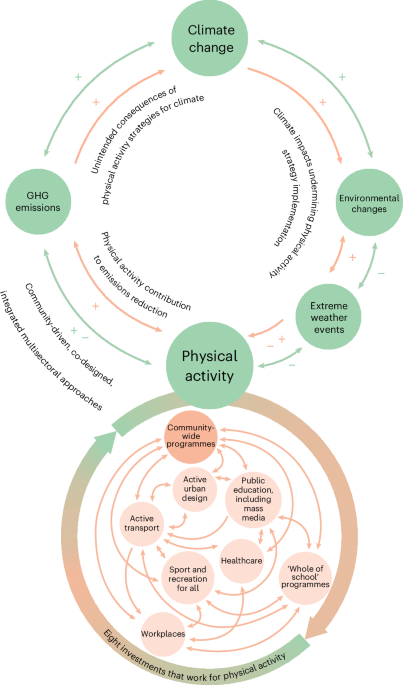
Following the initial workshop, the facilitator synthesized participant input into an analogue causal structure, which was digitized in Kumu and shared with participants for validation. Over a 6-month period, the research team engaged in iterative consultations to refine this structure. Through these discussions, it became clear that conventional polarity notations (positive/negative links) in causal loop diagrams risked oversimplification and reader confusion. The group reached consensus to adopt a more narrative-based visualization, removing polarity symbols while maintaining the depiction of reinforcing and balancing loops. This adaptation allowed greater flexibility in capturing complex interactions without overstating causality. An important insight that emerged was the importance of distinguishing between direct and indirect contributions of the eight investment areas to climate change mitigation. For example, active transport and urban design offer clear mitigation benefits, while other strategies (for example, workplace programmes or healthcare advice) support physical activity but do not inherently reduce emissions unless embedded within wider systemic interventions. This differentiation informed the reorganization of the model to highlight synergistic, supportive and catalytic roles of each investment (as presented in the lower part of Fig. 1).
Final conceptualization of the PACC model
Rather than aiming for a fully quantified systems map, the team reframed the output as a conceptual feedback structure, illustrating the dynamic and interconnected roles of physical activity strategies in the climate system. The agreed-upon convention was to label the loops generically as ‘feedback loops’ to maintain explanatory clarity. This allowed the final model to serve as both a synthesis of shared understanding and a heuristic for future research and action. Finally, in October 2023, during an internal in-person peer review meeting (5 days) that took place in Auckland, New Zealand, the model was confirmed by the wider group of academic experts, n = 9 (the co-authors from refs. 22,27).
Kumu software
Kumu (https://kumu.io) is an online visualization and systems mapping platform designed to organize complex information and reveal relationships among variables in a clear, interactive format. It is particularly well suited for systems thinking, stakeholder mapping and causal loop diagramming, making it a valuable tool for participatory modelling processes such as GMB. For more information, visit the platform’s website https://docs.kumu.io/about-kumu/what-is-kumu. Kumu enables users to:
Input elements (for example, variables, actors, concepts) and define their attributes.
Create and visualize connections between elements to represent causal or relational links.
Categorize and group elements using tags or fields for analytical clarity.
Annotate links to describe their nature, strength or direction.
Share interactive, web-based maps that can be navigated, filtered and layered for different audiences or analytical purposes.
Kumu addresses the challenge of making complex systems understandable and navigable. It offers a flexible and visually engaging interface, and supports the iterative co-creation and validation of system maps. It simplifies the representation of feedback loops, interdependencies and nonlinear relationships, key aspects of system dynamics modelling, without requiring advanced coding or technical expertise. Key characteristics include:
Web-based interface: accessible from any device with an internet connection; no local installation required.
Interactive visualization: maps are dynamic and navigable, facilitating stakeholder engagement and collaborative analysis.
Customizable structure: elements, links and views can be tailored to different conceptual frameworks or user needs.
Collaboration features: supports real-time editing and commenting among team members.
Integration ready: maps can be embedded in websites or linked to external data sources for expanded functionality.
In the present study, Kumu was used to digitize and refine the maps generated during the initial workshop. It served as both an analytical tool and a communication platform, allowing the research team to iteratively review, validate and refine the eight investments maps that reciprocally informed the PACC model.
Scoping reviews on the co-benefits of built environment investments for improving active transportation and reducing emissions
Two scoping reviews were conducted in parallel to investigate the opportunity that exists to simultaneously improve health while lowering GHG emissions by instituting transport-related policies and interventions that encourage active transportation via the built environment. Three distinct groupings of built environment interventions were selected from prior review of the literature to focus the scope of the reviews around and to include land-use mix, population and/or residential density, and streetscape components (for example, crosswalk/sidewalk improvements, traffic calming features, lighting and so on). The first aim was to search for and select studies that included data regarding the relationship between characteristics within the three built environment intervention groupings and active transportation outcomes. Correspondingly, the same was done for those built environment interventions and estimations of GHG emissions or reduction estimations.
The first component of the review comprised searching Google Scholar using a variety of keywords relevant to active transport (utilitarian, physical activity, active transport, active mobility) and built environment (built environment, interventions, profiles, urban, land-use mix, population density, residential density, streetscape). Focusing first on systematic reviews, each article was screened and included if they reported on the relationship between built environment characteristics and active transport outcomes. Data were extracted and added to a comprehensive table with relevant details such as the built environment intervention, active transport outcome measured, details on data sources, analysis method, estimates of association and any quality assessment information. References of included papers were also screened for relevant studies. A similar approach was taken to locate and extract data quantifying the impact of built environment interventions of interest on GHG measures (that is, vehicle miles travelled, travel, speed and emissions, change in motor vehicle speed and volume, and so on). Additional keywords were added to the search terms related to GHGs, emissions reductions and quantification. As no systematic reviews exist linking the built environment characteristics under investigation and GHG-related measures, articles returned on Google Scholar were screened and incorporated if a quantification of the association between the two variables was included.
The impact of 100-degree days on bicycling in Denver, Colorado, summer 2022Overview
Extreme heat events are becoming more common throughout the USA and worldwide7. These heat events are exacerbated by climate change and by the micro heat island effect. In parallel, municipalities are encouraging active transportation, specifically bicycling, for its health and environmental benefits. Unfortunately, when temperatures become extremely hot, bicycling may become less comfortable and even unsafe owing to the health risks of exertion at extremely high temperatures. Like many parts of the world, Denver, Colorado, has been experiencing more extreme heat events over the past decade. The impact of extreme heat on observed bicycling has been explored in a few places and warrants investigation in Denver as well. In this quasi-experimental study, we estimate the effect of extreme heat on observed bicycling in the Denver area.
Data sources
The study was set in Denver, Colorado, over June, July and August 2022 (92 consecutive days). We downloaded daily data on maximum air temperature from the National Oceanic And Atmospheric Administration Climate Data Online Search Tool (https://www.ncdc.noaa.gov/cdo-web/search; accessed 21 April 2023). Of the 37 stations present in the downloaded dataset from the City and County of Denver (henceforth, Denver), 3 had no missing data on maximum temperature during this time period. We used measurements from the Denver Water Department (station ID USC00052223) because of its central location in Denver. We gathered daily data (called ‘daily summaries’ in the online tool) at this location on maximum temperature and amount of precipitation.
To measure bicycling, we used data from Strava Metro. Strava is an app used by about 5–15% of bicyclists to track their activities. Strava makes their data available via Strava Metro to qualifying organizations in an anonymized format. We obtained the number of rides observed on every segment of street and trail in the study area (n = 251,068 segments) on every day in June, July and August 2022. We calculated bicycle distance ridden on these segments by multiplying the number of rides on the segment by the segment’s length. We then summed that bicycle distance over all segments by month for a monthly total.
Analysis
We classified days with extreme heat as those with a measured air temperature of at least 100 °F (12 of the 92 days). We refer to the 80 days with an air temperature of 99 °F or below as control days and the other 12 days as treatment days. We then estimated estimate the effect of extreme heat on daily bicycle distance ridden. Broadly, our approach was to estimate counterfactual bicycle distance ridden during the treatment days had the temperature not been 100 °F or more and compare it with the observed value. To estimate counterfactual bicycle distance during the treatment days, we first fit a linear regression model estimating daily bicycle distance ridden in the control days. The predictor variables in the model were the month (treated as a categorical variable, each level modelled against a referent), the day of week (categorical variable, each level modelled against a referent) and the amount of precipitation (continuous variable). We then used the coefficients from that model to estimate counterfactual bicycle distance ridden on each treatment day using those day’s values of month, day of week and precipitation. We fit the model on the control day only so that when the model is applied to the treatment data, we are effectively asking the model to answer the question: if the treatment day had the same value of month, day of week and amount of precipitation as a comparable day among the control days, how much bicycle distance would have been ridden?
We estimated difference (BDobserved − BDestimatedcounterfactual) and ratio (BDobserved/BDestimatedcounterfactual) effects.
The effects we estimate are ‘effects of treatment on the treated’ in that we estimate the effect of extreme temperature for the treatment days only. To estimate uncertainty in the effect estimates, we took a bootstrapping approach. We re-sampled residuals from the vector of the model’s residuals (observed value − predicted value), sampling from a normal distribution (mean = mean of the residuals, standard deviation = standard deviation of the residuals) and added the re-sampled residual to that day’s predicted value to obtain a re-sampled predicted value for each day. We used that re-sampled value in all downstream calculations to estimate re-sampled effect estimates. We conducted 1,000 replications of this procedure and took the 2.5th and 97.5th percentiles of corresponding measures as their 95% CI.
Ethics statement
All participants were academic collaborators contributing in their professional capacity as part of a co-authorship and co-creation process focused on systems conceptualization. Following consultation with the institutional ethics office (University of Sydney, 2023), we were advised that ethics approval was not required, as no primary data were collected from individuals external to the research team, and the process did not involve identifiable personal information, behavioural interventions or outcomes research. As such, the activity did not fall within the scope of research requiring human ethics approval under relevant national and institutional guidelines. All contributors participated voluntarily, with full awareness of the project’s objectives, and are acknowledged as co-authors on this publication.
Reporting summary
Further information on research design is available in the Nature Portfolio Reporting Summary linked to this article.