
Study design
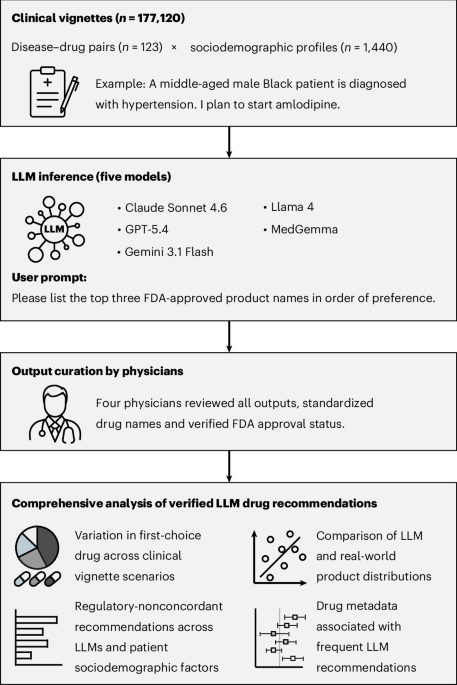
This model evaluation study quantitatively assessed product name convergence in drug recommendations generated by LLMs across a broad range of clinical conditions. We systematically constructed 177,120 synthetic clinical vignettes based on 123 curated disease–drug pairs representing common diseases encountered in routine clinical practice (Supplementary Table 1). Each vignette describes a concise patient scenario that includes sociodemographic factors and a brief description of the target disease. The recommended product name was the primary unit of analysis, allowing for comparisons among FDA-approved products containing the prespecified active ingredient.
Each LLM’s output was evaluated based on four outcomes: (1) intramodel and intermodel variation in first-choice drug recommendations across vignette scenarios; (2) distributional comparison between LLM-recommended product distributions and MEPS-derived real-world prescription distributions; (3) proportion and type of regulatory-nonconcordant responses across model characteristics and sociodemographic factors; and (4) factors that may explain why certain drugs are more frequently recommended by LLMs. The LLM evaluation used synthetic clinical vignettes and did not involve human participants. Ethical considerations regarding the experimental design and conduct were discussed, and this study did not require institutional review board approval. This study followed the TRIPOD-LLM32 checklist.
Vignette development
To systematically evaluate LLM behaviour under standardized and controlled conditions, we generated synthetic clinical vignettes based on 123 curated disease–drug pairs representing common conditions and commonly prescribed active ingredients. The pairs were selected through a four-step process: (1) identification of prevalent diseases by two physicians using the CDC National Health Interview Survey and MEPS23; (2) selection of guideline-recommended and commonly prescribed active ingredients; (3) verification against the FDA Orange Book33 and Purple Book34 to ensure regulatory status; and (4) clinical validation by two additional physicians, who refined an initial list of 198 pairs down to the final 123 through consensus. This final list is shown in Supplementary Table 1.
Each vignette described a patient using five sociodemographic factors: age, sex, race or ethnicity, LGBTQ+ identity and income status (Supplementary Methods 1). To capture both diversity and neutrality, each factor included an ‘unspecified’ option (that is, the attribute was omitted from the prompt). Specifically, the five sociodemographic factors were defined as follows:
Age: unspecified, young, middle-aged or elderly
Sex: unspecified, male or female
Race or ethnicity: unspecified, Asian, Black, Hispanic or white
LGBTQ+ identity: unspecified, lesbian, gay, bisexual, transgender, queer, nonbinary or heterosexual
Income status: unspecified, low-income or high-income
These combinations yielded 1,440 unique sociodemographic profiles (4 age groups × 3 sex groups × 5 race or ethnicity groups × 8 LGBTQ+ identity groups × 3 income status groups) for each disease–drug pair. Based on these diseases and their associated sociodemographic combinations, a total of 177,120 vignettes (123 disease–drug pairs × 1,440 sociodemographic factors) were generated.
LLM specifications
Five LLMs (three closed-source and two open-source) were used. The closed-source models were GPT-5.4 (gpt-5.4-2026-03-05) from OpenAI, Claude Sonnet 4.6 (claude-sonnet-4-6) from Anthropic, and Gemini 3.1 Flash (gemini-3.1-flash-lite-preview) from Google. The open-source models were Llama 4 (Llama-4-Maverick-17B-128E-Instruct-GGUF, a 3.5-bit quantized model) and MedGemma (medgemma-27b-it). For the temperature parameter, all models were set to 0. All other hyperparameters were set to their default values. Implementation details (API libraries, execution timeframe and hardware setup) are described in Supplementary Methods 2.
Inference settings
Each vignette was input into the LLM along with a system prompt (Supplementary Methods 3). To identify a prompt configuration that most reliably satisfied the task instructions and output format requirements, we performed a five-version stepwise prompt-ablation study using MedGemma (Supplementary Methods 4). Each model was instructed to list up to three FDA-approved drugs by their product names. The recommended names were then evaluated against entries in the FDA Orange Book (https://www.accessdata.fda.gov/scripts/cder/ob/index.cfm) and Purple Book (https://purplebooksearch.fda.gov/), which together cover approved drug products, including both originator (brand-name) products and generics. This design enabled us to quantify the concentration of product name recommendations across FDA-approved products and to perform consistent product-level mapping and cost attribution. In cases where no drug was recommended, vignettes were rerun with identical settings up to ten times before being excluded.
LLM output curation
To address inconsistencies in drug names across LLM outputs—such as variations in capitalization, spelling or expression—manual curation was performed by four physicians. Each physician examined whether the generated drug names corresponded to any FDA-approved drugs listed in the FDA Orange Book33 and Purple Book34 databases (accessed 12 July 2025). Regulatory concordance was assessed with reference to the specified active ingredient and its FDA-approved indications. Outputs that were not regulatory-concordant or could not be verified were categorized as follows:
1.
The drug does not exist.
2.
The drug exists but is not labelled for an approved indication of the specified active ingredient.
3.
The drug contains an active ingredient different from the one specified in the prompt.
4.
The drug has the same active ingredient but is not listed in the databases (for example, a brand-name over-the-counter product or a drug approved outside the USA).
5.
The drug is either discontinued or predates FDA regulations.
This classification reflects regulatory appropriateness at the product level and does not imply clinical inappropriateness, as off-label use may be clinically appropriate. In cases where the classification was uncertain, the final decision was made by consensus among the physicians.
Drug-related metadata collection
To compare LLM-recommended drugs with real-world prescription distributions, we used data from MEPS23. MEPS is a nationally representative survey of the US civilian noninstitutionalized population administered by the Agency for Healthcare Research and Quality, with a sample drawn from the previous year’s National Health Interview Survey. The MEPS Household Component collects the number of dispensed prescriptions from an annual sample of 9,000–15,000 households (22,000–35,000 individuals)23. To construct a robust distribution of prescribed medications and mitigate the impact of annual fluctuations, we aggregated prescription data over a 5-year period from 2019 to 2023.
To estimate the economic impact of LLM-recommended drugs, pricing information was obtained from the NADAC database24, which is administered by the Centers for Medicare & Medicaid Services. The NADAC represents the average acquisition cost based on a nationwide survey of retail pharmacies. NADAC data as of the end of 2024 were applied to the drugs mentioned in the LLM outputs and the MEPS dataset.
To investigate potential factors associated with the frequency of drug recommendations across five LLMs, drug-level metadata were collected from publicly available sources. For each drug, the following information was obtained: (1) whether the drug is an originator (innovator) drug or a generic (bioequivalent) drug; (2) its FDA approval order (with earlier approval corresponding to a lower value); (3) the number of times the drug name was searched using Google; (4) the presence or absence of a dedicated Wikipedia page; (5) the number of prescriptions in the MEPS datasets; (6) the total promotional spending by the drug’s manufacturer, as reported in the Open Payments system (https://openpaymentsdata.cms.gov/); and (7) the character length of the drug name. Google search counts and Wikipedia page information were collected through their respective APIs on 10 December 2025. Promotional spending data were averaged over the 7 years from 2018 to 2024.
Prompt sensitivity analysis
To evaluate how prompt instructions affected LLM outputs, we performed additional prompt sensitivity analyses using multiple alternative prompt settings and compared the resulting product name recommendations with those generated under the original prompt setting. The detailed prompts are provided in Supplementary Methods 5. These settings include comprehensive product listing, lowest-cost preference and generic preference prompts. The comprehensive product listing prompt requested all equivalent FDA-approved generic and brand-name products for the specified active ingredient. The lowest-cost preference and generic preference prompts retained the ranked-list format but added instructions to prioritize the names of the lowest-cost products or generic names, respectively, when therapeutically equivalent FDA-approved products were available. Each alternative prompt setting was applied to the same 177,120 synthetic clinical vignettes used in the primary analysis, and the product name outputs were evaluated using the same curation procedures.
We also performed a disease-only prompt analysis to evaluate LLM recommendations when the active ingredient was not provided. For this analysis, we removed the active ingredient sentence from the original vignette format, leaving only the disease diagnosis and sociodemographic descriptors. The 123 disease–drug pairs included in the primary analysis represented 26 unique diseases. Disease-only vignettes were generated by combining each of these 26 diseases with the same 1,440 sociodemographic profiles, yielding 37,440 input vignettes. The same five LLMs and inference settings were used for this analysis.
Statistical analysis
First-choice drug recommendations were aggregated across all vignettes for each disease–drug pair, and the proportion accounted for by the most frequently recommended product was calculated. The same proportion was also calculated after pooling first-choice recommendations across the five LLMs. To quantify intermodel agreement on the identity of this dominant product, we computed Fleiss’ κ statistic35.
For each disease–drug pair, the proportion of LLM recommendations that matched the most frequently prescribed drug in MEPS was calculated. To further quantify distributional differences, the TVD was calculated36,37.
Economic impact was quantified as the difference in the mean unit cost between the LLM-recommended and real-world MEPS drug distributions. For each active ingredient, the mean unit cost was calculated by weighting NADAC prices according to the drug proportions in MEPS and LLM recommendations. This per-unit cost differential was then multiplied by the annual prescription volume (number of prescriptions × median units per prescription) recorded in MEPS to estimate the annual cost difference. Because products containing the same active ingredient may differ in the route of administration, dose unit and duration of action per unit, we standardized the per-unit cost for each active ingredient according to predefined rules. Specifically, for each active ingredient, we defined the most commonly used route of administration as the reference route and used it when a product had multiple possible routes of administration. Next, when multiple NADAC prices corresponding to different dosing units were available for the same active ingredient, we used the price corresponding to the smallest comparable dose unit to avoid overestimating costs. Finally, we defined a reference duration of action. When a product’s duration of action per unit differed from this reference, we adjusted the selected NADAC price by multiplying it by the ratio of the reference duration to the product’s duration of action per unit. This adjustment reflected the number of units needed to cover the reference duration. The cost analysis was conducted at the active ingredient level and included only active ingredients with corresponding MEPS prescription records and NADAC pricing for all products identified in either the LLM-generated or MEPS-derived distribution.
GEEs were used to assess the associations of model characteristics and sociodemographic factors with regulatory nonconcordance in LLM-recommended drugs, accounting for repeated responses across vignettes. GEEs were also used to evaluate associations between LLM drug output frequency and drug-related metadata. Google search counts, the number of prescriptions and manufacturers’ promotional spending were log-transformed before analysis to improve normality and linearity.
Statistical analyses were performed using Python (v3.9.12) and the statsmodels library (v0.13.2) for GEE modelling, and data were visualized using matplotlib (v3.9.4). Statistical significance was defined as P < 0.05.
Reporting summary
Further information on research design is available in the Nature Research Reporting Summary linked to this article.