
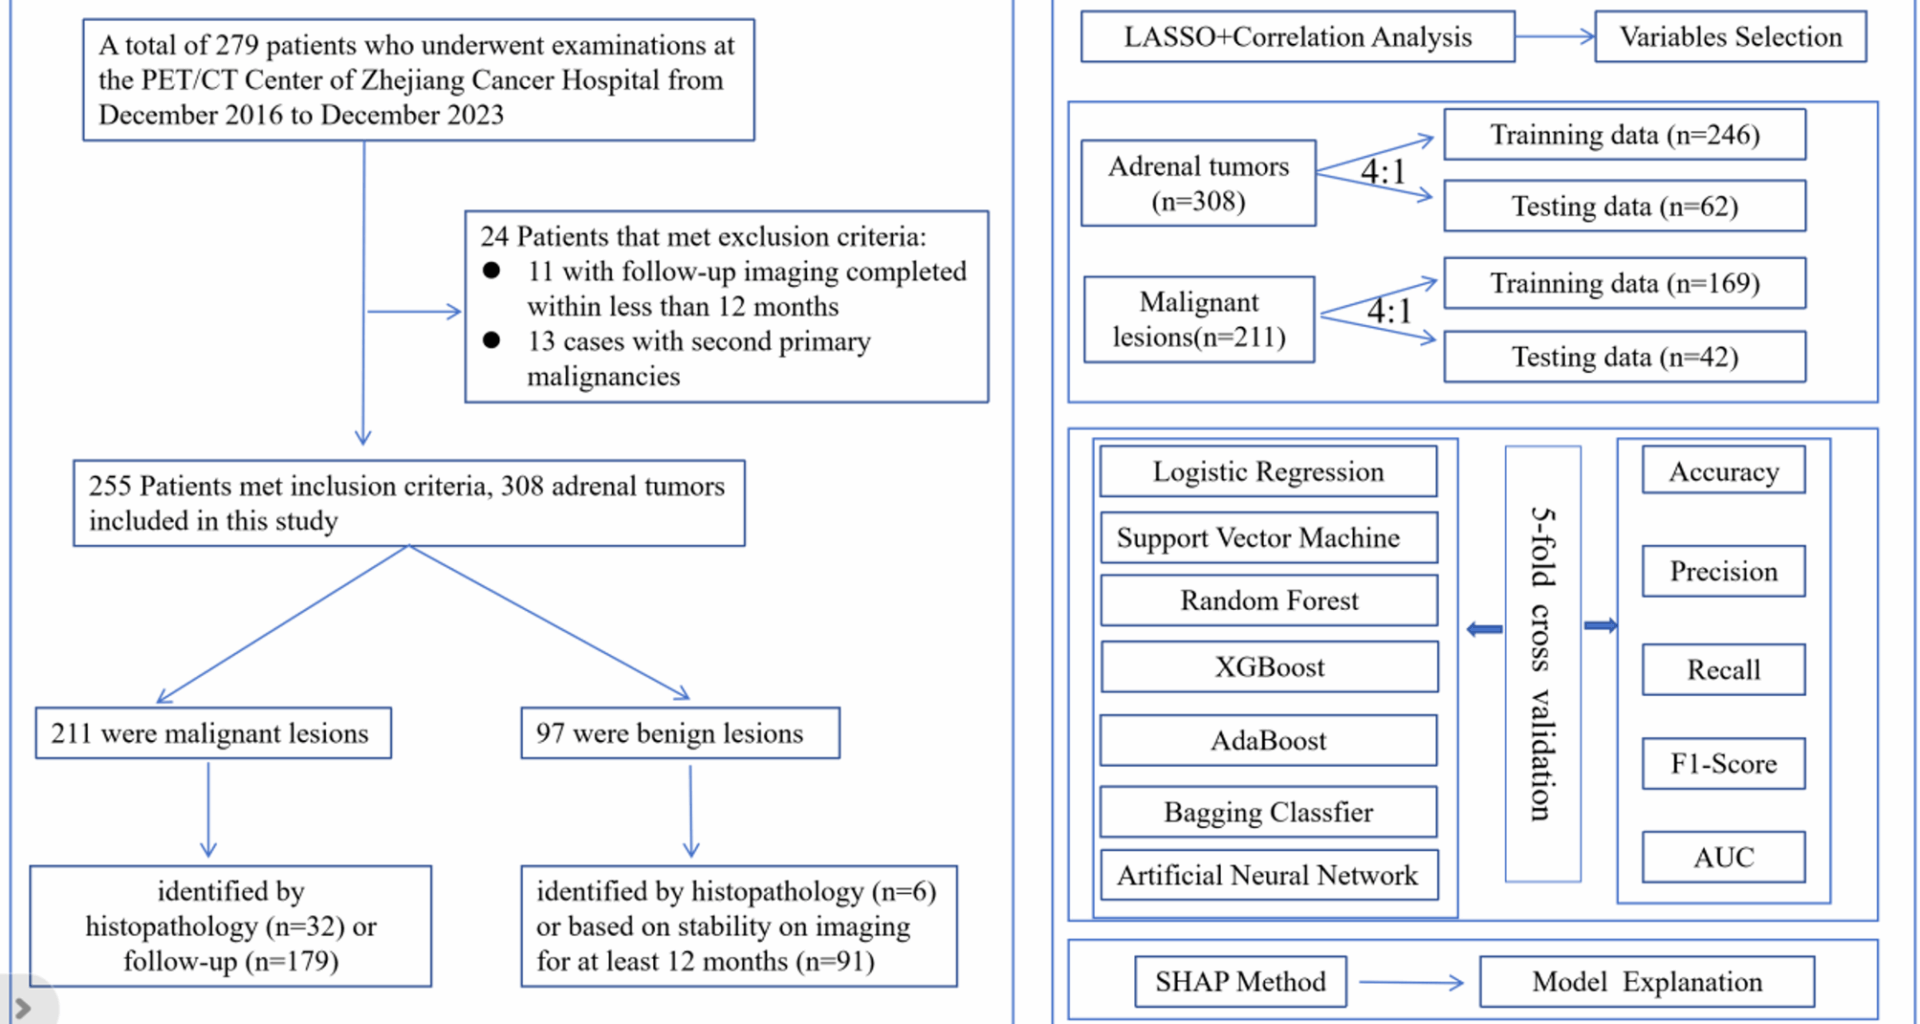
A total of 255 patients were available in this study, the age ranges from 21 to 89 years old. The total number of male patients is 168, accounting for 65.9% of the total number of patients. The total number of female patients was 87, accounting for 34.1% of the total number of patients (Table 1).
Table 1 Baseline characteristics of the study populationFeature space visualization and classification feasibility for adrenal lesion diagnosis
To investigate the intrinsic structure of the dataset and assess the feasibility of distinguishing benign from malignant adrenal lesions, this study first performed a t-distributed Stochastic Neighbor Embedding (t-SNE) projection on the selected features. As shown in Fig. 2, the t-SNE visualization reveals two well-separated clusters, with each cluster predominantly corresponding to one of the binary classification labels (yellow = benign, purple = malignant).
The projection was based on a subset of clinically relevant features, including adrenal gland lesions SUVmax, tumor plain scan CT value, T/L SUVmax ratio, tumor diameter, liver SUVmean, age, and gender. This clear spatial separation in the two-dimensional embedded space suggests that these input variables contain informative patterns that are strongly associated with lesion type. The distinct clustering indicates low intra-class variance and high inter-class separability, supporting the hypothesis that the malignancy status of adrenal lesions can be effectively inferred from the extracted features.
Fig. 2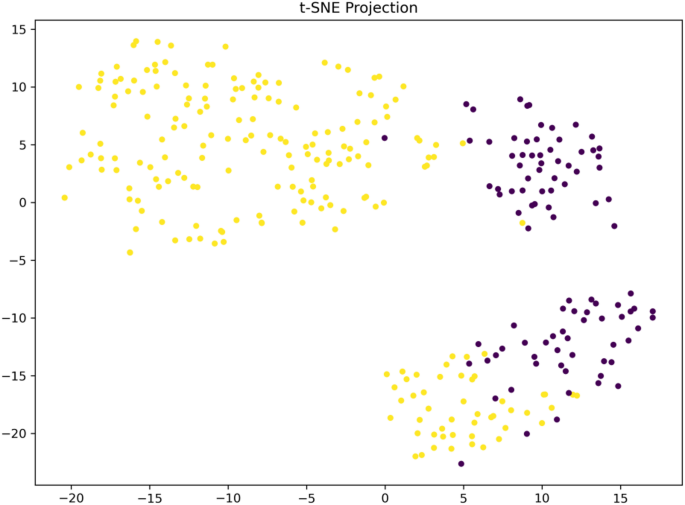
t-SNE projection of the dataset based on selected features. Each point represents an individual sample, with colors indicating the binary classification labels (yellow = negative, purple = positive). The t-distributed Stochastic Neighbor Embedding (t-SNE) algorithm was used to reduce the high-dimensional feature space to two dimensions for visualization
Elastic net feature coefficient analysis
Least Absolute Shrinkage and Selection Operator (LASSO) logistic regression was applied to identify a parsimonious subset of features most predictive of adrenal lesion malignancy. This method performs both regularization and variable selection by penalizing the absolute size of coefficients, thus shrinking less informative predictors toward zero.
As shown in Fig. 3-A, the coefficient paths demonstrate how variable weights evolve as the regularization parameter (lambda) increases. With stronger penalization (moving rightward along the x-axis), coefficients progressively approach zero. Figure 3-B shows the result of 10-fold cross-validation, where the optimal lambda was determined based on the minimum binomial deviance. This value balances model complexity and predictive performance.
The final model (Fig. 3-C) retained seven variables, including: T/L SUVmax, which exhibited the largest negative coefficient, indicating that lower values strongly predict malignant lesions. Adrenal gland lesions SUVmax and tumor plain scan CT value, both showing positive coefficients, suggesting that higher values are associated with increased malignancy probability. Additional features such as age, tumor diameter, gender, and liver SUVmean were retained with smaller but non-zero coefficients, implying secondary predictive roles. Overall, the LASSO-selected feature set reinforces the key role of metabolic and anatomical imaging parameters in malignancy classification, while also providing a compact and interpretable model input set for subsequent supervised learning.
Fig. 3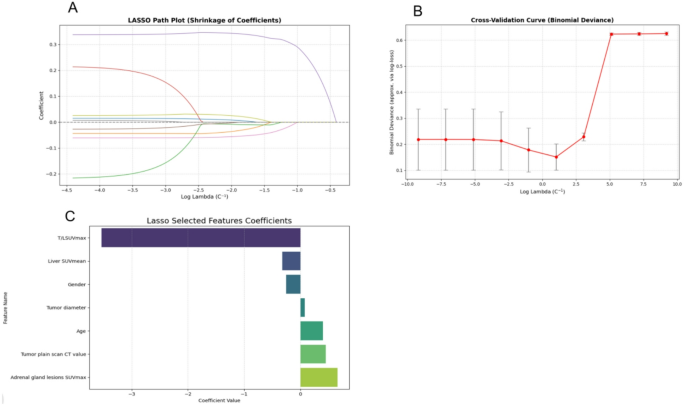
LASSO feature selection results. A LASSO path plot showing the coefficient shrinkage process as a function of log-transformed regularization strength (lambda). B 10-fold cross-validation curve indicating the optimal lambda value that minimizes binomial deviance. C Final coefficients of selected features based on the optimal lambda. T/L SUVmax was assigned the largest negative weight, while adrenal gland lesions SUVmax and tumor plain scan CT value had positive contributions to the model
Exploratory analysis of feature distributions across benign and malignant adrenal lesions
In order to evaluate the discriminative capacity of individual clinical and imaging features with respect to the binary classification of adrenal lesions (0 = Benign, 1 = Malignant), a comparative analysis was conducted using boxplots for seven key variables (Fig. 4). These include: Adrenal gland lesions SUVmax, Age, Liver SUVmean, T/L SUVmax ratio, Tumor diameter, Tumor plain scan CT value, Gender.
This exploratory visualization provides insights into the potential of each feature in distinguishing between benign and malignant cases, serving as a basis for feature selection in downstream modeling.
Figure 4A shows the distribution of adrenal gland lesion SUVmax. A clear and significant separation is observed between the two groups: benign cases (Target = 0) exhibit substantially higher SUVmax values, while malignant cases (Target = 1) present consistently low SUVmax values with little variation. This marked difference indicates that adrenal SUVmax is a highly informative feature for malignancy prediction.
Figure 4B depicts the distribution of age. The boxplots reveal overlapping distributions and comparable medians between benign and malignant groups, indicating that age does not significantly differ across classes. Thus, while it may contribute modestly within a multivariate model, it lacks standalone discriminative power.
Figure 4C presents liver SUVmean, showing a slightly higher median in the benign group. However, the wide overlap in distributions diminishes its utility as an independent predictor. In Fig. 4D, the T/L SUVmax ratio demonstrates a higher median and broader range in benign cases, suggesting that this ratio may serve as a valuable imaging biomarker for differentiating disease types. Fig. 4E highlights tumor diameter, which tends to be larger in benign cases and shows a wider interquartile range, reinforcing the hypothesis that tumor size correlates with lesion type. Fig. 4F illustrates tumor plain scan CT values. Benign cases consistently present lower CT values than malignant cases, suggesting that radiodensity may be inversely associated with malignancy, and further supports the value of CT in classification. Lastly, Fig. 4G reveals a distinct gender imbalance between the two groups. The majority of benign cases are concentrated in one gender, while malignant cases predominate in the opposite gender, underscoring gender’s potential role as a relevant demographic factor in classification.
Fig. 4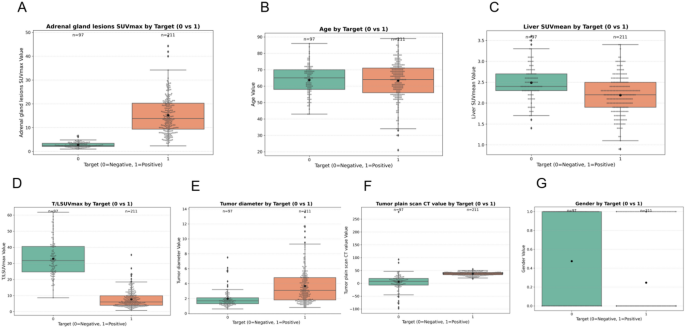
Distribution of clinical and imaging features by binary target outcome (0 = Negative, 1 = Positive). Panels A–G show comparisons of each variable using boxplots: A Adrenal gland lesions SUVmax, B Age, C Liver SUVmean, D T/L SUVmax ratio, E Tumor diameter, F Tumor plain scan CT value, and G Gender
The most discriminative features include adrenal gland SUVmax, T/L SUVmax, tumor diameter, tumor plain scan CT value, and gender, all showing substantial separability between benign and malignant lesions. Age and liver SUVmean, while less distinct on their own, may still provide supplementary value in multivariate modeling. This analysis lays the groundwork for informed feature selection in subsequent supervised learning workflows.
Feature correlation analysis
Figure 5 presents a correlation heatmap illustrating pairwise Pearson correlation coefficients among clinical, imaging, and demographic features, including the binary classification target. This analysis provides insight into potential feature redundancy and the direct associations between variables.
Fig. 5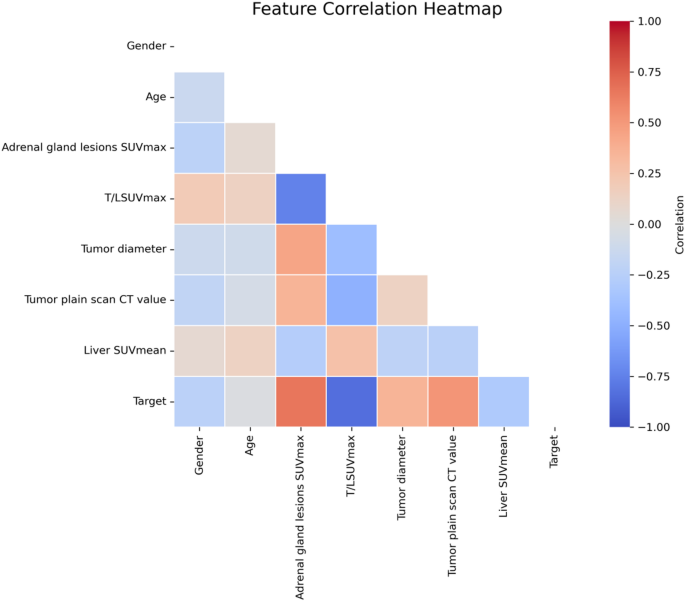
Feature correlation heatmap. The plot illustrates pairwise Pearson correlation coefficients among all selected variables and the binary target. Color gradients range from − 1.0 (strong negative correlation, blue) to + 1.0 (strong positive correlation, red), with neutral values shown in white
Among all variables, adrenal gland lesions SUVmax demonstrated the strongest positive correlation with the target variable, indicating that higher SUVmax values in adrenal lesions are strongly associated with the positive class. Conversely, T/L SUVmax exhibited a strong negative correlation with the target, suggesting that lower tumor-to-liver ratios are predictive of the positive outcome—a finding consistent with model-based feature importance analysis.
Tumor plain scan CT value and tumor diameter also showed moderate positive correlations with the target, while gender, age, and liver SUVmean exhibited weak or near-zero correlations, implying limited direct linear association with the outcome. Notably, the correlation coefficients between input features remained moderate (|r| < 0.7), suggesting minimal multicollinearity and supporting the inclusion of all features in multivariate models without significant risk of redundancy or instability.
Model performance evaluation and comparison
Continue to comprehensively assess the effectiveness of various classification algorithms in predicting the malignancy of adrenal gland lesions, seven commonly used models: Logistic Regression, Random Forest, AdaBoost, SVM, XGBoost, Bagging, and Artificial Neural Network (ANN) were evaluated. Model performance was compared using multiple metrics, including Accuracy, Precision, Recall, F1-Score, and Area Under the Receiver Operating Characteristic Curve (AUC), as presented in Fig. 6 and summarized in Table 2.
Figure 6(A) displays the ROC curves for all models, illustrating high true positive rates across classifiers. Most models achieved an AUC greater than 0.98, with Random Forest, XGBoost, and Bagging reaching perfect or near-perfect scores (AUC = 1.00, 0.998, and 0.999, respectively), indicating excellent discriminative ability. Logistic Regression and SVM also performed robustly (AUC = 0.994 and 0.986), while AdaBoost showed slightly lower performance (AUC = 0.985), though still in the high range.
Figure 6(B) provides a visual comparison of model performance across Accuracy, F1-Score, and AUC. The Bagging model demonstrated the highest overall performance, achieving the highest Recall (1.000), strong Precision (0.955), and the best F1-Score (0.977), indicating its ability to balance sensitivity and precision effectively. Random Forest and XGBoost also showed consistent superiority across metrics, confirming their reliability in this binary classification task.
Table 2 further supports these findings with precise numerical comparisons. Logistic Regression, Random Forest, and Bagging all reached identical Accuracy levels (0.968), while Logistic Regression yielded perfect Precision (1.000) but had slightly lower Recall (0.952), indicating a tendency toward conservative prediction. In contrast, Bagging achieved perfect Recall (1.000), which may be advantageous for clinical applications where minimizing false negatives is critical.
Among the ensemble methods, Bagging and XGBoost consistently outperformed AdaBoost, which had the lowest Accuracy (0.919) and F1-Score (0.941). ANN also demonstrated competitive results, particularly in Recall (0.976), suggesting potential value when incorporated into hybrid decision systems. The ensemble-based models—particularly Bagging and Random Forest—exhibited the most robust and stable predictive performance across all evaluation metrics. These results underscore the feasibility and reliability of machine learning algorithms in assisting with the binary classification of adrenal lesion malignancy, providing a solid foundation for clinical decision support tools.
Fig. 6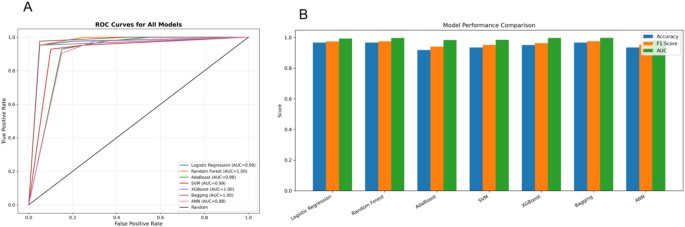
Model performance comparison using ROC and evaluation metrics. A Receiver Operating Characteristic (ROC) curves for seven classification models: Logistic Regression, Random Forest, AdaBoost, Support Vector Machine (SVM), XGBoost, Bagging, and Artificial Neural Network (ANN). All models demonstrate high predictive ability, with AUC values ranging from 0.98 to 1.00. B Bar plot comparison of Accuracy, F1 Score, and AUC across the seven models, showing that ensemble methods (Random Forest, XGBoost, Bagging) consistently achieve top performance across all metrics
Table 2 Comparison of machine learning models for predicting adrenal lesions on benign or malignantClinical utility assessment via decision curve analysis
Furthermore evaluate the clinical applicability of each predictive model for distinguishing benign from malignant adrenal gland lesions, we conducted Decision Curve Analysis (DCA), as illustrated in Fig. 7. DCA estimates the net benefit of a model across a continuum of threshold probabilities, thereby quantifying its value in clinical decision-making beyond traditional accuracy-based metrics.
Across a wide range of clinically relevant threshold probabilities (10%–90%), ensemble-based models—particularly Random Forest, XGBoost, and Bagging—demonstrated superior net benefits. Their performance consistently exceeded both the “Treat All” and “Treat None” strategies, indicating that these models offer more favorable risk-benefit trade-offs when guiding decisions about lesion management. This supports their utility in clinical scenarios where accurately identifying malignancy is essential to optimizing patient outcomes while minimizing overtreatment.
Logistic Regression, SVM, and Ada-Boost also exhibited favorable and stable net benefit profiles, especially within the lower-to-intermediate threshold range (10%–60%). These models may therefore be appropriate in more conservative or risk-averse clinical settings, where the cost of false positives is acceptable in exchange for minimizing false negatives.
In contrast, the Artificial Neural Network (ANN) showed a marked decline in net benefit beyond the 70% threshold, accompanied by instability in curve behavior. This suggests potential limitations in its use for high-confidence clinical decisions, particularly in cases requiring stringent thresholding to justify intervention.
Notably, the XGBoost and Bagging models maintained the highest net benefit across nearly the entire decision threshold spectrum. Their consistent out-performance underscores their robustness and potential for integration into real-world diagnostic workflows.
In summary, the DCA results confirm that Random Forest, Bagging, and XGBoost not only yield high predictive performance but also deliver the greatest clinical value in distinguishing benign from malignant adrenal lesions. These models are thus well-suited to serve as decision-support tools in clinical practice, where optimizing diagnostic precision is paramount.
Fig. 7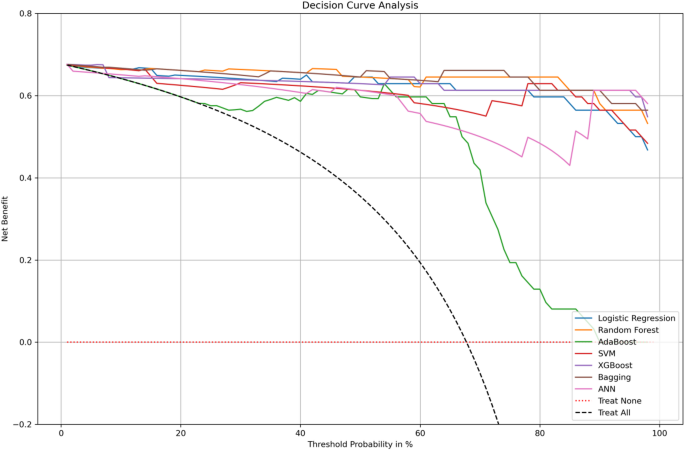
Decision curve analysis (DCA) comparing the net clinical benefit of different classification models across a range of threshold probabilities. The y-axis represents the net benefit, and the x-axis represents the threshold probability at which a patient would opt for treatment. Models shown include Logistic Regression, Random Forest, AdaBoost, Support Vector Machine (SVM), XGBoost, Bagging, and Artificial Neural Network (ANN). The “Treat All” and “Treat None” strategies are included as reference baselines (dashed lines)
Model explanation using SHAP analysis
This study also gain insight into the interpretability and internal decision logic of the machine learning model, SHAP (SHapley Additive exPlanations) analysis was performed. Figure 8 provides a comprehensive evaluation of both the global and instance-level feature contributions to model output.
Figure 8-A presents the mean absolute SHAP values for each predictor, reflecting their average impact on the model’s decision. The feature Adrenal gland lesions SUVmax emerges as the most influential variable, with a mean SHAP value of + 2.31, indicating its dominant role in distinguishing between benign and malignant adrenal lesions. This is followed by Tumor plain scan CT value (+ 1.54) and T/L SUVmax ratio (+ 1.13), both of which also show substantial contributions. Features such as Gender, Tumor diameter, and Liver SUVmean exhibit moderate influence, while Age has the lowest importance, suggesting minimal contribution to the predictive outcome.
Figure 8-B offers a summary SHAP plot, which captures not only the magnitude but also the directional effect of each feature on model predictions. The x-axis represents SHAP values (i.e., impact on the model output), while the color gradient encodes feature values from low (blue) to high (red). This dual encoding allows for interpretation of how specific feature ranges affect classification. Key observations include: Adrenal gland lesions SUVmax: Low values (blue) strongly increase SHAP scores toward the positive class, suggesting a strong association with malignant outcomes. High values (red) are associated with lower SHAP scores, aligning with benign classifications. Tumor plain scan CT value: Higher CT values (red) correspond to positive SHAP values, indicating association with malignancy. T/L SUVmax ratio: Low ratios (blue) decrease the SHAP value (toward benign), while high ratios increase it, supporting its role as a malignancy marker. Liver SUVmean and Tumor diameter: Exhibit more dispersed SHAP distributions, with mixed impact depending on value range. Gender: Shows a modest effect but with notable separation, potentially reflecting imbalanced class associations. Age: Demonstrates limited impact across all SHAP values, reinforcing its weak discriminative power.
The SHAP results provide robust evidence of feature importance and directionality, complementing the model’s statistical performance with clear clinical interpretability. These findings underscore the significance of SUV-based imaging markers and CT attenuation values as key predictors in differentiating adrenal lesion malignancy.
Fig. 8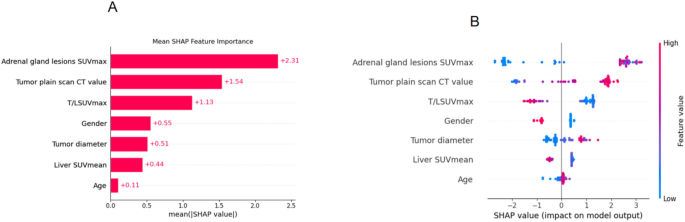
A The bar chart shows the mean absolute SHAP values for each feature, representing their average contribution to the model’s prediction of adrenal lesion malignancy. Features with higher SHAP values are more influential. B The SHAP summary plot visualizes the distribution and direction of each feature’s impact. Each point represents an individual patient sample. The x-axis indicates whether the feature pushes the prediction toward benign (left) or malignant (right). The color scale reflects the actual feature value: red for high values and blue for low values. For example, lower adrenal SUVmax (blue) tends to be associated with malignancy in our dataset, while higher CT values (red) also contribute to malignancy prediction. This plot helps visualize nonlinear effects and variable interactions on the model output.
Dependence and interaction effects
Regarding to elucidate the model’s nonlinear behavior and inter-feature dependencies, SHAP dependence plots were generated for the seven most influential variables (Fig. 9). These plots provide a nuanced view of how each feature individually—and in interaction with others—affects the prediction of adrenal lesion malignancy. Adrenal gland lesions SUVmax: A clear threshold effect is observed. While SUVmax above ~ 1.5 contributes minimally, values below this threshold sharply increase SHAP values, strongly influencing malignancy predictions. This effect is further modulated by liver SUVmean, highlighting the relevance of background metabolic activity. Tumor plain scan CT value: Demonstrates a strong and consistent positive SHAP response to increasing CT values, especially under higher T/L SUVmax conditions, reinforcing the interaction between anatomical density and metabolic intensity. T/L SUVmax ratio: Shows a monotonic relationship with SHAP value—higher ratios are consistently predictive of malignancy. Interaction with tumor diameter suggests that metabolic significance is partially size-dependent. Gender: Although a categorical variable, gender displays distinct SHAP value separation, with metabolic ratio (T/L SUVmax) further differentiating the effect, hinting at sex-specific biological patterns. Age: Exhibits a mild positive relationship with malignancy risk, especially in larger tumors, again suggesting size-age synergy. Liver SUVmean and Tumor diameter: Both reveal discrete transitions in SHAP values—rather than gradual trends—indicating the presence of threshold behavior in decision logic.
Overall, the dependence plots reinforce the dominance of Adrenal SUVmax, CT value, and T/L SUVmax as primary drivers of prediction. Moreover, the color-coded interaction overlays uncover clinically relevant combinatorial effects, thereby enhancing model transparency and interpretability. These findings support the feasibility of incorporating such models into diagnostic workflows for adrenal lesion risk stratification.
Fig. 9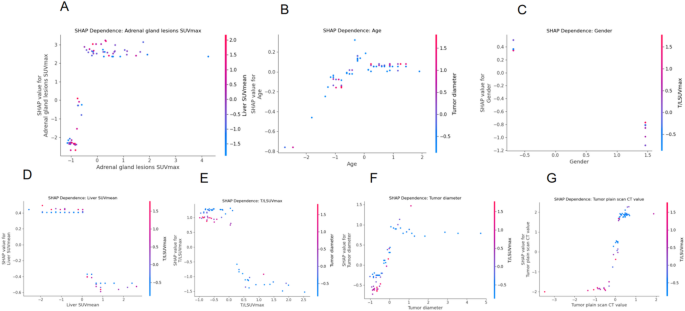
SHAP dependence plots showing nonlinear and interaction effects among key predictors.Each subplot (A–G) illustrates the relationship between a specific feature’s value (x-axis) and its SHAP value (y-axis), which indicates the feature’s contribution to predicting malignancy. A higher SHAP value means the feature is pushing the model toward predicting malignancy.The color of each point represents the value of a second interacting feature, helping to reveal interaction effects. For example, in (A), lower adrenal SUVmax is associated with higher SHAP values (malignancy), and the liver SUVmean (color gradient) modulates this relationship. These plots help explain the nonlinear behavior of features and their combined impact on prediction, making the model more interpretable to clinicians
Subgroup analysis: discriminating lung cancer from lymphoma in malignant adrenal lesions
Following the successful development of models for distinguishing benign from malignant adrenal lesions, we further refined our analysis by focusing solely on the malignant cases. Specifically, we aimed to differentiate between two common types of adrenal malignancies: lung cancer metastases and lymphoma. Accurate discrimination between these sub-types holds significant clinical relevance, as therapeutic strategies and prognoses differ substantially. To address this, a secondary dataset was constructed comprising only malignant cases, with the target variable (Primary stove) indicating either lung cancer (coded as 3) or lymphoma (coded as 4). A new binary classification task was thus established, and the complete machine learning pipeline was reapplied to evaluate model performance, interpretability, and clinical utility.
Feature selection via LASSO regularization
Identify the most relevant features for subclass classification is very important, this study applied LASSO logistic regression. The regularization path plot showed progressive coefficient shrinkage as the penalty increased, while 5-fold cross-validation identified the optimal lambda minimizing binomial deviance. Seven features were retained in the final model: Adrenal gland lesions SUVmax, Adrenal gland lesions SUVpeak, T/LSUVmax, Tumor diameter, Tumor plain scan CT value, Liver SUVmean, Age and Gender. These features reflect a combination of metabolic, anatomical, and demographic characteristics, suggesting that both localized uptake and systemic parameters contribute to subtype differentiation, as shown in Fig. 10.
Fig. 10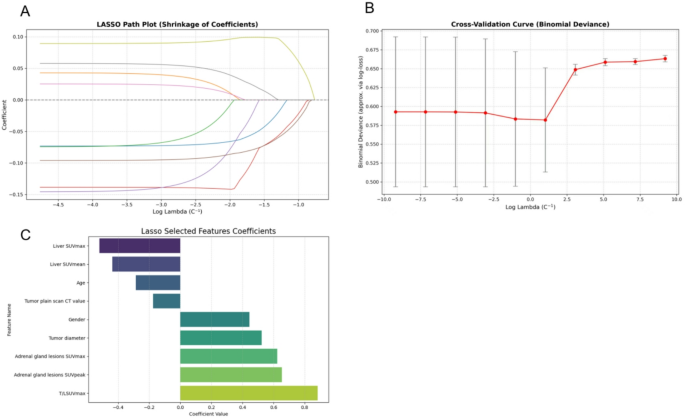
LASSO-based feature selection for subclassification of malignant adrenal lesions (lung cancer vs. lymphoma). A LASSO coefficient path illustrating the shrinkage of coefficients as the regularization parameter (log λ) increases. B Cross-validation curve showing binomial deviance across different λ values. The optimal λ is selected based on the minimum deviance with the one-standard-error rule. C Coefficients of the features retained by LASSO at the optimal λ. Eight variables were selected, including T/LSUVmax, Adrenal gland SUVmax, SUVpeak, Tumor diameter, Gender, Tumor CT value, Age, and Liver SUV metrics. Notably, T/LSUVmax and Adrenal SUV metrics showed the strongest positive associations with lymphoma classification
Univariate distribution analysis
Figure 11 presents comparative box-plots illustrating the univariate distribution of key imaging and clinical features between patients diagnosed with lung cancer and those with lymphoma. The analysis yields several statistically and clinically relevant observations:
Adrenal gland lesions SUVmax and SUVpeak: Both parameters, indicative of metabolic activity within adrenal lesions, were significantly higher in lymphoma patients. This aligns with the biological behavior of lymphomas, which are generally characterized by higher FDG avidity due to intense cellular proliferation and glycolytic activity. These findings suggest that hypermetabolic adrenal lesions are more likely associated with lymphoma in patients presenting with malignancy.
T/LSUVmax ratio: This ratio quantifies lesion-to-liver contrast and was markedly elevated in the lymphoma subgroup, indicating that the background-normalized metabolic contrast is more pronounced in lymphomatous involvement. This supports the clinical utility of the T/L ratio in improving the discrimination of highly metabolic lesions.
Tumor plain CT value: Lung cancer patients tended to exhibit higher non-contrast CT values, suggesting that metastatic lesions in these cases may present with greater tissue density, possibly due to fibrosis, calcification, or hemorrhagic components. This morphological difference provides an anatomic correlate to the metabolic heterogeneity between subtypes.
Tumor diameter: Although differences in median tumor size between groups were modest, lymphomas showed a wider interquartile range, reflecting variable presentations from bulky disease to small-volume involvement. This heterogeneity is consistent with the known variable burden of lymphoma and may impact classification robustness.
Liver SUVmax and SUVmean: Both parameters were slightly elevated in the lung cancer group, which may reflect systemic inflammatory or paraneoplastic metabolic activation, especially in advanced-stage disease. This trend, though modest, adds context to the differential metabolic background.
Demographics – Age and Gender: Younger age and male gender were more frequently observed in the lymphoma group. This demographic distribution corresponds well with known epidemiological patterns, where certain subtypes of lymphoma (e.g., Hodgkin) have a higher prevalence in young males. These variables, although not strongly predictive individually, may serve as supporting covariates in multivariate modeling.
Fig. 11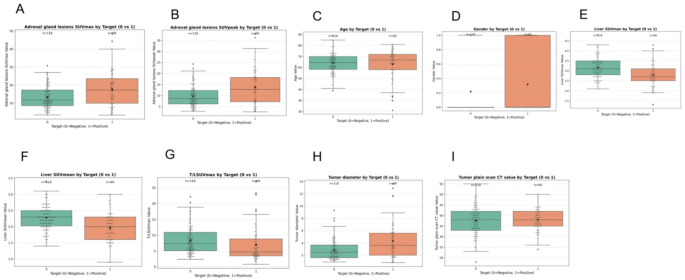
Boxplot Comparison of Feature Distributions Between Lung Cancer and Lymphoma Subgroups. Panels A–I display the distribution of nine key imaging and demographic variables across two diagnostic groups: lung cancer (Target = 0) and lymphoma (Target = 1). A–B Adrenal gland lesions SUVmax and SUVpeak. C–D Age and Gender. E–F Liver SUVmax and SUVmean (G) T/LSUVmax ratio. H Tumor diameter. I Tumor plain scan CT value
Model construction and performance comparison
To differentiate between lung cancer and lymphoma among malignant adrenal lesions, this study constructed and evaluated a series of supervised machine learning classifiers based on imaging-derived features and clinical variables. The input features included quantitative PET/CT parameters such as adrenal SUVmax, SUVpeak, T/LSUVmax, liver SUVmean and SUVmax, tumor diameter, and plain CT value. These were selected using LASSO regression, while age and gender were retained to account for potential demographic confounding.
Seven classifiers were developed and tuned using stratified cross-validation, including logistic regression, random forest, AdaBoost, support vector machine (SVM), XGBoost, bagging, and artificial neural network (ANN). This comprehensive modeling strategy ensured both linear and nonlinear decision boundaries were considered, capturing a wide range of decision-making patterns.
Performance was first evaluated using ROC curves. As shown in Fig. 12A, ANN achieved the highest area under the curve (AUC = 0.887), indicating excellent ability to distinguish between the two malignancy sub-types. SVM followed with an AUC of 0.854, and logistic regression also demonstrated strong discrimination (AUC = 0.833), underscoring the predictive strength of the selected features even within a linear modeling framework. In contrast, Ada-Boost showed the lowest AUC (0.756), possibly due to overfitting or sensitivity to sample imbalance.
A more detailed comparison of model performance is provided in Fig. 12B; Table 3, which report metrics including accuracy, precision, recall, F1-score, and AUC. ANN consistently outperformed all other models, with the highest accuracy (0.816), precision (0.870), recall (0.833), and F1-score (0.851). SVM also exhibited strong and balanced performance, while logistic regression offered a desirable trade-off between accuracy (0.737) and interpretability. Bagging and Ada-Boost, although part of ensemble methods, yielded relatively lower performance across most metrics, suggesting limited benefit in this dataset.
While ANN provides the best predictive performance, its complex structure hinders transparency, which may reduce its acceptability in clinical practice. In contrast, models like logistic regression and random forest, although slightly less accurate, provide intuitive interpretability and decision logic, which are critical for clinical integration. These results suggest that while ANN and SVM are highly effective for sub-type classification, simpler models remain valuable for transparent clinical deployment. The optimal model choice may thus depend on the specific diagnostic scenario and the balance between accuracy and interpretability required for real-world application.
Fig. 12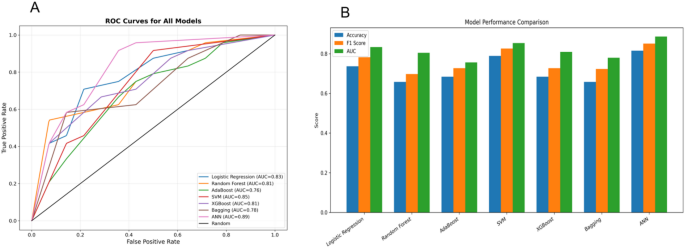
Performance comparison of machine learning models for classifying lung cancer vs. lymphoma. A Receiver operating characteristic (ROC) curves for all eight models evaluated. B Bar plots showing Accuracy, F1-score, and AUC for each model
Table 3 Comparison of machine learning models for predicting distinguishing benign from malignant adrenal lesionsClinical utility evaluation by decision curve analysis (DCA)
To assess the clinical relevance of predictive models, decision curve analysis (DCA) was employed, which estimates the net benefit of each model by balancing true positives against false positives across a continuum of clinical threshold probabilities. This approach simulates real-world decision-making conditions and allows comparison of model utility in guiding diagnostic or therapeutic actions. As illustrated in Fig. 13, the artificial neural network (ANN), support vector machine (SVM), and XGBoost consistently yielded higher net benefits across a broad range of thresholds (10% to 80%), indicating their strong clinical applicability in scenarios involving diagnostic uncertainty for adrenal malignancies. Compared to baseline strategies such as “Treat All” or “Treat None,” all machine learning models demonstrated superior net benefit, reinforcing the advantage of algorithmic triage. Notably, the ANN model sustained its performance even at higher threshold probabilities, suggesting robustness under conservative decision thresholds. While ANN demonstrated the highest overall utility, SVM and XGBoost also offered favorable performance with potentially lower computational costs and better interpretability, making them attractive alternatives for institutions with limited resources or a higher need for model transparency.
Fig. 13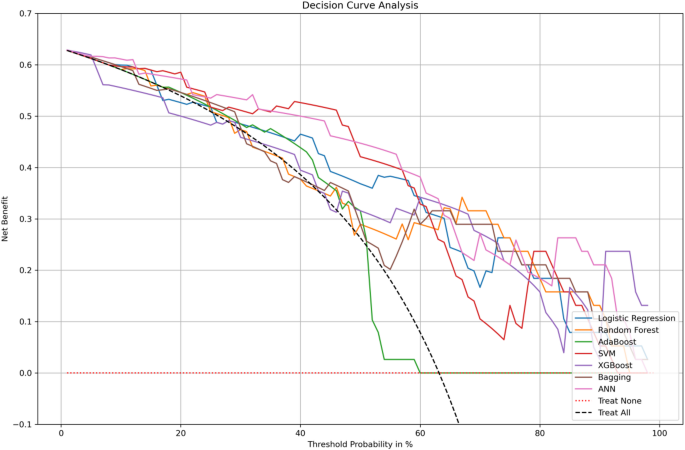
Decision curve analysis (DCA) for clinical utility evaluation of classification models. This plot illustrates the net clinical benefit of various predictive models across a range of threshold probabilities (0–100%). The y-axis represents the net benefit, and the x-axis indicates the threshold probability at which a clinician would choose to intervene
SHAP-based interpretability analysis
SHAP (SHapley Additive exPlanations) analysis was conducted on the ANN classifier to enhance transparency and interpretability of the model’s decision-making process. As shown in Fig. 14. This approach quantifies the marginal contribution of each feature to individual predictions, allowing insight into how specific variables drive classification outcomes. The analysis revealed that adrenal SUVmax was the most influential predictor, with elevated values significantly increasing the likelihood of lymphoma. SUVpeak and T/LSUVmax also ranked among the top contributors, further highlighting the importance of metabolic activity in distinguishing lymphoma from lung cancer within adrenal lesions. Conversely, higher liver SUVmax and SUVmean were more commonly associated with lung cancer, potentially reflecting systemic inflammatory responses or liver uptake characteristics related to pulmonary primary tumors. These inverse associations were clearly evident in the SHAP value distributions. The tumor plain CT value demonstrated a moderate but complex contribution, with its predictive impact varying depending on interactions with adrenal SUV metrics, suggesting it serves a complementary role rather than a primary determinant. Demographic variables, including age and gender, showed weaker yet consistent effects, improving overall model calibration when integrated with imaging-derived features. Finally, the mean SHAP importance rankings confirmed the dominance of adrenal SUVmax, T/LSUVmax, and SUVpeak, reinforcing their central role in model behavior and clinical interpretation.
Fig. 14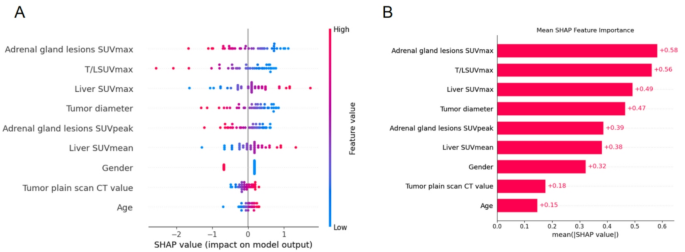
SHAP Analysis for Interpreting Model Predictions. A SHAP summary plot showing the distribution of feature effects on individual predictions. Each dot represents a sample, and color indicates the magnitude of the feature value. B Mean SHAP values quantifying the global importance of each feature
Local feature dependence analysis based on SHAP
To further elucidate the non-linear influence of individual variables and their interactions on the model’s predictions, SHAP dependence plots were generated for each of the selected features, as shown in Fig. 15. These plots illustrate the relationship between feature values and their corresponding SHAP contributions, with a second variable encoded by color to reveal potential feature interactions. Among all predictors, adrenal lesion metabolic indicators—namely SUVmax and SUVpeak—exhibited the strongest positive SHAP values, with higher metabolic uptake consistently pushing predictions toward the lymphoma category. The observed color gradients further indicate that elevated SUVpeak values amplify the effect of SUVmax, reflecting a synergistic interaction between the two features in characterizing metabolically active lesions. T/LSUVmax, a composite lesion-to-liver contrast metric, showed a sharp non-linear increase in its SHAP contribution once a normalized threshold was exceeded, emphasizing its threshold-like behavior in distinguishing lymphomas.
In contrast, liver SUVmax and SUVmean were negatively associated with lymphoma prediction, indicating that greater background hepatic uptake favors lung cancer classification, potentially reflecting systemic metabolic activation. Age and gender exerted relatively smaller effects, but still showed meaningful patterns: younger male patients tended to be classified as lymphoma, and age displayed a U-shaped SHAP distribution modulated by other variables such as T/LSUVmax. Additionally, tumor diameter and plain CT value contributed modestly to model output. Smaller tumor sizes were linked to negative SHAP values, while higher CT densities shifted predictions toward lung cancer, consistent with denser metastatic morphology. Overall, these dependence analyses underscore that the model not only relies on individual feature magnitudes but also captures their complex interactions. The interpretability afforded by SHAP enhances transparency in decision-making and supports the biological plausibility of the identified predictive patterns.
Fig. 15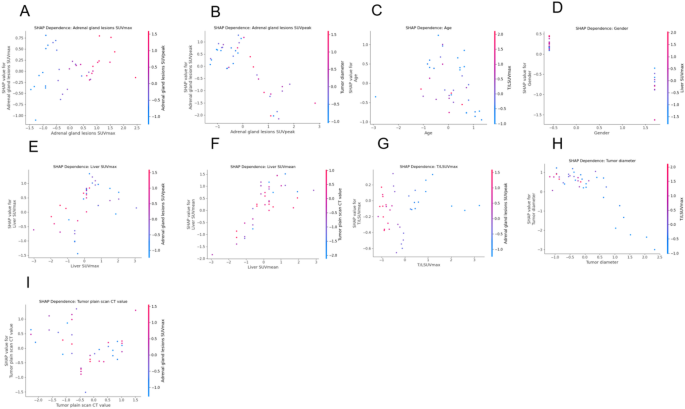
SHAP dependence plots of selected predictors. Each subplot (A–I) displays the SHAP dependence plot for one of the selected features in the ANN model. The x-axis represents the standardized feature value, and the y-axis shows the SHAP value (i.e., the feature’s contribution to model output). Color gradients represent a second interacting feature to reveal potential feature interactions