
Sample characteristics
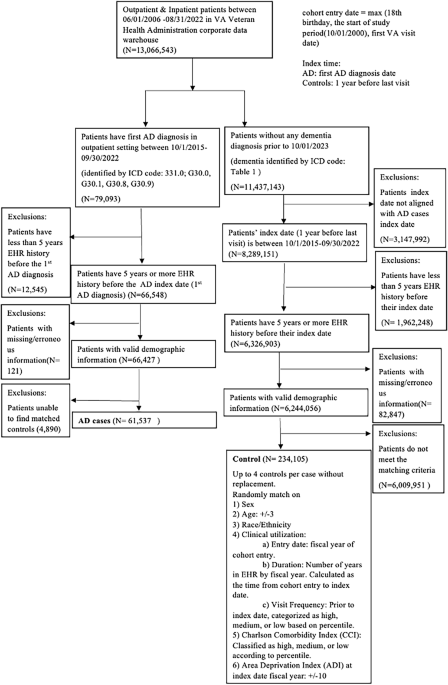
The CP-I cohort includes 61,537 AD cases (1,143 [1.9%] women; mean [SD] age at AD onset, 79.9 [8.7] years) and 234,105 controls (3486 [1.5%] women; mean [SD] age at index date, 79.6 [8.8] years), with an overall AD prevalence of 20.8%. Detailed demographic and clinical characteristics are shown in Table 1.
Table 1 Demographics of the CP-I cohort with AD cases having at least one ICD-based diagnosis
The CP-II cohort was derived from the CP-I cohort and consists of 35,308 AD cases (705 [2.0%] women; mean [SD] age at AD onset, 79.0 [8.4] years) and 145,198 matched controls (2,150 [1.5%] women; mean [SD] age at index date, 78.6 [8.6] years), with an overall AD prevalence of 19.6%. Detailed characteristics of the CP-II cohort are shown in Table 2.
Table 2 Demographics of the CP-II cohort with AD cases having at least two AD diagnosis code, one of which is from specialty clinicsKeywords related to SCD and AD dementia are more frequently mentioned in longitudinal EHRs of AD cases compared to controls
Examining the CP-I cohort, we found more frequent keyword mentions in AD cases than controls. AD patients had an average of 308.5 keywords from 62.4 notes, spanning 14.7 years of their EHR history compared with controls who had 175.8 relevant keywords from 43.2 notes, spanning 13.5 years. We calculated the average number of mentions for each keyword group (Supplementary Fig. 2). Overall, AD cases consistently show higher mentions across all keyword groups compared to controls, indicating a greater prevalence of these issues in AD cases. Physiological changes and neuropsychiatric symptoms are the most frequently mentioned categories for both AD cases and controls. Consistent with established findings22, AD cases in our study had almost six times the average mentions of cognition-memory issues compared to controls, underscoring the significant memory challenges faced by AD patients.
Keywords related to SCD and AD dementia show accelerated increase patterns in the EHRs of AD patients 15 years leading up to diagnosis
Using data from the CP-I cohort, we found that within 15 years leading up to the first AD diagnosis, the number of keywords related to SCD and AD dementia in the clinical notes of AD patients increased exponentially—from 9.4 to 57.7 keywords per patient per year. In contrast, during the same period, the number of such keywords in the notes of control patients increased linearly, from 8.2 to 20.3 (Fig. 3). This exponential increase in AD patients was also evidenced when examining only primary care notes (Supplementary Fig. 3). In addition, we expected that patients with AD dementia symptoms or SCD would have more frequent physician visit than those without such symptoms, and thus the AD cases would have more notes with SCD and AD dementia-related keywords than the controls. To account for this potential bias, we normalized keyword frequency by the note number, and it showed similar patterns (Fig. 4). The pattern remained consistent across different ages at diagnosis (Supplementary Fig. 4) and showed little variation when stratifying the patient cohort by sex (Supplementary Fig. 5) and ethnicity/race (Supplementary Fig. 6).
When examining the patterns for keyword categories, the results indicated that AD cases exhibited a more rapid increase in SCD and AD dementia-related keyword groups compared to controls across all categories (Supplementary Fig. 7). However, the difference between the groups was more pronounced for some groups than others. For groups, such as cognition-memory, cognition-learning/perception, and neuropsychiatric symptoms, the cases had a sharp increase, while the controls remained relatively stable. For groups, such as physiologic changes, cognition-speech/language, and assistance needed, both cases and controls had a noticeable increase, but the cases still had a much higher rate of increase than the controls.
Similar patterns were observed in the CP-II cohort. The number of SCD and AD dementia-related keywords in clinical notes for AD patients increased exponentially from 10.0 to 65.1 per patient per year, while for control patients, the increase was linear, from 8.7 to 22.0 (Supplementary Fig. 8).
To better understand how symptom patterns manifest across different care settings, we compared the keyword frequencies across grouped note types. Due to data sparsity in certain categories, we aggregated notes into broader, clinically meaningful groups to ensure statistical reliability: Primary; Emergent Care (emergency visits); Mental Health (psychiatry, psychology, mental health clinics); Cognitive Specialty (memory clinics, neurology, neuropsychology, cognitive care); Geriatric Services (geriatrics, HBPC); and Consultation Services (consults, compensation & pension examinations). As shown in Supplementary Fig. 9, all note types exhibited increasing keyword trends among AD cases in the years preceding diagnosis. Mental health and geriatric service notes showed the highest average keyword counts and the steepest increases in the final 2–3 years, suggesting their key role in documenting late-stage symptom emergence. In contrast, primary care notes displayed a relatively high baseline and gradual increase beginning as early as 15 years prior to diagnosis (Supplementary Fig. 3), underscoring their importance in capturing early, longitudinal indicators. These findings highlight the complementary roles of generalist and specialist care settings in the documentation of prodromal AD symptoms. We also included the distribution of note types by specialty in the case and control cohorts in CP-I cohort in Supplementary Fig. 10.
Across all plots, an inflection point was observed around two years prior to diagnosis, prompting additional analyses of both SCD and AD dementia-related keyword frequencies and clinical note volume across Years 3, 2, and 1. As shown in Supplementary Fig. 11, all symptom categories exhibited increasing trends, with neuropsychiatric symptoms showing the steepest rise between Year 2 and Year 1—indicating a sharp escalation in behavioral and psychological symptom documentation. Physiological changes also increased during this period, while learning/perception and memory-related terms showed smaller but consistent gains. We further analyzed note volume by specialty (Supplementary Fig. 12) and found that geriatrics and cognitive care clinics showed the largest relative increases between Year 2 and Year 1, reflecting intensifying care needs and diagnostic attention. These findings highlight the clinical significance of the Year 2 inflection point and the parallel escalation in both symptom documentation and healthcare utilization.
To assess the specificity of our symptom-based findings, we conducted an additional analysis using a curated set of dermatologic-related control keywords—terms commonly documented in clinical practice but not associated with AD dementia. The list included general symptoms (e.g., itching, rash), localized findings (e.g., skin lesion, ulcer), and dermatologic diagnoses (e.g., eczema, cellulitis), selected through a targeted review of clinical sources and screened for clinical relevance, EHR frequency, and independence from AD-related pathology (Supplementary Box 2). As shown in Supplementary Fig. 13, the average number of dermatologic-related keywords, normalized by note count, remained largely similar between AD cases and controls over time. This supports the interpretation that the observed temporal patterns in AD dementia-relevant keywords are not driven by general documentation trends or nonspecific symptom reporting.
Machine learning models based solely on SCD and AD dementia-relevant keywords from EHR notes can predict AD onset up to 10 years in advance
Existing work primarily utilized structured EHR data like medications, ICD codes, and abnormal lab measurements for AD prediction18, we evaluated the predictive performance of a random forest model using three distinct feature sets: (1) structured clinical features only (i.e., medications, ICD codes, and abnormal lab measurements), (2) keyword-derived features extracted from unstructured clinical notes, and (3) a combination of structured and keyword-based features.
The RF models in Setting I under random split produced the following results. Using only structured EHR features, the model achieved an AUROC of 0.497 at −10 years and 0.682 at −1 day, with corresponding AUPRCs of 0.371 and 0.571 on the CP-I cohort (Table 3). When using only keyword-derived features, the model substantially outperformed the structured-data-only approach, achieving an AUROC of 0.577 at −10 years and 0.861 at −1 day, and AUPRCs of 0.373 and 0.741 on the CP-I cohort (Table 4). Similar improvements were observed in the CP-II cohort, where AUROCs reached 0.598 at −10 years and 0.896 at −1 day. Combining structured features with keyword-derived features provided modest additional gains, with AUROCs increasing to 0.581 at −10 years and 0.867 at −1 day, and AUPRCs to 0.376 and 0.747 on the CP-I cohort (Table 5).
Table 3 Random forest prediction results using structured data features in Setting I on the CP-I cohortTable 4 Random forest prediction results using keyword features in Setting ITable 5 Random forest prediction results using a combination of structured data and keywords as features in Setting I on the CP-I cohort
These results highlight that narrative symptom evidence extracted from unstructured clinical notes offers significant predictive value for early AD detection, even when used independently of traditional structured EHR fields. In addition to reporting results at the boundary time points of 10 years and 1 day before diagnosis, we also evaluated model performance at intermediate intervals of −1 year, −2 years, −3 years, −5 years, and −7 years prior to diagnosis, as detailed in Tables 3–5.
In identifying the informative prediction features, for models using keywords only features on both CP-I and CP-II cohorts, physiological changes and neuropsychiatric symptoms are generally the most important predictors at earlier prediction time points. In contrast, memory and cognitive learning/perception become more significant as the diagnosis approaches Supplementary Fig. 14. Top features across each time point model in the CP1 cohort included activities of daily living (ADLs), memory, executive function, instrumental activities of daily living (iADLs), attention, anxiety, pain, hearing, comprehension, and communication. The CP2 cohort had similar top decision features (Supplementary Fig. 15, 16).
We also trained models using only primary care notes to evaluate the effectiveness of data from general practitioners, yielding AUROC values from 0.569 (-10 years) to 0.810 (-1 day) and AUPRC values from 0.354 to 0.644 on the CP-I cohort (Table 6).
Table 6 Random Forest prediction results using keywords from primary care notes only and using Setting II (hold-out station 13/130) on the CP-I cohort
The RF models in Setting II of hold-out stations performed similarly to Setting I on the CP-I cohort, with AUROC values from 0.577 (-10 years) to 0.862 (-1 day) and AUPRC values from 0.373 to 0.738. This suggests the models maintained predictive ability across different medical centers (Table 6).
Supplementary Table 4 presents the performance of our baseline models. The RF model consistently outperformed logistic regression and achieved performance comparable to XGBoost. However, XGBoost was less interpretable when applied to sparse keyword features41.
Supplementary Table 5 presents the random forest prediction results using keyword features from different specialty note types in Setting I on the CP-I cohort. Mental Health and Cognitive Specialty notes consistently demonstrated stronger predictive performance across timepoints.
Stratified analysis by subgroups
To identify predictive features for specific populations, we performed stratified analyses by age, sex, and race/ethnicity. We trained models for different time points, focusing on the -1-day model for feature importance analysis due to the sparsity of subgroup populations. The conclusions below are statistically significant under DeLong test with p-value < 0.05. A minimal or no difference means p-value > =0.05 under the DeLong test.
Stratification by age
Age is a well-established risk factor for AD35, so we trained models on different age groups. For the -1-day prediction, performance was slightly lower in patients under 65 (AUROC 0.855) and over 85 (AUROC 0.851) compared to other age groups, though overall differences in performance and feature importance across groups were minimal.
Stratification by sex
Recognizing sex differences in AD risk, we trained models separately for male and female groups. For females, the AUROC was 0.514 (-10 years) and 0.831 (-1 day), with AUPRC of 0.331 and 0.728. For males, the AUROC was 0.583 (-10 years) and 0.861 (-1 day), with AUPRC of 0.380 and 0.740.
Feature importance analysis of the -1-day model revealed sex-specific top predictors. For females, ‘visuospatial ability’ was a top ten predictor, but not for males. Conversely, ‘mood’ was a top ten predictor for males, but not for females. ‘Fluency’ was a top 20 predictor for females, while ‘affect’ was for males (Supplementary Fig. 17).
Stratification by race/ethnicity
We stratified the cohort by race/ethnicity and trained separate models. For white patients, AUROC was 0.579 (-10 years) and 0.862 (-1 day), with AUPRC of 0.367 and 0.740. For Black/African American patients, AUROC was 0.564 (-10 years) and 0.867 (-1 day), with AUPRC of 0.343 and 0.763. ‘Pain’ was a top ten predictor for white patients, while ‘getting lost’ was prominent for Black/African American patients. In the top 20 predictors, ‘affect’ and ‘memory’ issues were significant for white patients, whereas ‘delusions’ and ‘incontinence’ were significant for Black/African American patients (Supplementary Fig. 18).
The model trained on Non-Hispanic/Latino patients achieved an AUROC of 0.570 (-10 years) and 0.865 (-1 day), with AUPRC of 0.365 and 0.742. For the Hispanic/Latino cohort, AUROC was 0.633 (-10 years) and 0.873 (-1 day), with AUPRC of 0.465 and 0.760. Analysis of feature importance of the -1-day model, ‘communication’ and ‘pain’ were among the top ten predictors for the Non-Hispanics/Latinos but not for the Hispanics/Latinos, while ‘getting lost’ and ‘hearing’ were among the top ten predictors for Hispanics/Latinos but not for Non-Hispanic/Latinos. Additionally, ‘remembering’, ‘visuospatial ability’, ‘depression’, and ‘affect’ were among the top 20 predictors unique to Non-Hispanic/Latino patients, whereas ‘incontinence’, ‘wandering’, ‘delusion’, and ‘language’ were among the top 20 predictors unique to Hispanic/Latino patients (Supplementary Fig. 19).