
The study was approved by the Ethics Institutional Review Boards of the First Affiliated Hospital of Sun Yat-sen University and complied with all relevant ethical regulations regarding human participants (2024SQXB001234 and [2024]341). Human glioma tissues were collected at the Department of Neurosurgery of the First Affiliated Hospital of Sun Yat-sen University with informed consent from the donors. Approximately 0.5–1 cm3 glioma tissues from each of five patients were used for HiChIP. Glioma cell lines LN229, U251 and U87 were used for H3K27ac HiChIP.
Cell culture
The glioma cells (LN229, U251 and U87) and HEK293T were cultured in Dulbecco’s modified Eagle medium (DMEM, Gibco) supplemented with 10% foetal bovine serum (AusGeneX) and 1× Pen Strep (ThermoFirsher), the medium was changed every 2 days and cells were passaged using trypsin–EDTA (0.25%) (Gibco).
Cell fixation
Primary tissues were mechanically disrupted, prepared as a single-cell suspension and cross-linked by 1% paraformaldehyde (Gibco, methanol-free). The glioma cell lines LN229, U251 and U87 were digested with trypsin before cross-linking reactions. Specifically, 1 × 10⁷ cells were cross-linked for 10 min with rotation. Then, 125 mM glycine was added to quench the formaldehyde for 5 min and incubated on ice for 20 min to stop cross-linking completely. Cells were pelleted and washed with cold phosphate-buffered saline (PBS), pelleted again, snap-frozen in liquid nitrogen for 5 min and stored at −80 °C or immediately processed for the HiChIP protocol.
HiChIP library construction
The HiChIP protocol was performed as described with modifications20,53. In brief, 1 × 10⁷ cross-linked cells were digested using 400 U MboI (NEB) in 37 °C with rotation (900 rpm) for 16 h. MboI (NEB) was heat-inactivated at 65 °C for 20 min. Then, 15 mM biotin14-d-ATP (Invitrogen) was added, and restriction-cut ends were ligated using 4,000 U T4 DNA ligase (NEB). For sonication, we kept the sonication constant at eight cycles for different amounts of cell starting material and preclearing with 60 μl Protein A beads (Gibco). The 300–700-bp genomic DNA was incubated with 7.5 μg H3K27ac antibody (Abcam) at 4 °C overnight with rotation. The next day, the complexes were captured by 60 μl Protein A magnetic beads and washed three times each with Low-Salt Wash Buffer (0.1% SDS, 1% Triton X-100, 2 mM EDTA, 20 mM Tris–HCl pH 7.5 and 150 mM NaCl), High-Salt Wash Buffer (0.1% SDS, 1% Triton X-100, 2 mM EDTA, 20 mM Tris–HCl pH 7.5 and 500 mM NaCl) and LiCl Wash Buffer (10 mM Tris–HCl pH 7.5, 250 mM LiCl, 1% NP-40, 1% sodium deoxycholate and 1 mM EDTA; make fresh). Washing was performed at room temperature on a magnet by adding 500 μl of a wash buffer, swishing the beads back and forth twice by moving the sample relative to the magnet, and then removing the supernatant. Beads were resuspended in DNA elution buffer. After elution, ChIP samples were incubated with 10 mg ml−1 Proteinase K (YEASEN) 4 h at 55 °C and 65 °C for 3 h. DNA was purified using AMPure XP Beads (Beckman). Streptavidin C1 beads (Invitrogen) were used to capture biotinylated DNA. QIAseq FX DNA Library Kits were used to generate the sequencing library. HiChIP libraries were size-selected to 300–700 bp using AMPure XP beads (Beckman) and subjected to 2× 150-bp paired-end sequencing on Novaseq. Two biological replicates were analysed for each experimental condition.
Quantitative chromosome conformation capture (3C-qPCR)
The 3C-qPCR protocol was performed as described with modifications40. In brief, 1 × 10⁷ cross-linked cells were trypsinized and fixed by 1% formaldehyde in 10 ml of DMEM (Gibco) without foetal bovine serum for 10 min at room temperature. The reaction was quenched with ice-cold glycine. After centrifugation, the pellets were washed three times with 1× cold NEBuffer 3.1 and resuspended in a lysis buffer (10 mM NaCl; 10 mM Tris–HCl, pH 7.5; 0.2% NP-40; 1× protease inhibitor). Before digestion, we incubate the lysed cells in 0.1% of SDS (65 °C, 10 min) to eliminate proteins that are not cross-linked to DNA and open the chromatin for a better and more homogeneous digestion. The tubes were placed on ice immediately after opening the chromatin, and 43 μl of 10% Triton X-100 was added to the Hi-C-tube (423 µl total) to quench the SDS (1% Triton final), then mixed gently by pipetting up and down (avoiding bubbles). Then, 400 U MboI (NEB, R0147M) was used for genomic DNA digestion. The sample tube was incubated at 65 °C for 20 min to deactivate the endonuclease enzyme. The tubes were placed on ice until cooled to room temperature and 665 µl ligation mix (H2O, 242 μl; 5× ligation buffer (Invitrogen), 240 μl; 10% Triton X-100, 120 μl; 10 mg ml−1 bovine serum albumin, 12 μl; T4 DNA ligase (Invitrogen), 50 μl) was added. The samples were then incubated at 16 °C for 4 h in a ThermoMixer with intermittent shaking. After ligation, the nucleic acids were reverse cross-linked and purified by ethanol precipitation. The concentration of ligated DNA samples was measured by SYBR-qPCR, and data were normalized to GAPDH. Sequences for 3C-qPCR primers are listed in Supplementary Table 8.
ChIP-seq
A total of 1 × 10⁷ cells were cross-linked in 1% formaldehyde (methanol free) and quenched as described above at a volume of 20 ml for every one million cells. Cells were cross-linked for 10 min at room temperature with rotation. Samples were incubated 20 min on ice and spun at 2,500g for 5 min. The supernatant was discarded, and pelleted nuclei were washed once with 500 μl prechilled cell lysis buffer (10 mM Tris–HCl pH 8.0, 10 mM NaCl, 0.2% NP-40, 1× protease inhibitors) and then rotated at 4 °C for 30 min. Samples were spun again at 2,500g for 5 min, supernatants were discarded and pelleted nuclei were washed twice with 500 μl of ice-cold ChIP lysis buffer. The volume of pelleted material was brought up to 1 ml in a nuclear lysis buffer (50 mM Tris–HCl pH 7.5, 10 mM EDTA, 1% SDS and 1× protease inhibitors) and incubated for 5 min at room temperature. Samples were then divided equally into three parts, sheared for ten cycles (30 s ‘ON’ and 30 s of ‘OFF’) and then spun down at 16,100g for 15 min. Supernatants were collected into new low-adsorption 1.5-ml Eppendorf tubes. Then, 60 μl of Protein A beads for every 107 cells were washed in ChIP dilution buffer and resuspended in 50 μl dilution buffer per tube (100 μl per ChIP). Protein A beads were added to samples, which were rotated 1 h at 4 °C for precleaning. Sample supernatants were then separated using a magnet and transferred into new tubes, and then 7.5 μg H3K27ac antibodies per 107 cells were incubated at 4 °C overnight with rotation. The next day, 60 μl Protein A beads were washed, added to samples and then rotated for 2 h at 4 °C. The beads were washed three times each with Low-Salt Wash Buffer, High-Salt Wash Buffer and LiCl Wash Buffer. ChIP-DNA was de-cross-linked with Proteinase K and purified using AMPure XP beads. According to the instruction document, DNA libraries were generated using an FX DNA Library Prep Kit (QIAGEN).
RT-qPCR
Total RNA was extracted from cells using TRIzol reagent (Life Technologies). cDNA synthesis was performed using a PrimerScript RT reagent kit with gDNA eraser (TaKaRa). Real-time PCR reactions were performed using Hieff qPCR SYBR Green Master Mix (YEASEN) and a Bio-Rad CFX Connect Real-Time system. PCR cycling conditions were as follows: 95 °C for 5 min, 40 cycles of 95 °C for 15 s, 60 °C for 15 s and 72 °C for 30 s. A melting curve of amplified DNA was subsequently acquired. The relative expression of target genes was determined using the comparative CT method and normalized to GAPDH. Sequences for RT-qPCR primers are listed in Supplementary Table 8.
ChIP–qPCR
ChIP–qPCR was performed in WT U251 cells (C/C) and SNP MUT (single-base edited mutant) cells (T/T) to investigate whether the two proteins could bind to the DNA sequence containing SNP rs2297440. A total of 7.5 μg antibody was used to assess the affinity of different mutant forms to the corresponding transcription factors, and the pull-down DNA content was measured by RT-qPCR. Sequences for ChIP–qPCR primers are listed in Supplementary Table 8.
CRISPRi and CRISPRa validation of functional enhancers and genes
For virus production, 5 × 10⁶ HEK293T cells were plated per 10-cm dish (Corning). The following day, plasmid encoding lentivirus was co-transfected with plasmid dCas9-KRAB-MeCP2 (Addgene #122205) or lentiSAMv2 with 2A Blast (Addgene #75112), pMD2.G and psPAX2 (10 μg each) into the cells with Lipofectamine 3000 (Thermo Fisher) according to the manufacturer’s instructions. The supernatant was changed to fresh medium 12 h after transfection, and supernatant containing viral particles was collected 48 h after transfection and filtered with a 0.45-μm cell sieve. For lentivirus encoding individual sgRNAs, virus was concentrated tenfold using Lenti-X concentrator (Clontech) and stored at −80 °C.
To generate a glioma cell line expressing dCas9-KRAB-MeCP2 or dCas9-VP64-T2A-Blast, 2 × 10⁶ glioma cells were plated per T25 flask. Twenty-four hours after plating, lentivirus harbouring the dCas9-KRAB-MeCP2 or dCas9-VP64-T2A-Blast was added with polybrene (4 µg ml−1). The medium was changed 12 h after infection and then again 48 h after infection with blasticidin (MedChemExpress LLC) at a concentration of 5 µg ml−1. Blasticidin-resistant cells were selected for 7 days, with the medium changed every other day.
As for sgRNA virus production, the sgRNA annealing program using a thermocycler was set as follows: 37 °C for 30 min, 95 °C for 5 min, followed by a ramp down at 0.1 °C s−1 from 95 °C to 25 °C. The annealed oligos can then be ligated into the plasmid (Adgene#52963, digested by BsmBI, NEB). The resulting sgRNA plasmid or a non-targeting control vector, along with pMD2.G and psPAX2 (10 μg each), were transfected into cells using Lipofectamine 3000 (Thermo Fisher) according to the manufacturer’s instructions. The next steps are same as those for dCas9-KRAB-MeCP2 virus generation.
To generate a glioma cells line expressing sgRNA, 2 × 10⁶ glioma cells harbouring dCas9-KRAB-MeCP2 were plated per T25 flask. Twenty-four hours after plating, lentivirus harbouring the sgRNA or a non-targeting vector plasmid was added with polybrene (4 µg ml−1). The medium was changed 12 h after infection and then again 48 h after infection with 2 µg ml−1 puromycin (MCE) at a concentration of 5 µg ml−1. Puromycin-resistant cells were selected for 7 days, with the medium changed every other day.
CRISPRi screening
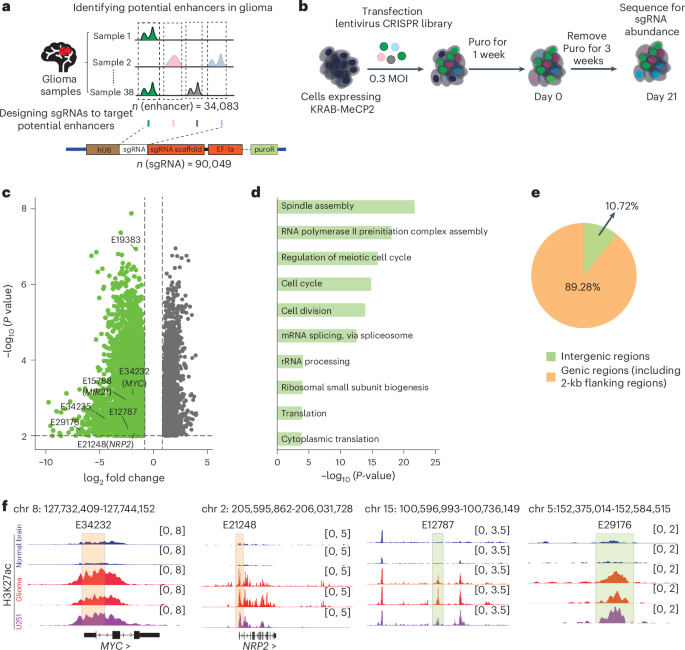
CRISPRi screening was performed as described54,55. As for enhancer sgRNA library design, the bed file containing H3K27ac peaks was called by MACS256,57 from 38 glioma samples (GSE145644) and 3 glioma cell lines (U251, LN229 and U87), and FlashFry58 was used for designing the library that targets enhancers in glioma. In total, 34,083 non-redundant enhancers were targeted by 90,049 sgRNAs. We selected no more than three sgRNAs from each H3K27ac region, with high Hsu2013 scores, high Doench2014 on-target scores and uniform protospacer adjacent motif distance distribution. All 90,049 sgRNAs (containing 539 control sgRNA) were ligated into lentiGuide-Puro to produce the sgRNA library lentivirus.
To establish glioma cell lines stably expressing dCas9-KRAB-MeCP2, U251 cells were infected by lentivirus and cultured with 4 μg ml−1 blasticidin over 1 week. A total of 4 × 10⁷ cells were infected by sgRNA library lentivirus with a multiplicity of infection (MOI) of 0.3. In our study, we performed four independent biological replicates in the U251 cell line for the CRISPRi screen. After 24 h of infection, cells were cultured with 2 μg ml−1 puromycin to select cells stably expressing sgRNAs. After 7 days, 1 × 10⁸ cells were taken as the day 0 group. The other cells were cultured for another 3 weeks; then 1 × 10⁸ cells were collected as the day 21 group. Genome DNAs of day 0 and day 21 were extracted by the NucleoBond HMW DNA Kit. sgRNA libraries were amplified from all genome DNAs by TransStart FastPfu DNA Polymerase, using forward primers: TTGAAAGTATTT+ [8 bp barcode] + GCTTTATATATCTTGTGGAAAGGACGAAACACC, reverse primers: CCACTTTTTCAA+ [8 bp barcode] + CGGACTAGCCTTATTTTAACTTGC, 2.5 μg genome DNA per 50 μl PCR system. The run program was as follows: 98 °C 3 min; 30 cycles, 98 °C 15 s, 55 °C 15 s, 72 °C 15 s; 72 °C 1 min. Bands were cut and collected at 140 bp, and DNA was purified from agarose gel with NucleoSpin Gel and PCR Clean‑up kit. The products were used for sequencing, and sgRNAs were quantified from paired-end reads. To normalized counts unbiasedly, we computed the average of transcription terminate sgRNAs containing poly (~5–7T) as baseline, sgRNA counts were divided by the baseline and the primary screening results were analysed by calculating the fold change of sgRNA compared with the internal control at days 0 and 21.
The impact on specific enhancer regions was evaluated through individual analysis of each sgRNA. The t-test was performed across biological replicates to determine the statistical significance of changes in sgRNA abundance. Pro-tumour enhancers were defined as enhancers targeted by sgRNAs demonstrating significant depletion. Genes that overlap with pro-tumour enhancers were defined as genes near pro-tumour enhancers.
Luciferase reporter assays
Functional analysis of the risk SNP-containing H3K27ac region was performed through a luciferase reporter assay. Specifically, the genomic fragment encompassing the risk SNP locus within the H3K27ac-marked region was PCR-amplified from U251 cell genomic DNA and cloned into the pGL3-Promoter vector (Promega), positioned immediately upstream of the SV40 promoter. This candidate regulatory region was identified on the basis of U251-specific H3K27ac ChIP-seq signals. Site-directed mutagenesis was subsequently conducted using the Fast Mutagenesis System (TRANS) to generate both risk (mutant) and non-risk (WT) alleles at each SNP locus. The constructed reporter plasmids were co-transfected with the pRL-TK Renilla luciferase control vector (Promega) into U251 cells via Lipofectamine 3000 reagent (Invitrogen). After 48-h incubation, cells were collected for dual-luciferase measurement using the Dual-Luciferase Reporter Assay System (Promega). Firefly luciferase signals were normalized to Renilla luciferase internal controls for data standardization.
Western blot
Proteins were collected from U251 WT cells and SOX18-KO cells using RIPA buffer (Beyotime) supplemented with a protease inhibitor cocktail. Sample loading was based on the results of the bicinchoninic acid assay. Proteins were separated by sodium dodecyl sulfate–polyacrylamide gel electrophoresis. Then, they were transferred to polyvinylidene difluoride membranes (Millipore), which were blocked and incubated with SOX18 antibody (Abcam, EPR2837(2), 1:1,000 dilution) or control GAPDH antibodies (Abcam, EPR16891, 1:500 dilution) overnight at 4 °C, followed by secondary antibodies (Abcam, ab288151, 1:2,000 dilution) for 1 h at room temperature. Bands were detected by Image Quant LAS 4000 with an Enhanced Chemiluminescence Kit (Thermo Pierce).
Generation of rs2297440-associated enhancer and SOX18 KOs
For enhancer and SOX18 KO, sgRNAs were designed using an online tool (CRISPick, http://broadinstitute.org/) (Supplementary Table 8). Oligos were synthesized and constructed with the CRISPR–Cas9 KO system following the manufacturer’s instructions. U251 cells were transfected with plasmids containing sgRNAs and plated as single cells in six-well plates. Then, 2 μg ml−1 puromycin was added 48 h after transfection to select stable lines. Medium-containing puromycin was changed every 2 days. Enhancer and SOX18 KO cells were verified by agarose gel electrophoresis and DNA sequencing, and KO efficiency was confirmed by RT-qPCR and western blotting.
Generation of rs2297440-mutated cell lines
First, the rs2297440 allele in the WT U251 cell line was identified by PCR and DNA sequencing. It was then determined that rs2297440 is a risk form (C/C) in WT U251 and LN229 cells. sgRNAs (Supplementary Table 8) for site-specific cleavage of genomic targets were cloned into the pSpCas9n(BB)-2A-Puro (PX462) V2.0 vector (Addgene, #62987). To generate independent single-cell-derived knock-in clones containing non-coding variants, 2.5 μg sgRNA vector, 3 μg double-stranded DNA (dsDNA) donor and the cell suspension were combined and transfected using the Lipofectamine 3000 system according to the manufacturer’s instructions. Then, 2 μg ml−1 puromycin was added for 7 days after transfection to enrich transfected cells, and the resulting clones were used for cell type identification. Genomic DNA was extracted and amplified by specific genotyping primers, and PCR products were sequenced.
Xenograft models and bioluminescence tumour tracking
Athymic nude mice (BALB/c nude background, male, 4 weeks old; Beijing Vital River Laboratory Animal Technology) were randomly divided into five animals per group. The mice were housed under a 12-h light/12-h dark cycle at a temperature of 18–24 °C (65–75 °F) with 40–60% humidity. Luciferase-expressing human glioma cell LN229 (3 × 10⁵ cells suspended in 6 μl PBS) were implanted into the frontal lobes of nude mice using a stereotactic apparatus (68801, REWARD). Tumour growth was examined at 9, 18 and 27 days after implantation using bioluminescence imaging (IVIS spectrum in vivo imaging system, PerkinElmer). Animals were euthanized by cervical dislocation when they displayed any symptoms of continuous discomfort, such as severe hunchback posture, decreased activity, apathy, dragging legs or more than 20% weight loss. The Ethics Committee of Sun Yat-sen University Cancer Center and Animal Research Committee of Sun Yat-sen University Cancer Center approved this study.
Overexpression of SOX18 in KO, point-mutated glioma cells
The SOX18 gene sequence was obtained from the UCSC Genome Browser (http://genome.ucsc.edu/index.html), and primers were designed using the NCBI Primer-BLAST tool (https://www.ncbi.nlm.nih.gov/tools/primer-blast/index.cgi).The primers included appropriate restriction enzyme sites and protective bases, and were synthesized by Sangon Biotech. Sequences for primer are listed in Supplementary Table 8. The corresponding DNA fragments were synthesized, and the corresponding sequences were amplified with high-fidelity enzymes, then cloned into the pcDNA3.1 plasmid. U251 cells were transfected with plasmids containing sgRNAs and plated as single cells in six-well plates. Then, 2 μg ml−1 puromycin was added 48 h after transfection to select stable lines. The medium-containing puromycin was changed every 2–3 days. After collecting RNA from the cells, reverse transcription and RT-qPCR were performed to detect the expression of SOX18.
CRISPRa of MEIS1 in glioma
As for overexpression of MEIS1 in glioma cells in situ, three gRNAs for endogenous gene repression were selected to bind within −50 to +200 bp around the gene transcription start site (TSS), unless a different position was specified. Sequences for gRNAs are listed in Supplementary Table 8. The U251 cells stably expressing dCas9–VP64 were transfected with lentivirus expressing each gRNA; 48 h later, the medium was replaced with fresh medium with 2 μg ml−1 puromycin for 7 days. The medium-containing puromycin was changed every 2–3 days. After collecting RNA from the cells, reverse transcription and RT-qPCR were performed to detect the expression of MEIS1 and SOX18.
MTT and colony formation assays
For the 3-(4,5-dimethylthiazol-2-yl)-2,5-diphenyl tetrazolium bromide (MTT) assay, 2 × 10³ cells were seeded in 96-well plates for 12 h (as day 0), 24 h (1 day), 48 h (2 days), 72 h (3 days) or 96 h (4 days). After cell culture, 20 μl of 5 mg ml−1 MTT (Sigma-Aldrich) was added to each well and incubated for 4 h at 37 °C. The plate was then gently shaken 30 s on a plate shaker at room temperature, and the optical density (OD) was measured at 490 nm. For colony formation assays, 500 cells were seeded into six-well plates for 10 days, stained with crystal violet and washed three times with PBS. The number of cell clones was determined using ImageJ59.
GSC sphere formation assays
A total of 0.5 × 10⁴ U251 or LN229 cells were cultured in serum-free neural stem cell medium consisting of DMEM–F12 (Gibco) supplemented with 20 ng ml−1 recombinant human epidermal growth factor (MCE), 20 ng ml−1 recombinant human basic fibroblast growth factor (MCE), 1× B27 supplement (Gibco), 1× GlutaMAX (Gibco) and 1% penicillin–streptomycin (Gibco). Cells were maintained in ultra-low-attachment six-well flasks (Corning) at 37 °C in a humidified 5% CO2 incubator. After 7 days, the spheres with a diameter greater than 80 μm were collected and digested using StemPro Accutase (Thermo Fisher) for 5 min at 37 °C, followed by filtration through a 40-μm cell strainer to remove cell aggregates. Viable cells were counted using trypan blue exclusion and seeded at a density of 0.5 × 10⁴ cells per well in six-well ultra-low attachment plates (Corning) with 200 μl of complete DMEM–F12 (Gibco) medium per well. Cells were cultured for 7 days, with half-medium changes every 2 days to replenish growth factors. GSC spheres with a diameter greater than 80 μm in each well were counted.
HiChIP data processing
HiChIP paired-end reads were aligned to the human genome (hg38) using the HiC-Pro pipeline60. The default settings were used to assign reads to MboI restriction fragments, filter out invalid interactions and generate binned interaction matrices. Valid read pairs of individual samples were merged for each cell line. The resulting interaction matrices were normalized using the Knight–Ruiz matrix balancing method. The normalized interaction maps were visualized using Juicebox (v2.20.00)61. Interaction loop calling was performed using hichipper62. We set a false discovery rate threshold of 0.1 and required that each loop be supported by at least two paired-end tags to ensure the reliability of the results. Diffloop (v1.3.4) was used to systematically assess changes in enhancer loops between glioma and normal brain samples63. Glioma-specific loops were defined as those exhibiting significant signal changes in glioma compared with normal brain, with a P value <0.1 and a log2(fold change) >1. The genomic coordinates for pro-tumour enhancers and glioma-specific loop anchors were intersected with bedtools64. For glioma-specific loops in which one anchor overlapped a pro-tumour enhancer, the gene located within 2 kb the either anchor was assigned as a putative target.
RNA-seq
Total RNA was extracted from cells using TRIzol reagent (Life Technologies), and DNA was removed with DNase I (Thermo Scientific). Total RNA (5 μg) was used for RNA-seq library preparation. Hisat2 (v2.2.1)65 was used to map reads to the hg38 genome. Samtools (v1.18) was used to process the alignment bam files. The number of reads mapped to genes was determined with htseq-count66. Genes with a mean count number <2.5 were filtered out. DESeq2 was used to analyse differentially expressed genes. Genes with expression log2(fold change) of ≥1 or ≤−1 and a P < 0.05 were considered to show significantly changed expression. DAVID (https://david.ncifcrf.gov/tools.jsp) was used for GO analysis.
Motif analysis
The JASPAR database67 was used to predict transcription factor binding to risk and non-risk alleles. DNA sequences 30 bp upstream and downstream of the rs2297440 variant were extracted, and the ‘SCAN’ option in JASPAR was used to predict transcription factor binding. Binding scores were compared between the T and C allele forms.
Statistics and reproducibility
Statistical analyses of the data were conducted as described in the respective figure legends. All results from representative experiments were collected at least three times independently. No statistical methods were used to predetermine sample sizes. No data were excluded from the analysis. Data distribution was assumed to be normal, but this was not formally tested. Data collection and analysis were not performed blind to the conditions of the experiments.
Reporting summary
Further information on research design is available in the Nature Portfolio Reporting Summary linked to this article.