
Research design
This is a cross-sectional study, which aimed to investigate the PA and SB patterns of Tibetan and Han adolescents aged 12–18 years in Lhasa, Xizang Autonomous Region. Objective measurements were used to assess these behaviors, and ethnic differences between Tibetan and Han adolescents were compared.
Participants
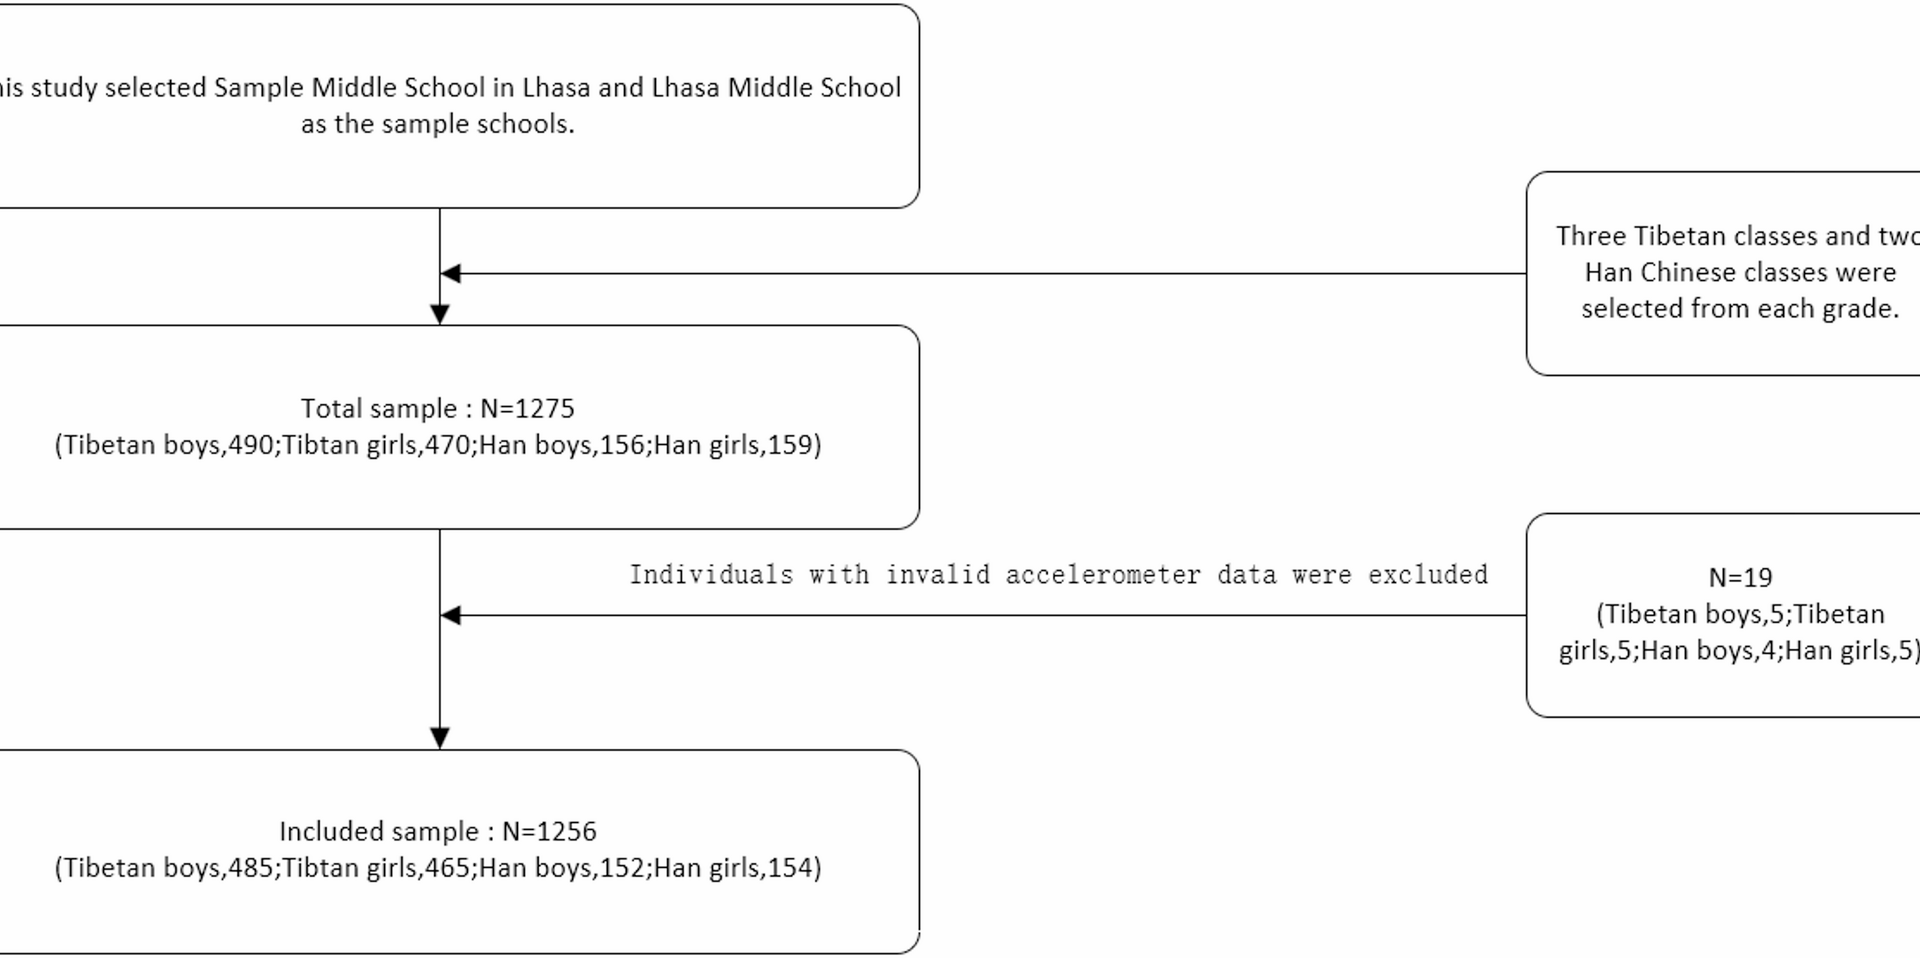
Figure 1 shows the process diagram for the inclusion and exclusion of participants. This study was conducted in Lhasa from June to December 2020. Using convenience sampling, the Eighth Middle School of Lhasa and Lhasa Middle School were selected as study sites. Subsequently, a random cluster sampling method was employed to randomly select several classes of Tibetan and Han students from each grade to recruit participants. Considering that the ratio of Tibetan to Han students in these schools was approximately 3:1, to prevent sample size imbalance, three Tibetan classes and two Han classes (which had fewer students) were randomly selected from each grade.
Fig. 1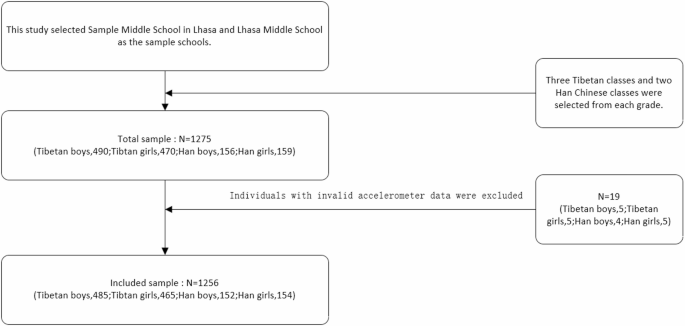
Participant Inclusion and Exclusion Process Diagram
The inclusion criteria were as follows: enrollment in junior or senior high school; aged between 12 and 18 years; in good health with no physical disabilities; and voluntary participation with written informed consent provided by parents. After enrollment, participants were provided with accelerometers and questionnaires to assess daily PA, SB, and socioeconomic status (SES). Anthropometric measurements were also recorded.
A total of 1,275 students were initially recruited. After validity checks of the accelerometer data, 19 participants with invalid data were excluded, yielding a final sample of 1,256 students: 485 Tibetan boys, 465 Tibetan girls, 154 Han Chinese boys, and 152 Han Chinese girls. The management and quality control of accelerometer data were overseen by Dr. Sun Yi.
MeasuresPA and SB measurement
PA and SB were objectively assessed using ActiGraph GT3X + triaxial accelerometers (ActiGraph, Pensacola, FL, USA). Participants were instructed to wear the device continuously for seven consecutive days (five school days and two weekend days), removing it only for sleeping, swimming, and bathing. The accelerometer was positioned on the right hip, with data collected in 5-second epochs. Data collection began at 9:00 AM on the day of distribution and ended at 9:00 AM on the seventh day, after which all devices were retrieved by the investigators. Raw data were downloaded and processed using ActiLife software (version 6.10.2).
Data were deemed valid based on the following criteria: (1) a minimum of two valid weekdays and one valid weekend day; and (2) at least 600 min of wear time per day [19].
The Evenson cut-point classification method [20] was applied to categorize activity intensity levels, with thresholds defined as follows: SB (0-100 counts per minute [cpm]), LPA; 101-2,295 cpm), moderate PA (MPA; 2,296-4,011 cpm), and vigorous PA (VPA; ≥4,012 cpm). A threshold of 20 min was used to distinguish prolonged sedentary bouts; sedentary periods exceeding this duration were identified as PSB [21]. These cut-points have been validated in previous research and demonstrate high reliability and validity in assessing PA levels among children and adolescents [22].
The monitoring period was further categorized into four distinct temporal segments: weekdays versus weekends, and school hours versus out-of-school hours on weekdays. Weekdays were defined as Monday through Friday, and weekends included Saturday and Sunday. For middle school students, school hours spanned 9:00 to 18:00, with out-of-school hours defined as 18:00–24:00 and 0:00–9:00. For high school students, school hours were from 8:00 to 22:00, with out-of-school hours defined as 22:00–24:00 and 0:00–8:00.
It should be noted that although the Xizang Autonomous Region is geographically located in the sixth time zone (approximately two hours behind Beijing, which is in the eighth time zone), the entire country operates on Beijing Standard Time. Therefore, local students’ rest schedules are adjusted in accordance with natural daylight patterns to accommodate the geographical environment.
Body mass index (BMI)
Height measurements were obtained following standardized protocols. Participants stood barefoot on a stadiometer base plate with their backs against the vertical column. They were instructed to maintain an upright posture with their torso straight and head positioned in the Frankfort horizontal plane. Measurements were recorded in centimeters, precise to one decimal place, with a tolerance of ± 0.5 cm.
Body weight was measured with participants wearing light clothing and standing barefoot on the center of a calibrated weighing platform. Participants were instructed to stand naturally and maintain a stable posture. Weight was recorded in kilograms, precise to one decimal place, with an accuracy of ± 0.1 kg.
After obtaining height and weight measurements, BMI was calculated using the formula: BMI = Weight (kg)/Height (m)2.
Socioeconomic Status (SES)
In this study, family SES was assessed using a questionnaire[the questionnaire guide can be found in Supplementary Document 1] that measured parental education level, parental occupation, and household income, following the method outlined by Guo et al. [23]. Parental education was scored based on the number of years of schooling completed. Parental occupation was classified according to the International Standard Classification of Occupations (ISCO). Household monthly income was categorized into four income brackets; each assigned a score: ≤2,000 RMB = 2 points; 2,001–5,000 RMB = 5 points; 5,001–8,000 RMB = 8 points; 8,000 RMB = 10 points.
The collected data underwent screening and transformation, with missing values addressed appropriately. All variables were standardized before performing principal component analysis to derive the composite SES score.
Statistical analyses
The normality of the data was evaluated using histograms and Q-Q plots, which confirmed that the data followed a normal distribution. Consequently, a one-way analysis of covariance was conducted to examine ethnic differences in PA and SB patterns between Tibetan and Han Chinese adolescents, with age, BMI, SES, and accelerometer wear time included as covariates. All statistical analyses were performed using IBM SPSS Statistics version 23.0 (IBM Corp., Armonk, NY, USA). The significance level was set at p < 0.05. Effect sizes were interpreted according to established benchmarks: small (η2 ≤ 0.01), medium (0.01 < η2 ≤ 0.06), and large (η2 > 0.14) [24].