
This study used a cross-sectional design.
Participants
The sample size was determined using G*Power, with a power (1 − 𝛽) of 0.80, an alpha level of 0.05, an effect size difference of 0.8, and a ratio of healthy participants to those with LBP of 1:1.25. Forty-two participants were required, with 19 and 23 in the control and LBP groups, respectively. To account for potential dropouts and missing data, we recruited 20 healthy individuals and 25 individuals with LBP, aged 20 to 50 years, through poster advertisements at our university. To qualify for participation, individuals with recurrent non-specific LBP needed to have experienced at least two instances of LBP within a year, each lasting at least 24 h, situated above the gluteal folds and below the 12th thoracic vertebra, and severe enough to interfere with work, leisure activities, or sports participation [16, 17]. At the time of testing, participants with recurrent LBP were required to be in a pain-free state from their LBP symptoms, with a Numerical Rating Scale (NRS) score of 0. Exclusion criteria encompassed the presence of red flags (such as spinal tumours or neoplastic diseases, infections, inflammatory diseases, and fractures); vestibular or neurological conditions; psychiatric, rheumatological, and/or cardiac diseases; signs of radiculopathy, lumbar spinal stenosis, or spondylolisthesis; a history of fractures or lumbar injuries resulting from trauma, such as falls; and any history of surgery on the spine or hip joints. The Ethics Committee at Kawasaki University of Medical Welfare granted approval for this study (approval number: 23–024). The study was conducted in accordance with the Declaration of Helsinki. Written informed consent was obtained from all participants.
LBP and disability assessment
Pain severity experienced over the past week were assessed using an NRS from 0 (‘no pain’) to 10 (‘worst possible pain’). Current LBP-related interference with activities of daily living was assessed using the Oswestry Disability Index, a 10-item questionnaire with scores ranging from 0 to 100 [18], with higher scores indicating greater disability.
Proprioceptive postural control test
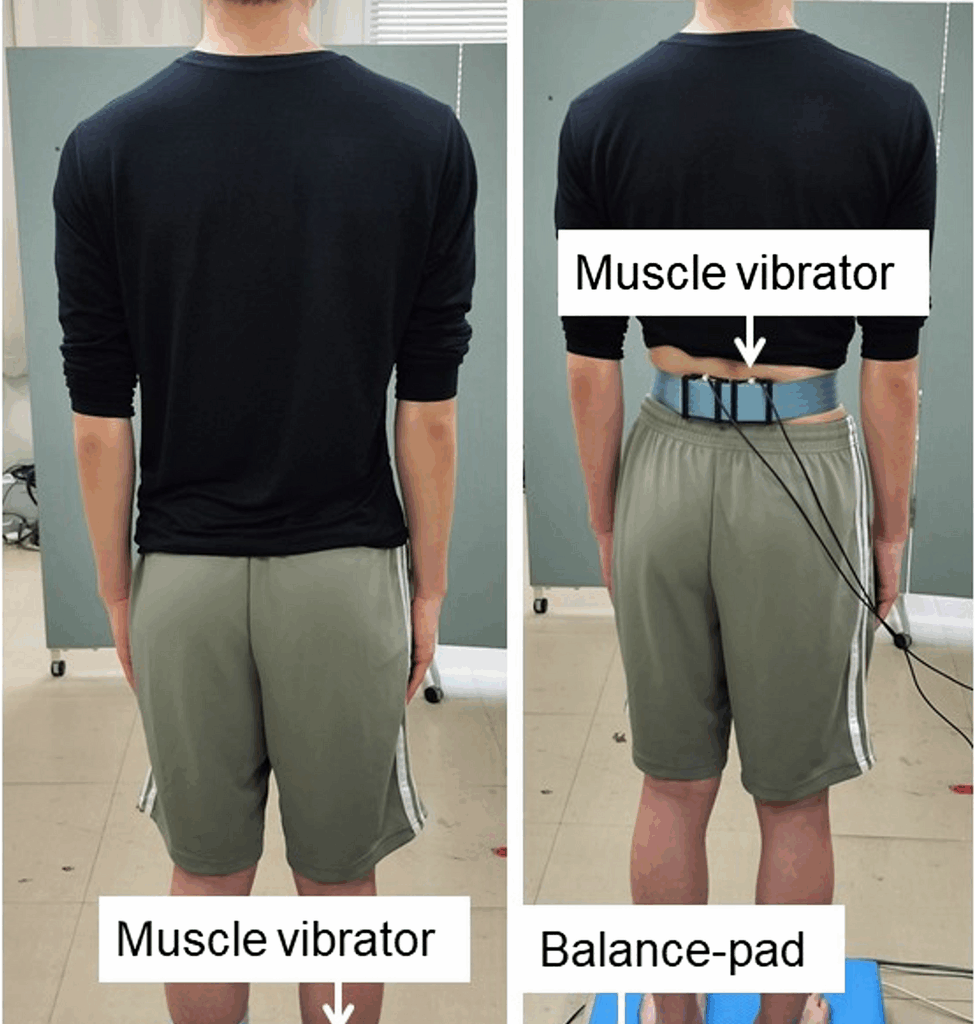
Muscle vibration, which stimulates the Ia afferents, was used to directly investigate the function of proprioception in maintaining posture [19]. Two muscle vibrators (MD-0105; Asahi Seisakusho, Tokyo, Japan) were attached to both sides of the triceps surae and lumbar multifidus muscles. The lumbar multifidus muscles and triceps surae are involved in multi-segmental and ankle strategies, respectively [6]. The vibration amplitude was approximately 0.5 mm. The vibration frequency was set at 60 Hz, which created the illusion of muscle-lengthening and joint movement [20]. A greater directional sway is expected when the CNS uses vibrating muscle signals for postural control.
For the proprioceptive postural control assessment, a force plate (T.K.K 5810; Takei Scientific Instruments Co., Niigata, Japan) was used to evaluate the characteristics of postural sway. The force plate data were sampled at a frequency of 100 Hz. The participants stood barefoot on a balance pad (AMB-ELITE; AIREX Co., Switzerland) placed on a force plate with their arm to the side. Both heels were separated by 10 cm, and the participants were instructed to wear blindfolds. To create an unstable support surface and reduce the reliability of ankle proprioceptive signals, a balance pad was employed (Fig. 1). This condition required the CNS to rely more on other proprioceptive inputs to maintain posture [21]. Muscle vibrations began 15 s after the start of the test and continued for 15 s.
Fig. 1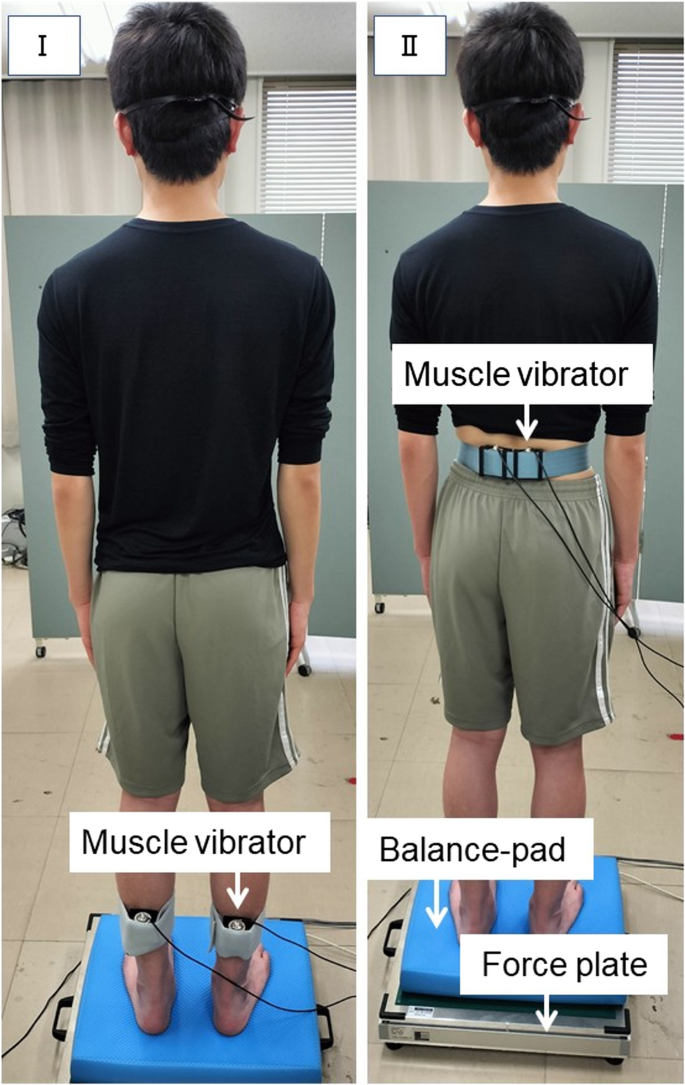
Proprioceptive postural control test I, triceps surae vibrations; II, lumbar multifidus vibrations
The centre of pressure (COP) displacements collected from the force plate were analysed in two epochs: 15 s before muscle vibration and 15 s during muscle vibration. Negative values indicate backward displacement of the COP, and positive values indicate forward displacement. The sway path length, which is the total length of the COP that moved during each epoch, was also analysed. Relative proprioceptive weighting (RPW) was calculated using the following equation:
$$\mathrm{RPW}\;=\;(\mathrm{absolute}\;\mathrm{TS})/(\mathrm{absolute}\;\mathrm{TS}\:+\:\mathrm{absolute}\;\mathrm{MF})$$
Here, ‘absolute TS’ refers to the absolute value of the mean COP displacement in the anterior–posterior direction during triceps surae vibration, subtracted by the absolute value of the mean COP displacement during the pre-vibration period. The ‘Absolute MF’ represents the absolute value of the mean COP displacement in the anterior–posterior direction during multifidus vibration minus the absolute value of the mean COP displacement in the pre-vibration period. An RPW value of 0 signifies complete dependence on multifidus proprioceptive signals, whereas an RPW value of 1 indicates full reliance on proprioceptive signals from the triceps surae [11, 22]. The proprioceptive postural control test was performed once.
Trunk muscle activation pattern during lifting task
Following the protocol established in our previous study [14], participants performed a lifting task using a 5-kg box, repeated three times. Standing upright, the participants held a 5-kg box on a table in front of them, with their elbows fully extended and shoulders flexed at 40°, using both hands. A pressure sensor, synchronized with an electromyograph, was positioned at the base of the box to detect when it was lifted off the table. An indicator bar was set up to limit shoulder flexion to 90°. Upon the activation of a diode lamp at eye level, the participants swiftly raised the box to a 90° shoulder flexion, while keeping the elbows extended (Fig. 2). This final posture was held for 3 s. Participants practiced lifting several times before the test. During the lifting task, electromyography (EMG) data were recorded using a wireless surface electromyograph (Logical Product Inc., Fukuoka, Japan) with a pair of Ag-AgCl surface electrodes at a sampling frequency of 1000 Hz. The skin was cleaned with alcohol, sanded, and shaved, if necessary. The electrodes were placed 2.5 cm apart in the direction of the muscle fibres over the following muscles [9]: lumbar multifidus, erector spinae (ES), transversus abdominis/internal abdominal oblique (TrA/IO), external oblique (EO), and anterior deltoid. For electromyographic recordings, electrodes were placed as follows: for the lumbar multifidus, along a line from the posterior superior iliac spine to the L1–L2 interspace, at the level of the L5 spinous process; for the ES, two finger widths lateral to the L1 spinous process; for the TrA/IO, 2 cm inferior and medial to the anterior superior iliac spine; for the EO, 15 cm lateral to the umbilicus; and for the anterior deltoid, one finger width distal and anterior to the acromion. In the control group, electrodes were placed on the right side, while in the group with recurrent LBP, they were positioned on the side where pain had been more intense during previous episodes.
Fig. 2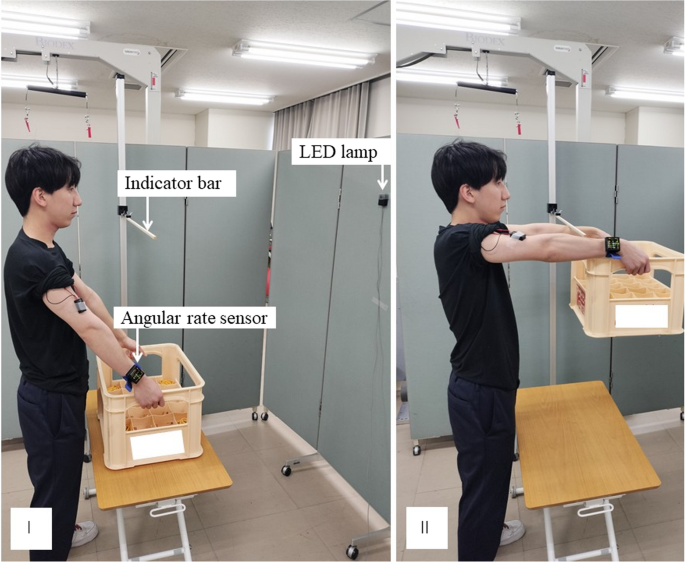
Lifting task after receiving the visual signal, the participants quickly lifted the box until they reached 90° of shoulder flexion. I, initial position; II, end position
An angular rate sensor (MVP-RF10; Microstone, Japan) attached to the wrist was used to assess the peak angular velocities of shoulder movement during lifting. The data on angular velocity were collected at a frequency of 1000 Hz.
For EMG data, raw data were processed using the BIMUTAS-Video software (Kissei Comtec Inc., Nagano, Japan) with full-wave rectification and band-pass filtering from 20 to 500 Hz. The EMG amplitudes were averaged over a 3-s period starting when the box was lifted off the table. The average amplitude was normalised to the maximum voluntary contraction (MVC). Participants performed 3-s MVCs of the trunk muscles against manual resistance. For the EO and TrA/IO, MVC trials were conducted in the supine position, during which participants isometrically rotated their trunk to the left and right sides, respectively, against resistance [23]. For the lumbar multifidus and ES, MVC trials were performed in the prone position, with participants extending the trunk against resistance [23].
After normalisation, we combined the amplitudes of the multifidus, ES, TrA/IO, and EO muscles to evaluate the overall activity of the trunk muscles using the following equation [14]:
$$\mathrm{Overall}\;\mathrm{activity}\;\mathrm{of}\;\mathrm{the}\;\mathrm{trunk}\;\mathrm{muscles}\:=\:\mathrm{multifidus}\;\mathrm{activity}\;(\%\mathrm{MVC})\:+\:\mathrm{ES}\;\mathrm{activity}\;(\%\mathrm{MVC})\:+\:\mathrm{TrA}/\mathrm{IO}\;\mathrm{activity}\;(\%\mathrm{MVC})\:+\:\mathrm{EO}\;\mathrm{activity}\;(\%\mathrm{MVC})$$
The onset of muscle activation was identified by visually observing when the EMG rose above the baseline and remained elevated for at least 50 ms [24]. In cases where visual analysis made it challenging to pinpoint the onset, the amplitude surpassed 2 standard deviations from the baseline level [25]. The following formula was used to determine when the trunk muscles activated in relation to the anterior deltoid, the prime mover [26,27,28]:
$$\mathrm{Relative}\;\mathrm{onset}\;\mathrm{of}\;\mathrm{trunk}\;\mathrm{muscle}\;\mathrm{activation}\:=\:\mathrm{onset}\;\mathrm{of}\;\mathrm{trunk}\;\mathrm{muscle}\;\mathrm{activation}\:-\:\mathrm{onset}\;\mathrm{of}\;\mathrm{anterior}\;\mathrm{deltoid}\;\mathrm{activation}$$
Thus, when the values are negative, it means the trunk muscles activate before the deltoid muscle.
Statistical analyses
Data analyses were performed using SPSS Statistics version 23 (Armonk, USA). Continuous variables are presented as mean ± standard deviation. The Shapiro–Wilk test was used to assess the normality of all continuous variables. To compare the recurrent LBP group with the healthy group on each COP outcome measure during the proprioceptive postural control test, as well as EMG amplitudes and shoulder movement speed during the lifting task, an independent-samples t-test was used. If the data did not follow a normal distribution, the Mann–Whitney U test was used. A multivariate analysis of variance (MANOVA) was conducted to compare the relative onset of trunk muscle activation between groups during the lifting task. When the MANOVA revealed statistically significant results, post hoc analyses were performed using univariate ANOVA. Statistical significance was set at P < 0.05. Spearman’s rank correlation coefficient was used to examine the association between the RPW during the proprioceptive postural control test and the trunk muscle activation pattern during the lifting task.