
Single-cell transcriptomic profiling of PBMCs
Clinical and biochemical characteristics of all DLC patients with sepsis (n = 11, age 44 (29–60) years); w/o sepsis (n = 10, age 48 (22–62) years) were listed in Table S2. Sepsis patients showed a significantly higher levels of total bilirubin, AST levels, INR, PCT, lactate, MELD Na, and creatinine than those w/o sepsis. These patients had lymphopenia with increased neutrophils but decreased monocytes in sepsis patients (our published data)6.
scRNA transcriptomics assay was performed using BD Rhapsody protocol for scRNA sequencing (Fig. 1A), which was further analyzed using R Seurat package version 4.1 (Fig. S1, S2). Percentages of mitochondrial and ribosomal genes per cell were calculated for quality related metrics. Cells with high proportion of mitochondrial and low proportion of ribosomal reads were removed and further regressed out the ribosomal genes data during scaling. Further, the number of genes per sample was calculated post quality check (QC) (Fig. 1B–C) and quality filters were applied on the raw count matrix for case and control to get the final median number of genes/cells in the study groups for further analysis (Fig. 1C).
Fig. 1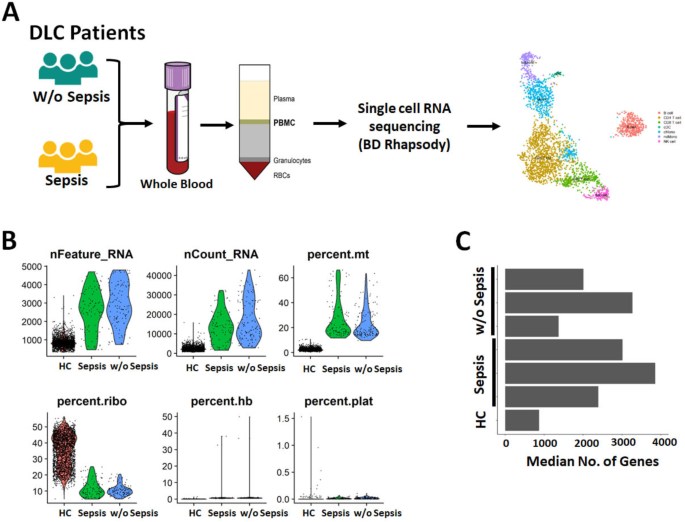
Quality control of scRNA sequencing data. (A) Graphical representation of a scRNA sequencing data in PBMCs of sepsis and without sepsis patients (B) Violin plots depicting nfeature and count RNA, percentage mitochondria, ribosomal, hemoglobin and platelet genes (C) Bar diagram showing median number of genes / cells.
Identification of clusters and cell types in DLC patients
UMAP plots were used to demonstrate dimensionality reduction and clustering, identifying 10 distinct clusters and 7 distinct cell types with differentially expressed genes (DEGs) between the groups.
(Fig. 2A). We found mainly 7 types of immune cells including non-classical (nc) monocytes, classical (c) monocytes, cDCs, CD4 T-cells, CD8 T-cells, NK cells and B-cells in the study groups (Fig. 2B). Classical canonical markers were used to identify each cell types like CD3, CD4, CD8A and CD8B for T cells; CD14, FCGR3A, FCGR3B, HLA-DRA, HLA-DRB1 and HLA-DRB5 for monocytes; LYZ and S100A8 identified activated monocytes and neutrophils; CD19 and MS4A1 for B-cells; NKG7 and GNLY for identifying NK cells population (Fig. 2B,C). A heatmap was produced for each cell type using the top 50 DEGs (Fig. 2D). Clusters 0, 1 and 4 of heatmap represented activated CD4 T-cells and cytotoxic CD8 T-cells and their effector functions; Cluster 2 represented B-cell development and its differentiation; Clusters 3 and 5 represented monocyte development and non-classical monocyte activity; Cluster 6 represented activated NK cells with cytotoxic activity and their memory function while Cluster 9 represented mDCs and cDC2 functions. However, clusters 8, 10, and 11 were not specified with any specific cell type (Fig. 2D).
Fig. 2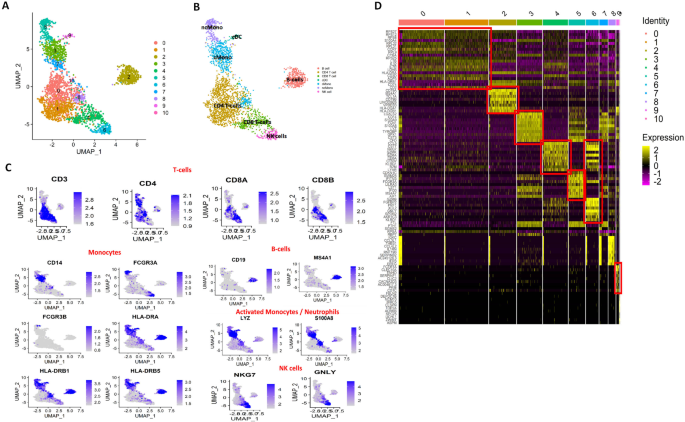
(A, B) UMAP plots representing the distribution of 11 clusters and 7 cell types in three groups – healthy control, sepsis and without sepsis patients (C) Identification of precise cell type using canonical markers for each cell type (D) Heatmap represents the top 50 genes in 7 cell types of clusters.
Identification of altered pathways using transcriptomic signatures in DLC patients with and without sepsis
According to the DEGs, multiple pathways were downregulated in DLC patients with sepsis including NTF4 activated NTRK2 signaling; FMO oxidizes nucleophiles, fatty acids and COX reactions compared to w/o sepsis patients and healthy. While all DLC patients, regardless of sepsis, showed downregulation of O6-Methylguanine-DNA Methyltransferase (MGMT)-mediated DNA damage reversal, mitochondrial transcription termination and melanin biosynthesis compared to HC. While Lactose synthesis, hydroxycarboxylic-acid binding receptors, FGFR1b and FGFR1c ligand binding and activation were significantly increased in all DLC patients (sepsis and w/o sepsis) compared to HC (Fig. 3A).
Fig. 3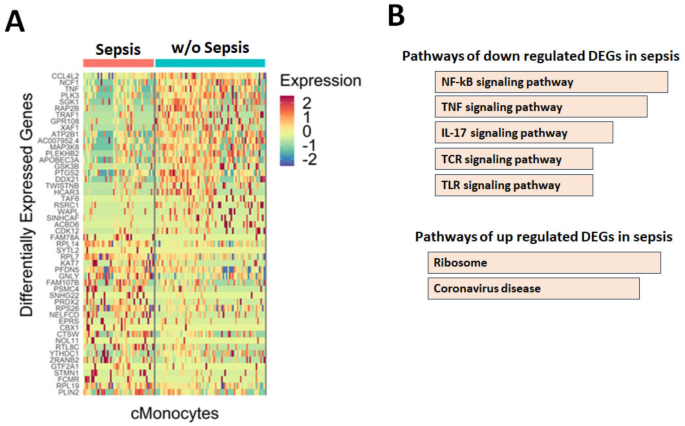
Heatmap represents the significantly enriched pathways after Gene Set Enrichment Analysis (A) healthy control, sepsis and without sepsis patients (B) significantly enriched pathways in immune cells in all three groups (C) mRNA expression of specific genes i.e. 5-HRT3A, TREX-1, HRH-1 and HRH-2 in all subjects. P value was calculated using t- test and p < 0.05 was considered as significant. Heatmaps were generated in R software (ver. 4.2.3, URL: https://www.R-project.org/) using package GSVA R package from Bioconductor repository (ver. 1.46.0) depicting significantly enriched pathways in compared categories47,48.
Furthermore, gene set enrichment analysis (GSEA) was carried out in each cell type. The majority of the cells (NK, B, T cells, cMono, ncMono) showed enhanced downregulation of acetylcholine, alanine metabolism, FGCR1c-Klotho binding ability and FGR3b ligand binding and activation. Particularly, NK cells and ncMono showed decrease in FGFR1c and FGR3b ligand binding and activation pathway while regulation of TREX1, lactose synthesis and serotonin metabolism were significantly increased in ncMono, cMono, cDCs, and B-cells (Fig. 3B). The Heatmaps shown in Fig. 3A,B were generated in R software (ver. 4.2.3, URL: https://www.R-project.org/) using package GSVA R package from Bioconductor repository (ver. 1.46.0) depicting significantly enriched pathways in compared categories. We observed that histamine receptors i.e., HRH-1 and HRH-2; serotonin receptors i.e., 5-HTR3A; DNA repair gene i.e. TREX-1 genes were associated with the activity and functions of monocytes. Further validation was performed using qRT-PCR in sorted monocytes and it was found that TREX-1, HRH-1 and HRH-2 expression was significantly increased in sepsis and w/o sepsis patients compared to HC. However, serotonin receptor 5-HTR3A was significantly enhanced in sepsis compared to HC (Fig. 3C).
Single-cell RNA transcriptomics revealed variations in monocyte subsets in sepsis
As monocytes play a significant role in development of sepsis in DLC patients19,20, therefore we have specifically analyzed DEGs in monocytes including c-mono and nc-mono. Our study found that top 25 genes associated with NF-kB, TNF-α and IL-17 signaling pathways were down regulated in classical monocytes of sepsis patients compared to w/o sepsis group (Fig. 4A,B and Table S3). The Heatmap in Fig. 4A was plotted using Seurat (ver. 4.3.0) function “DoHeatmap()” depicting topmost 25 genes differentially expressed between Sepsis vs. w/o Sepsis group. Further analysis revealed that expression of FGFR2, FGFR3, FGFR3c and FGFR4 were downregulated in w/o sepsis compared to HC, which showed augmented expression in sepsis.
Fig. 4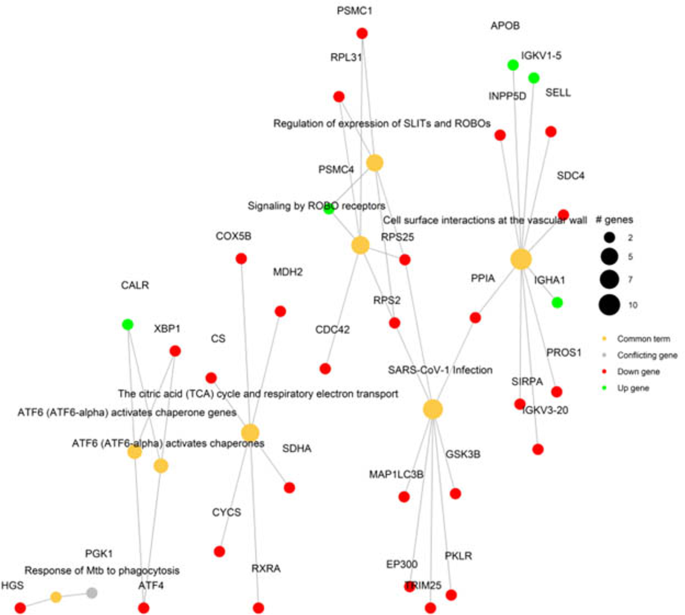
Differentially expressed genes in classical monocytes (cmonocytes). (A) Heatmap represents the top 25 up and down DEGs in classical monocytes (cMono) in sepsis and w/o sepsis patients; (B) Bar plot represents the significantly enriched reactome pathways for up and down DGEs in sepsis cMono. Differential gene expression was performed using the Seurat pipeline with Wilcoxon rank sum test, p value < 0.05 was considered as significant. Heatmap was plotted using Seurat (ver. 4.3.0) function “DoHeatmap()” depicting topmost 25 genes differentially expressed between Sepsis vs. w/o Sepsis group.
In addition to cMono and ncMono, other cell types such as B-cells, NK cells, CD8 T- and CD4 T-cells were also observed inour study groups. The top 25 differentially expressed up and down regulated genes of each cells type in sepsis patients provided information regarding their linked up and down-regulated pathways (Figs. S3–S6).
Many published studies found attenuated response of HLA-DR expression on monocytes in DLC patients with or without sepsis (6, 20 (Fig. S7). As a result, the primaryfocus was on HLA expression on combined both classical (c) and non-classical (nc) monocyte population.
Unique expression of HLA subtypes in sepsis monocytes
Our scRNA transcriptomics data identified 20 HLA subsets (Fig. 5A). HLA-A, HLA-B, HLA-C, HLA-DPA1, HLA-DPB1, HLA-DRA and HLA-DRB1 had upregulated expression while HLA-DMA, HLA-DMB, HLA-DOA, HLA-DOB, HLA-DQA1, HLA-DQA2, HLA-DOB1, HLA-DOB2, HLA-G and HLA-DOB1-AS1 showed decreased expression in all study groups (Fig. S8).
Fig. 5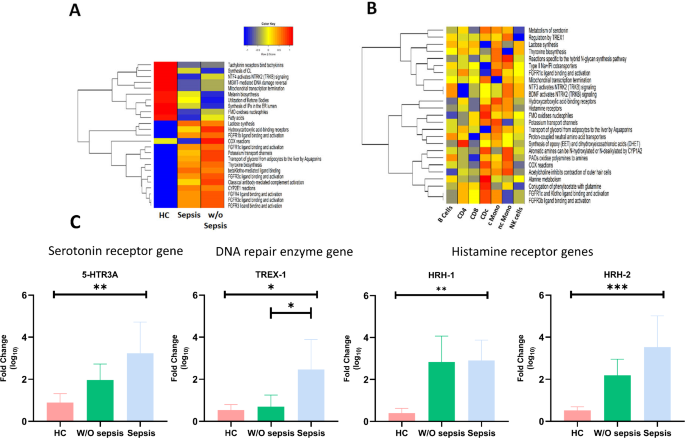
(A) UMAP plot showing the cell types and focusing on classical (blue) and non-classical (purple) cluster; (B) Expression of different HLA subtypes in classical and non-classical monocytes in healthy control, w/o sepsis and sepsis (C) Violin plot of different HLA subtypes in healthy control, w/o sepsis and sepsis.
Further analysis found that overall expression of HLA-C, HLA-E, HLA-DRA and DRB1 were augmented in sepsis and w/o sepsis compared to healthy. HLA-DRB1, HLA-E and HLA-DQB1-AS1 were enhanced in w/o sepsis compared to sepsis and HC. Whereas expression of HLA-C and HLA-DMA were enhanced in sepsis compared to healthy and w/o sepsis but HLA-A, HLA-B and HLA-DQA1 were reduced in sepsis (Fig. 5B). Violin plots of HLA sub-types stated above clearly showed a significant decrease in the expression of HLA_DRB1 (p = 0.042), HLA-DRB5 (p = 0.0037), HLA-F (p = 0.0014) and HLA-DQB1 (p = 0.012) in sepsis compared to without sepsis patients. While both sepsis and without sepsis patients showed significant increase in HLA-DQB1, HLA-A, HLA-B, HLA-C, HLA-E compared to HC (Fig. 5C). HLA-DRB5, HLA-DPA1, and HLA-DPB1 were highly expressed in healthy individuals compared to all DLC patients (sepsis and without sepsis), although HLA-DRA was elevated compared to without sepsis.
RNA-Protein networking revealed genes responsible for Monocytes activity
To uncover the common genes of interest that are competent in restoring cMono activity in DLC patients, both differentially expressed RNA and protein in sepsis and w/o sepsis were further integrated. The RNA-Protein network revealed up- and down-regulated genes involved in multiple processes. PROS1, CDC42, CD62L, FCGR3B, CX3CR1, RPL31, PSMC1, INPP5D, SELL, SDC4, RPS25, PPIA, RPS2, MDH2, COX5B, XBP1, SIRPA, IGKV3-20, CS, SDHA, CYCS, ATF4, RXRA, GSK3B, PKLR, TRIM25, EP300 and MAP1LC3B were downregulated while APOB, IGKV1-5, CALR, and IGHA1 were up-regulated (Fig. 6 and Table S4). The immunological relevance of some of the above down- and up-regulated genes is described in Table S5. Whereas enrichment of protein and RNA data using reactome analysis involving top 5 clusters revealed that binding and uptake of ligands by Scavenger receptors was highly enriched at protein level but RAG1-3, GTPase cycle, VEGFA-VEGFR2 pathway and TNF signaling were strongly enriched at the RNA level (Fig. S9–12).
Fig. 6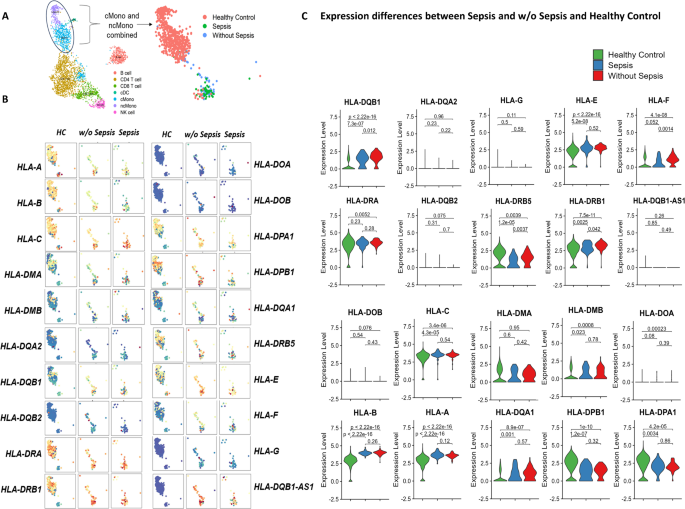
RNA-Protein networking in classical monocytes Common network of protein and RNA data of classical monocytes. Integration of protein and RNA was performed after selecting differentially express proteins/ RNA with p < 0.05.