
Ethics statement
This study included de-identified data from participants who had consented to the use of their anonymized information for research purposes. Participants were not financially compensated for their participation. Approvals for the study protocol of the NHS and the HPFS were granted by the institutional review boards of Brigham and Women’s Hospital and the Harvard T.H. Chan School of Public Health (institutional review board protocol nos. 1999P011114/BWH for the NHS and HSPH 22067-102 for the HPFS).
Study populations
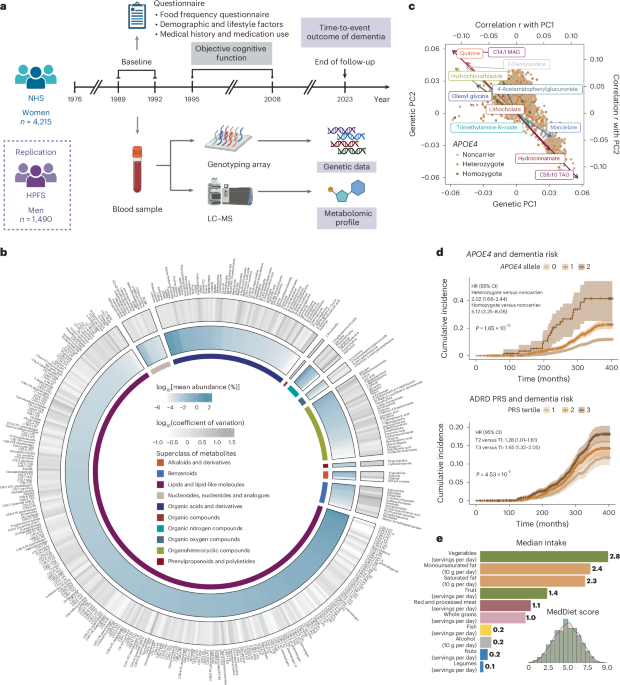
The NHS is a prospective cohort study that enrolled 121,700 US female registered nurses aged 30–55 years in 197655. The participants were followed biennially to collect information on diet, lifestyle, medication use and newly diagnosed diseases through mailed self-administered questionnaires. We included 4,215 women who were aged <75 years and free from dementia, Parkinson’s disease, stroke and cancer at baseline when the blood samples were collected (1989–1992); the blood was assayed for genetics and metabolomics, as described in detail below.
The HPFS is a prospective cohort study that enrolled 51,529 US male health professionals aged 40–75 years in 1986. Similar to the NHS, the participants were followed biennially via mailed questionnaires. We included 1,490 men who met the same inclusion and exclusion criteria at baseline (1993–1996), when the blood samples were collected, as a replication cohort.
Ascertainment of dementia and assessment of objective cognitive function
The participants were followed from the baseline to 2023 for a composite dementia endpoint, which included self-reported dementia and deaths due to dementia. Participants self-reported a physician diagnosis of AD or other forms of dementia (ADRD) every 2 years via questionnaires. Deaths were identified through state vital statistics records, the National Death Index, family reports and the postal system. A study physician reviewed medical records and death certificates to determine whether dementia was listed as the primary or contributing cause of death. Our system for death ascertainment and death cause adjudication is validated and >98% of deaths were identified56.
Objective cognitive function was assessed through a telephone cognitive interview in a subset of 1,037 NHS participants aged ≥70 years, with four telephone interviews conducted between 1995 and 2008. The telephone cognitive battery initially included the TICS, which is a telephone adaptation of the Mini-Mental State Examination57. Five other tests were added later, including (1) immediate recall of the East Boston Memory Test (EBMT), (2) delayed recall of the EBMT, (3) delayed recall of the TICS ten-word list, (4) a test of verbal fluency and (5) the digit span backward test. We assessed three cognitive measures, including the TICS score and the composite scores for global cognition and verbal memory. Global cognition included all six tests. Verbal memory included four tests: immediate recall of the ten-word list in the TICS, delayed recall of the TICS ten-word list and immediate and delayed recalls of the EBMT. To calculate the composite scores for global cognition and verbal memory, we first calculated z-scores for each test at each measurement, based on the baseline mean and the s.d. We then averaged these z-scores across all relevant tests at each measurement and calculated the overall mean value across all measurements.
Genotyping, APOE4 genotype, other AD/ADRD variants and the PRS for ADRD
Details of genotyping, QC and imputation for the NHS and HPFS are described elsewhere58 (https://github.com/cturman15/ChanGWASlab) and in Supplementary Text. Blood samples were genotyped using one of six genotyping platforms. We restricted the samples to inferred European ancestry based on genetic PCs. Post-QC data were imputed using the 1000 Genomes Phase 3 v5 reference panel. APOE4 genotype was determined using two SNPs: rs429358 and rs7412. APOE4 homozygotes carried C/C alleles for both SNPs and APOE4 heterozygotes carried C/T for rs429358 and C/C or C/T for rs7412. All other combinations of alleles were considered APOE4 noncarriers. The average imputation quality score for rs429358 and rs7412 was 0.91 and 0.87 across genotyping platforms, respectively. We calculated PRSs for ADRD using weights from two published studies9,21,59. The PRS developed by Bellenguez et al. (PGS002280) comprised 83 variants and excluded any variants from the APOE region9. The PRS developed by Zhang et al. (PGS000334) comprised 22 variants and included the two APOE variants21. Only variants available in the imputed genetic data were included in the PRS calculation (Supplementary Table 11). The PRS was calculated as a weighted sum of the effect allele dosage across all included variants for each individual and was standardized to have a mean of 0 and an s.d. of 1 within each genotyping platform to maximize comparability. We further extracted individual variants from these two PRSs, which were identified in previous GWASs of AD/ADRD. Duplicated variants and those with a minor allele frequency <0.01 were removed from the combined list, followed by linkage disequilibrium pruning (r2 < 0.1 with the 1000 Genomes European population as the linkage disequilibrium reference) using the SNPclip function in the LDlinkR package in R, leaving a total of 73 variants for subsequent analyses (Supplementary Table 12).
Metabolomic profiling
Plasma metabolomic profiling was performed for nested case–control studies within the NHS and HPFS using high-throughput LC–MS techniques at the Broad Institute of MIT and Harvard (Cambridge, MA, USA). Additional details of metabolomic profiling are provided in Supplementary Text. For metabolites with <25% missing data in an individual study, missing values were imputed with half of the minimum measured value for that metabolite in that study; metabolites with <100 samples were removed. A probit transformation was applied to metabolites within each study to correct for batch effects, reduce the impact of skewed distributions and heavy tails on the results and scale the metabolite values to the same range. After merging the metabolite data with other types of data (n = 4,215 for the NHS and n = 1,490 for the HPFS), we excluded metabolites with ≥90% missing values among dementia cases with genetic data. We further excluded metabolites with an intraclass correlation coefficient <0.4 or coefficient of variation in the top 10 percentiles of all remaining metabolites. A total of 401 metabolites was included in the final analysis for the NHS, of which 254 were available in the HPFS. We created another set of metabolomics data for the NHS by selecting those with ≥100 samples and <25% missing values from the 401 metabolites in the final dataset, followed by RF imputation with 100 trees using the missRanger package in R; 237 metabolites were retained for subsequent analyses of the overall metabolomic profile that required no missing data. Using the same approach, we retained 164 non-missing metabolites in the HPFS.
Dietary assessment and the MedDiet score
Dietary intakes were assessed using SFFQs. The validity and reproducibility of the SFFQs have been demonstrated in previous publications60. We calculated the average dietary intakes from the first dietary assessment (1980 for the NHS and 1986 for the HPFS) to the SFFQ closest to the blood draw time to reflect the long-term diet. The MedDiet was assessed using the Alternate Mediterranean Diet Score, which was calculated based on nine components61. For vegetables, fruit, nuts, whole grains, legumes, fish and the ratio of monounsaturated to saturated fat, a score of 1 was given if the intake was at or above the SFFQ-specific median; otherwise, 0 was given. For red and processed meat consumption, a score of 1 was assigned if the intake was below the SFFQ-specific median; otherwise, a score of 0 was assigned. For alcohol intake, a score of 1 was assigned if the intake was between 5 and 15 g d−1; otherwise, a score of 0 was assigned. The scores of individual components were summed to obtain the overall MedDiet index, which ranged from 0 to 9.
Assessment of global impacts of genetics and MedDiet on plasma metabolome
We assessed the overall correlation of genetic data, the MedDiet index and the plasma metabolome in the NHS. Pearson’s correlation coefficients were calculated for each of the 401 metabolites with genetic PC1 and PC2. Correlation coefficients were then ranked from highest to lowest for PC1 and PC2, respectively. The overall rank was determined by summing the ranks of PC1 and PC2 and ranking them from lowest to highest.
Leveraging the 237 metabolites with no missing values in the NHS (see above), we assessed the overall correlation between metabolites and the MedDiet index, as well as the predictive performance of metabolites on the MedDiet index. Pearson’s correlation coefficients were calculated for the MedDiet index and its individual components (monounsaturated and saturated fat calculated separately) with metabolites PC1 and PC2 calculated from the 237 metabolites. RF regression was performed to evaluate the predictive performance of the metabolites on the MedDiet index. The dataset was first randomly split into training (60%) and test (40%) sets. A dichotomized MedDiet index outcome was derived from the top and bottom quartiles of the continuous score. RF regression with five-fold cross-validation was performed on the training set to tune the parameter using the train and trainControl functions in the caret package in R. The tuned model was then applied to the test set to evaluate performance using the AUC. The same approach was applied to the HPFS to assess the predictive performance of metabolites on the MedDiet index.
Interaction analyses of plasma metabolome and genetic variation in relation to dementia risk and cognitive function
Cox PH models were fitted to assess the associations between each of the 401 metabolites and the time-to-event outcome of dementia among 4,215 women in the NHS using the coxph function in the survival package in R. Details of covariate assessment and adjustment are provided in Supplementary Text. The FDR correction was applied to the P value for metabolites using the Benjamini–Hochberg approach, with an FDR < 0.05 considered statistically significant. The same approach and FDR threshold were used for all other analyses involving multiple testing corrections in this study, including all interaction tests. All statistical tests in this study were two sided. For the interaction analysis of metabolites and APOE4 status, interaction terms between APOE4 carrier status (or APOE4 heterozygote and homozygote) and the metabolite were added to the model, along with ADRD PRS (excluding the APOE region) and its interaction term with the metabolite. For the models of APOE4 heterozygote and homozygote, FDR correction was applied jointly to the interaction P value of the two APOE4 terms. In addition, likelihood ratio tests were performed comparing the model with and without the APOE4 interaction terms. For the interaction analysis of metabolites with ADRD PRS or other AD/ADRD variants, the relevant gene–metabolite interaction terms (PRS or effect allele dosage) were added to the model, along with APOE4 heterozygote and homozygote. All interaction models were additionally adjusted for the top four genetic PCs and genotyping platforms. For the subgroup analyses within APOE4 noncarriers, carriers and heterozygotes, the models were further adjusted for the ADRD PRS (excluding the APOE region), the top four genetic PCs and genotyping platforms. For APOE4 homozygotes, the models were adjusted for only continuous covariates, ADRD PRS and the top four genetic PCs due to the limited sample size. For analyses within ADRD PRS tertiles (defined using genetic PC-adjusted scores), no additional covariate was adjusted.
Generalized linear models (Gaussian family) were fitted to assess the association between each objective cognitive function score and each of the 401 metabolites among a subset of 1,037 women with cognitive function measurements using the glm function of the stats package in R. The models were adjusted for the same covariates as in the dementia risk analysis. Interaction analysis was performed for APOE4 carrier status with the same additional covariates as in the dementia risk analysis. APOE4 carriers were not further stratified into heterozygotes and homozygotes due to data sparsity among homozygotes in this subset. FDR correction was applied to the interaction P value per cognitive outcome. Interaction analysis with other genetic factors or subgroup analysis was not performed due to the limited power.
As a replication, interaction analysis of the 254 available metabolites was conducted in 1,490 men from the HPFS, with additional adjustment for profession. Due to data sparsity in non-missing values for each metabolite, only interactions with APOE4 carrier status were assessed.
Associations of MedDiet adherence with dementia risk and cognitive function
In the analysis of the associations of the MedDiet index score with dementia risk and objective cognitive function, we leveraged data from the full NHS cohort and excluded participants who had dementia, Parkinson’s disease, stroke, cancer or missing components for the MedDiet index at baseline, which was 1980 for the dementia endpoint and 1994 for the objective cognitive function. For the analysis of the objective cognitive function, we further excluded participants aged <70 years at baseline. A total of 86,740 participants were included in the analysis of dementia risk and 16,244 participants in the analysis of objective cognitive function.
Cox PH model was fitted to prospectively assess the association between the continuous MedDiet index and the time-to-event outcome of dementia risk. Details of covariate adjustment are provided in Supplementary Text. A cubic spline regression model was fitted to assess the nonlinear trend. Subgroup analyses were performed by APOE4 genotype and tertiles of ADRD PRSs.
Generalized linear models were fitted to assess the association between the continuous MedDiet index and the objective cognitive function scores. These models adjusted for the same covariates as the dementia risk model. Subgroup analyses were performed by APOE4 genotype and tertiles of ADRD PRSs.
As a replication, a total of 43,500 male participants from the HPFS were included in the analysis of the association between MedDiet adherence and dementia risk, applying the same exclusion criteria as in the NHS. The same Cox PH and cubic spline models were fitted, with additional adjustment for profession. Subgroup analyses were performed by APOE4 genotype.
Associations between MedDiet adherence and plasma metabolome by genetic subgroups
Generalized linear models were fitted to assess the association between the MedDiet index and each of the 401 metabolites among 4,215 women in the NHS, adjusting for the same covariates as the above linear model for cognitive function and metabolites. Subgroup analyses were performed by APOE4 genotype and tertiles of ADRD PRS (excluding APOE region). As a replication, the same models were fitted to assess the association between the MedDiet index and each of the 254 overlapping metabolites among 1,490 men in the HPFS, additionally adjusted for profession.
Mediation effect of metabolites on the association between MedDiet adherence and dementia risk by APOE4 carrier status
We conducted a mediation analysis to quantify the extent to which metabolites mediate the association between MedDiet adherence and dementia risk in the NHS. Metabolites associated with both dementia risk (P < 0.05) and MedDiet adherence (FDR < 0.05) were selected as candidate mediators, followed by orthogonal filtering using a correlation threshold of r < 0.5 to exclude highly correlated metabolites, resulting in seven metabolites: allantoin, C16:1 CE, C18:0 SM, 1-methylguanine, 1,7-dimethyluric acid, C34:5 phosphatidylcholine plasmalogen and piperine. Regression-based mediation analyses were then conducted by comparing a full model (including both MedDiet and selected metabolites) with a reduced model (excluding metabolites), with dementia risk as the dependent variable to quantify the proportion of the effect of MedDiet adherence on dementia risk, explained by these selected metabolites in the full dataset, as well as stratified by APOE4 carrier status.
Prediction of dementia risk and cognitive function
Cox PH models were built for predicting dementia risk among 4,215 women in the NHS. The dataset was first randomly split into training (60%) and test (40%) sets, including within APOE4 subgroups. A 15-year outcome-free attainment was defined by censoring participants without event by year 15. We built four prediction models: the baseline model included age, family history of dementia, educational attainments of nurses, smoking status, history of depression or regular antidepressant drug use and the MedDiet index; the APOE4 model further included the APOE4 heterozygote and homozygote indicators, the PRS model the ADRD PRS (excluding the APOE region) and the metabolite model the selected metabolites, including 12 metabolites for predicting overall outcomes and 4 metabolites for predicting the 15-year outcome-free attainment (Supplementary Text and Supplementary Table 22). APOE4 predictors were not included in the models for APOE4 subgroups. All models were built in the training set and evaluated on the test set. Time-dependent AUC was calculated based on an incident/dynamic version of sensitivity and specificity within distinct risk sets, defined as groups of participants who remained at risk for developing dementia at specified time points, which provides a dynamic view of model performance across the follow-up period62, using the risksetAUC function in the risksetROC package in R. Harrell’s C-index63 was calculated to quantify the overall discriminative ability of the model by assessing how well the model can rank individuals by their risk of the event using the survival package in R. Feature contributions were quantified by the SHAP value64 for Cox PH model in predicting overall and 15-year dementia risk, including the full list of predictors using the fastshap package in R. SHAP values were calculated for each category of predictors by summing the SHAP value of all predictors in that category.
RF models with 500 trees were built for predicting the dichotomized outcomes of the highest versus the lowest tertile of the continuous cognitive function scores, using the randomForest package in R. The same predictors and analysis strategy were used as in the prediction models for dementia risk. The AUC was calculated to evaluate the model performance in the test set.
As a replication, Cox PH models were built to predict dementia risk among 1,490 men in the HPFS. The same modeling approaches were applied, with profession included in the baseline model instead of education level. Due to data sparsity, prediction models were constructed only for the overall dementia risk in the full dataset. The 164 RF-imputed metabolites with no missing values were considered as candidate predictors and 5 metabolites were selected in the final model, following the same procedure used in the NHS (Supplementary Table 22).
Two-sample MR analysisGWAS sources
Two-sample MR analysis65 was conducted to assess the causal relationships between plasma metabolites and cognitive outcomes using published GWAS summary statistics. GWAS summary statistics for the exposures, including plasma metabolites and metabolite ratios, were obtained from ref. 11 and for the cognitive outcomes were obtained from GWASs of overall dementia66, AD8, vascular dementia66 and cognitive performance67. There was no overlap of the participants between the GWAS cohorts of the exposures and the outcomes. All GWAS populations were of European ancestry.
Genetic instruments
In the original study11, GWASs were performed for 1,091 plasma metabolites and 309 metabolite ratios. In this study, we included all the variant–metabolite and variant–metabolite ratio pairs selected by the original study for MR analyses, with additional selection applied to metabolites and ratios not included in the original set (Supplementary Text). A total of 1,431 variant–metabolite pairs for 657 metabolites and 186 variant–metabolite pairs for 133 metabolites ratios were selected for the MR analysis.
MR analysis
We used three MR methods to assess the causal effect of each metabolite or ratio on each cognitive outcome. Wald ratio method was used when there was only one genetic instrument. The inverse variance-weighted method was used when there were at least two instruments. The MR Egger method was used when there were at least three instruments and potential pleiotropy was detected. MR analysis was performed using the mr function in the TwoSampleMR package in R. Details of the sensitivity analyses are described in Supplementary Text.
Colocalization analysis
Colocalization analysis was performed for exposure–outcome pairs that passed FDR < 0.05 in the MR analysis. For each pair, Bayesian colocalization analysis was performed in the ±500-kb region around each genetic instrument, restricting to variants with minor allele frequency <0.01, using the coloc.abf function with default prior probabilities in the coloc package in R. Colocalization signals were reported for a locus if the conditional probability of colocalization, PP.H4/(PP.H3 + PP.H4), was >70%, where PP.H3 is posterior probability that the two traits have independent causal variants and PP.H4 is the posterior probability that the two traits share a single causal variant. These colocalized exposure–outcome pairs were considered to have putative causal relationships. If there were instruments at multiple loci for a pair, the causal relationship was reported if the exposure and outcome were colocalized at at least one genetic locus. The coloc.abf function assumes that there is a single causal variant for each trait. We further conducted a sensitivity analysis that relaxed the single causal variant assumption using the coloc.susie function in the coloc package in R, which calculates posterior probabilities under the assumption of multiple causal variants.
Reporting summary
Further information on research design is available in the Nature Portfolio Reporting Summary linked to this article.