
We structured this section in five parts. First, we describe the observational data source. Next, we specify the protocol for a hypothetical pragmatic trial (“target trial”) that would answer our causal question regarding sustained adherence to the physical activity recommendations and obesity-related cancer risk. We then describe how we emulated the target trial protocol using the observational data, including the modifications necessary to align the target trial protocol and the statistical methods used. Finally, we describe the sensitivity analyses conducted to assess the robustness of our findings.
Data source
To emulate the target trial, we used data from the CPS-II Nutrition Cohort, a large prospective US cohort established in 1992/1993 as a subcohort of the CPS-II Cohort, originally launched in 1982 [24]. CPS-II Nutrition Cohort enrolled over 180,000 adult males and females from 21 states to investigate the relationship between a broad range of lifestyle factors, including diet, alcohol consumption, vitamin supplementation, tobacco use, physical activity, hormone and aspirin use, air pollution exposure, and family history of cancer and cancer outcomes [24, 25]. Data on education, race, and date of birth were collected in 1982, while medical history, physical activity, alcohol consumption, smoking history, diet, and other lifestyle factors were assessed through detailed questionnaires in the 1992/1993 survey [25, 26]. Beginning in 1997, biennial surveys updated covariate data and identified new self-reported cancer diagnoses, which were verified via medical records, linkage with state cancer registries, or the National Death Index [25, 27]. For this analysis, cancer incidence was defined as first verified primary cancer diagnosis or cancer as primary cause of death and was ascertained from the return of the 2001 CPS-II Nutrition Cohort follow-up survey (defined as baseline) through June 30, 2013 (administrative end of follow-up). Pre-baseline was defined as the return of the 1999 survey. Additional details on covariate derivation are provided in Additional file 1: Additional methods.
The CPS-II Nutrition Cohort assessed MVPA using a self-administered questionnaire adapted from the validated Nurses’ Health Study II physical activity and inactivity assessment tool, ensuring comparability and reliability [28]. We used MVPA data from the 1999, 2001, 2005, 2007, 2009, and 2011 CPS-II Nutrition Cohort surveys for this analysis [29]. Leisure-time MVPA was defined as voluntary activities aimed at maintaining fitness and health, with moderate intensity classified as ≥ 3 metabolic equivalents (MET) and vigorous intensity as ≥ 6 MET [30]. Participants reported average weekly time spent on leisure-time aerobic MVPA (e.g., walking, jogging, bicycling, swimming, tennis, aerobics, and dancing) [19, 29] and each activity was assigned a standard metabolic equivalent (MET) value based on intensity: walking (3.5 MET), biking (4.0 MET), jogging/running (7.0 MET), aerobics (4.5 MET), swimming (7.0 MET), dancing (3.5 MET), and tennis (6.0 MET) [19, 30]. Weekly MET-hours (MET-hrs/wk) of MVPA were then calculated by multiplying each activity’s MET value by the reported weekly duration.
Target trial specifications
We conceptualized a target trial enrolling cancer-free adults aged ≥ 50 years with BMI ≥ 18.5 kg/m2 and no major cardiovascular events (heart attack, angina, coronary artery disease diagnosis, coronary bypass, angioplasty, stroke, and transient ischemic attack) within 2 years of baseline. Participants would be randomly assigned to one of four intervention strategies aligned with the 2018 US Physical Activity Guidelines, the WCRF, and the ACS recommendations for cancer prevention [10, 11, 13]:
1)
No intervention (natural course of MVPA observed in the study sample, i.e., continuing one’s MVPA practices without intervention)
2)
Below MVPA recommendations (> 0– < 7.5 MET-hrs/wk)
3)
Meeting MVPA recommendations (7.5–15 MET-hrs/wk)
4)
Exceeding MVPA recommendations (> 15 MET-hrs/wk)
Strategies 2–4 were designed as threshold strategies, requiring participants to maintain their assigned MVPA volume throughout the 11-year follow-up, with assessments of adherence via monthly survey questionnaires [31]. For example, those assigned to the 7.5–15 MET-hrs/wk strategy would be required to maintain MVPA within the assigned range. At the start of every follow-up period, they would be asked how much MVPA they would get if assigned to no intervention. If they intend to get MVPA volume below 7.5 MET-hrs/wk, they would be instructed to increase it exactly to 7.5 MET-hrs/wk, and if they intend to get MVPA volume above 15 MET-hrs/wk, they would be instructed to limit it exactly to 15 MET-hrs/wk. They would be instructed to make no change to their intended MVPA volume if it was within the assigned range. Participants would be excused from intervention upon developing a major cardiovascular event that could preclude engagement in leisure-time MVPA during follow-up.
The outcomes would be the 11-year risks of all 13 obesity-related cancers combined and individually, as defined by the IARC [3].
Follow-up would begin at baseline and continue until the first cancer diagnosis, loss to follow-up, unverified cancer diagnosis report, death, or the administrative end of follow-up, whichever occurs first. Participants would be censored at their last cancer-free follow-up survey if they missed a survey or had an unverified cancer report.
Target trial emulation
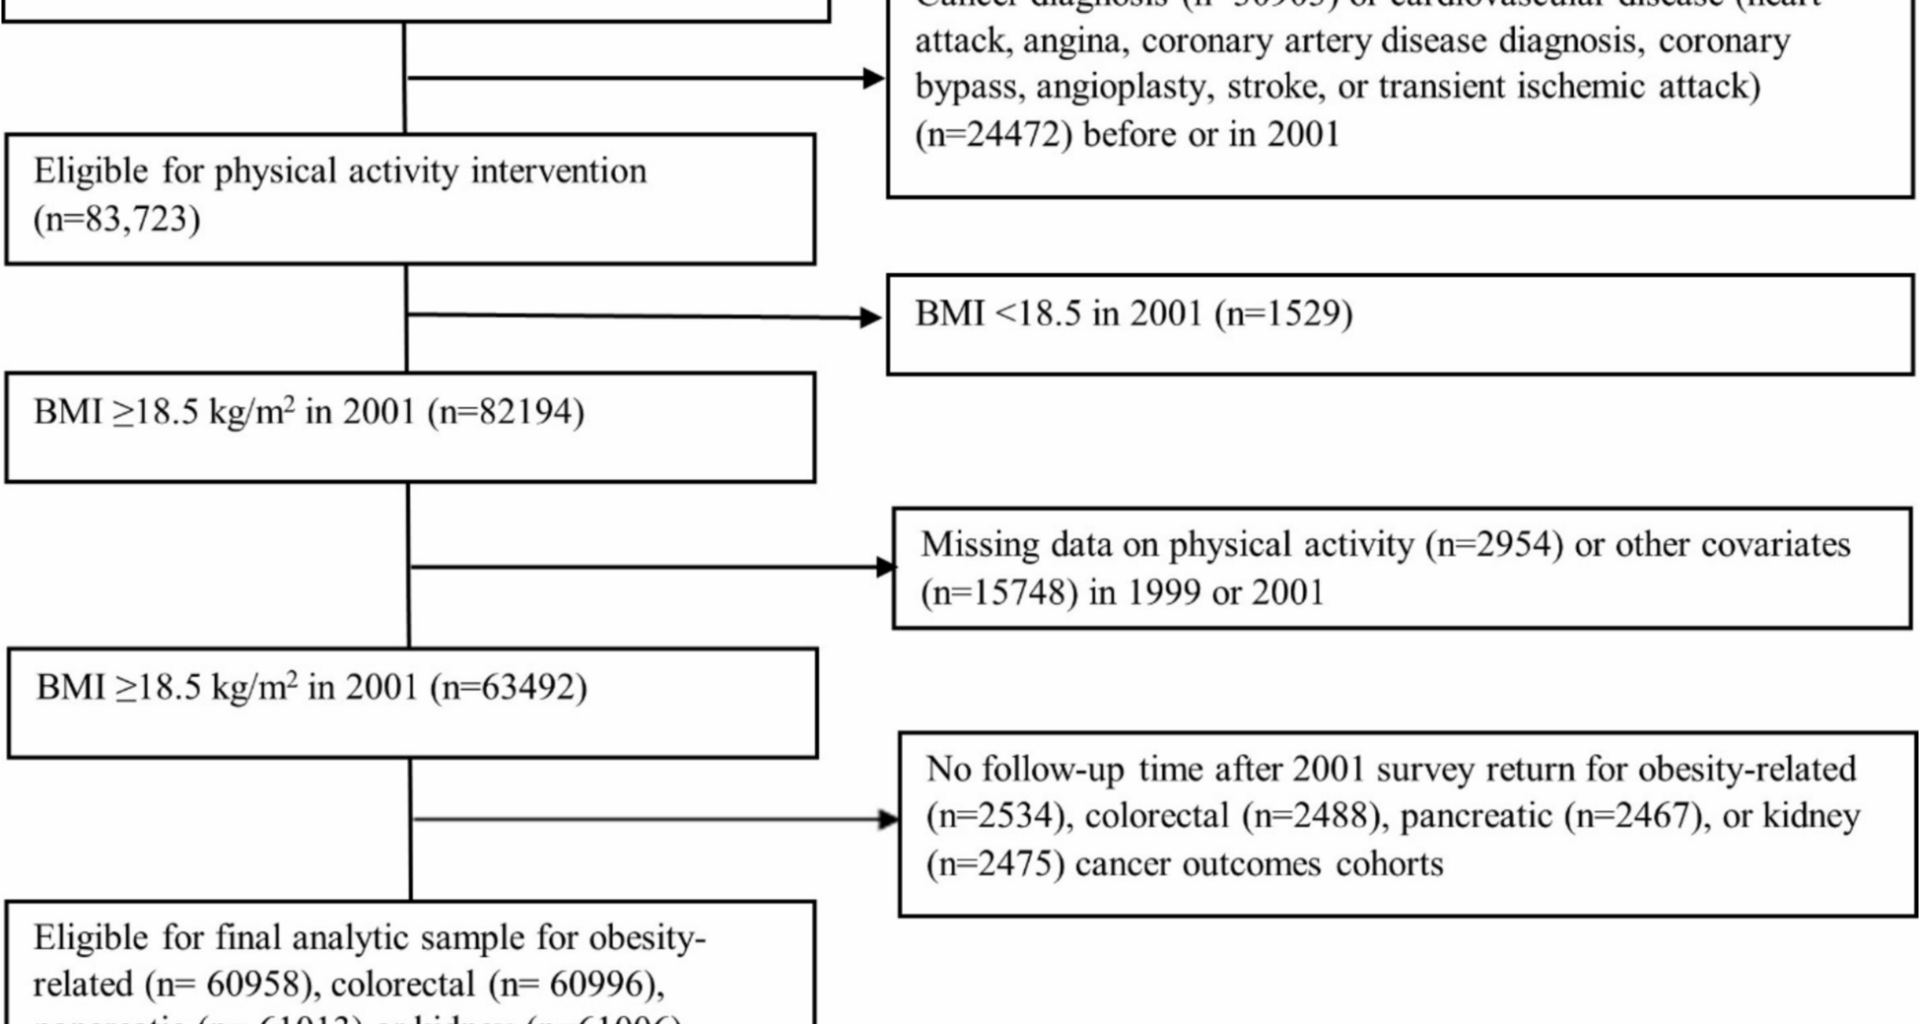
We emulated the specified trial using the data of CPS-II Nutrition Cohort participants who completed the 1999 and 2001 surveys, excluding those with missing MVPA or covariate data at baseline or pre-baseline (Table 1, Fig. 1, Additional file 2: Fig. S1). Each eligible participant was assigned to all four intervention strategies at baseline (2001). To emulate randomization, we adjusted for baseline (2001) and pre-baseline (1999) covariates known to influence physical activity and cancer risk (Additional file 3: Table S1), assuming exchangeability conditional on these covariates [32]. The causal contrast of interest was the observational analog of the per-protocol effect, defined as the effect had all participants adhered to the assigned strategy unless they developed a major cardiovascular event [33]. For primary outcomes, all 13 obesity-related cancers were included in the definition of the combined obesity-related cancers. For secondary outcomes, we considered all 13 site-specific obesity-related cancers, but limited analyses to five cancer types with sufficient case counts for reliable risk estimation (colorectal, postmenopausal breast, endometrial, pancreatic, and kidney cancers).
Table 1 Emulation of a target trial of leisure-time aerobic moderate-to-vigorous intensity physical activity interventions using observational data from the Cancer Prevention Study-II Nutrition Cohort (2001–2013)Fig. 1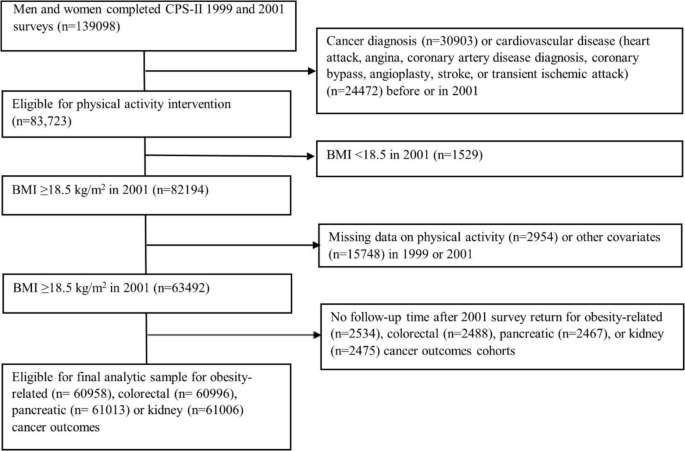
Flowchart of the eligible individuals for the emulated target trial of recreational physical activity and obesity-related, colorectal, pancreatic, or kidney cancer outcomes in the Cancer Prevention Study-II Cohort (2001–2013)
Statistical analysis
We used the parametric g-formula to estimate the 11-year risk of cancer under sustained adherence to the intervention strategies, adjusting for time-varying confounders affected by prior exposure [34,35,36]. The estimated risk under each strategy is a weighted average of the individual risks conditional on each participant’s time-varying covariate and treatment (MVPA) history, with the distribution of covariate histories under that strategy serving as weights (Table S1) [34, 37]. The process involved four steps: (1) We modeled the conditional distribution of outcomes and covariates at each follow-up period, given covariate and physical activity history. (2) Using Monte Carlo simulation, we generated time-varying covariate histories consistent with each hypothetical intervention strategy. (3) Based on predicted hazards from the models above, we calculated the outcome probability under each hypothetical strategy for each individual. (4) The population-level risk (i.e., cumulative incidence) under each strategy was then estimated by averaging the individual-specific predicted risk.
Models included baseline (age, sex, race, education, family history of cancer, smoking history, BMI, diabetes, CVD), pre-baseline (MVPA, diet quality, and alcohol consumption), and time-varying covariates (BMI, MVPA, alcohol consumption, diabetes, CVD). MVPA was truncated at the 99th percentile to minimize the influence of outliers. Missing follow-up covariate data were carried forward from prior values, with time since the last update included in the model.
We calculated percentile-based 95% confidence intervals for all estimates using nonparametric bootstrapping. For each strategy, we also calculated the proportion of participants who would have to be “intervened” on to maintain adherence over an 11-year period [35].
We compared the estimated 11-year risk under each intervention strategy with that of a reference group using risk ratios (RR) and absolute risk differences (RD). For the primary analysis, the reference group was the “no intervention” strategy, representing the natural course of MVPA exposure in the absence of an intervention on physical activity, while intervening to eliminate loss to follow-up [38, 39]. In secondary analyses, we used the “not meeting recommended MVPA” strategy as the reference group to explore the potential benefits of meeting or exceeding MVPA recommendations compared to not meeting them.
All estimates represent the total effect estimands, accounting for all causal pathways between the interventions and outcomes, including those potentially mediated by competing events (i.e., death due to non-cancer causes or cancer not of interest) [40, 41]. Additional file 2: Fig. S2 illustrates an assumed relationship between the treatment, covariates, and the outcomes at two follow-up time points under which the competing event may mediate the treatment’s effect on the outcome.
To explore heterogeneity, we stratified the analyses by pre-baseline MVPA (< 7.5 MET-hrs/wk and ≥ 7.5 MET-hrs/wk) to separately assess the effect among participants who had met and had not met the MVPA recommendation before the intervention [42]. We also stratified analyses by sex and by baseline BMI (18.5– < 25 kg/m2 and ≥ 25 kg/m2) [43].
Sensitivity analyses
We conducted several sensitivity analyses to assess the robustness of our findings by (1) lagged covariate data by 2 years to ensure they preceded physical activity data (estimating 9-year risk instead of 11-year risk) [44]; (2) using different functional forms BMI (linear and log-transformed); (3) altering the temporal ordering of time-varying covariates reported in the same questionnaire when modeling their joint distribution; (4) restricting baseline age to < 90 years and excusing participants from adherence requirements after age 90 due to limited data availability in this age group [25]; (5) excluding participants with baseline chronic obstructive pulmonary disease (COPD) and excusing from the adherence if participants developed COPD during the follow-up; (6) including participants with history of cardiovascular events at baseline and not excusing them from adherence after subsequent events; (7) adjusted for baseline and time-varying cancer screening history (breast, colorectal, prostate) to address the potential confounding effect of healthcare-seeking behavior; and finally (8) excluding current and recent smokers (< 20 years before baseline) [19, 45].
To further evaluate the validity of our modeling approach, we used cardiovascular disease (CVD) mortality (ICD-10 codes I00–I99) as a positive control outcome, where strong effects of MVPA are expected [19, 46]. For breast and endometrial cancer analyses, we adjusted for parity and age at first birth to account for reproductive factors [47, 48].
Analyses were completed using the Science Cloud analytic platform (SAS) developed by Manifold, Inc (Additional file 1: Sample program).