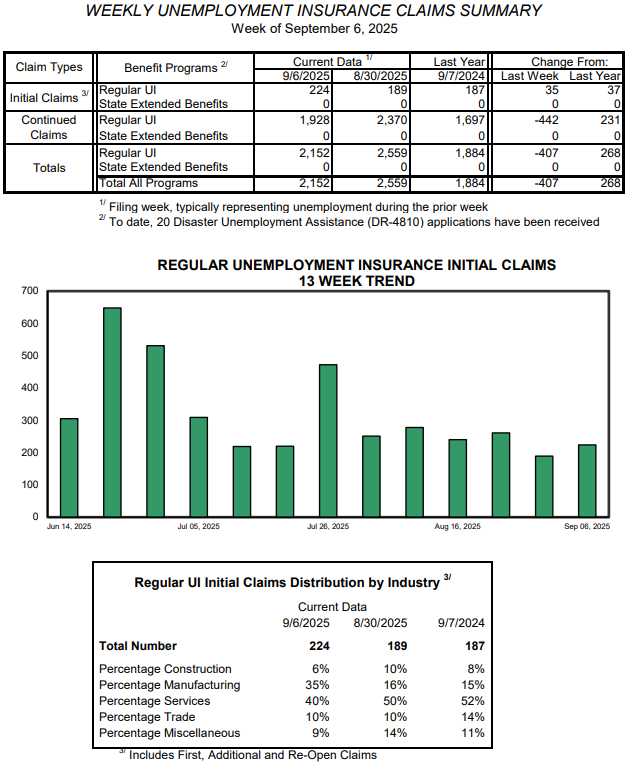
by Timothy McQuiston, Vermont Business Magazine Vermont weekly unemployment claims for the week ending September 6, 2025, increased slightly after last week’s lowest number of the year. New claims were 224 last week, up 35 claims from the week before and up 37 from last year at this time. Claims, which tend to be lowest in the summer, were 181 at the end of September 2024.
In Vermont for the weekly report, manufacturing accounted for 35% of the total (about 78 workers), up 19 points from the previous week. Manufacturing overall has become a smaller part of the Vermont economy over the last 25 years and that trend appears to be continuing. The Service industry, which typically accounts for the most claims, last week reported 40% from the previous week, down 10 points. Construction was 10%, down 4 points.
The Vermont DOL does not release the name of an employer associated with layoffs unless it triggers the requirements of the WARN Act (50 or more layoffs at a single company or a plant closing).
For the week, Vermont total unemployment insurance claims were 2,152 (down 407 for the week and up 268 from this time last year).
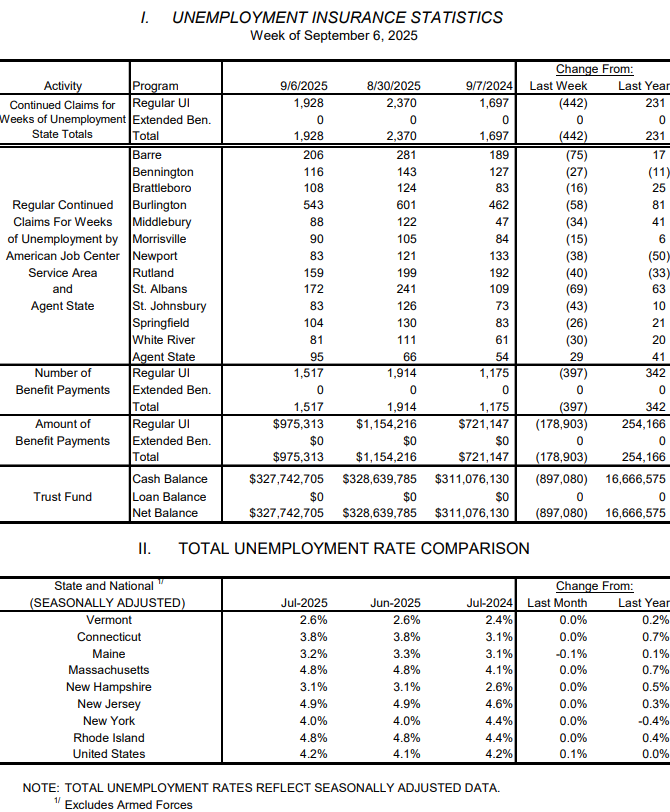
The Vermont Unemployment Trust Fund is well capitalized. As of the most recent data, there was $327.7 million in the Trust Fund, down $900,000 from the prior week (as claims are paid out on one side, employers are contributing to the fund on the other). The pre-pandemic Trust Fund balance on March 1, 2020, was $506.2 million.
For the nation, according to the US DOL, in the week ending September 6, the advance figure for seasonally adjusted initial claims was 263,000, an increase of 27,000 from the previous week’s revised level. This is the highest level for initial claims since October 23, 2021 when it was 268,000. The previous week’s level was revised down by 1,000 from 237,000 to 236,000. The 4-week moving average was 240,500, an increase of 9,750 from the previous week’s revised average. The previous week’s average was revised down by 250 from 231,000 to 230,750.
US jobless claims are at their highest point since October 2021.
The US August Labor Report from the US DOL indicated that employment is waning. This comes after a poor July report and another revised lowering of the June numbers. See National Employment Trends below.
Markets
Meanwhile, the stock market had a positive week in anticipation that the increase in inflation is out-weighed by a weakening economy. The markets anticipate that the Fed will respond to the overall economic news with an interest rate cut, perhaps more than the previously anticipated 25 basis points. The Fed will weigh the any economic weakness against potential inflationary pressures. The inflation report from earlier this week showed an increase of 2.9%, higher than the Fed’s goal of 2%.
Late last month Fed Chair Jerome Powell reinforced the general assumption that the Fed would lower rates modestly in September.
Wall Street has expected the Fed will cut interest rates early in September, probably by 25 basis points (0.25%). Investors were hoping for 50 basis points, but the higher inflation rate could mitigate a more aggressive cut. Powell also hinted in his speech August 22 that overall economic conditions allow the Fed to “proceed carefully” with fiscal policy as downside risks mount.
The Federal Open Market Committee next meets next week, Sept. 16-17.
The divided Fed on July 30 declined to cut interest rates, infuriating the White House and depressing the stock market. The Fed is in a difficult position. On the one hand the economy appears to be stalling, in large part because of tariff uncertainty and waning consumer confidence, and on the other hand, inflation is pushing up for apparently the same reason. The Fed raised rates starting in 2022 in order to stifle spiking inflation, but at a time when federal stimulus funds and a general economic recovery was also occurring. Now, they must decide on whether to risk more inflation by cutting rates at a time of a weakening economy, which could lead to stagflation.
Wall Street wants the rate cut as it should stimulate economic activity and lower costs for businesses and consumers. It also makes stocks a more appealing investment vehicle if interest rates are low for other types of investments tied to high interest rates, like certificates of deposit (CDs) and money markets. As those rates fall, the “wall of cash” might come washing back to equities, or not.
Lower interest rates should also lower mortgage rates. These rates are not directly tied to the Fed rates and have come down more slowly than expected. There is also hope that if interest rates fall rents may also fall as overhead cost pressure declines on landlords and housing development and competition increases.
The S&P, Dow and NASDAQ all reached historic peaks this week.
As of midday Friday, the S&P was at 6,583.86, down (0.06%); the Dow, which peaked at over 46,000 earlier in the week, was at 45,903.17, down (0.44%) and the NASDAQ was at 22,121.128, up 0.35%.
Meanwhile, the average 30-year fixed mortgage rate fell to 6.35%, after it peaked at 7.08% in May, as demand surged.
National Employment Trends August 2025
Nonfarm Payrolls: Increased by just 22,000 jobs in August, continuing a trend of minimal growth since April.
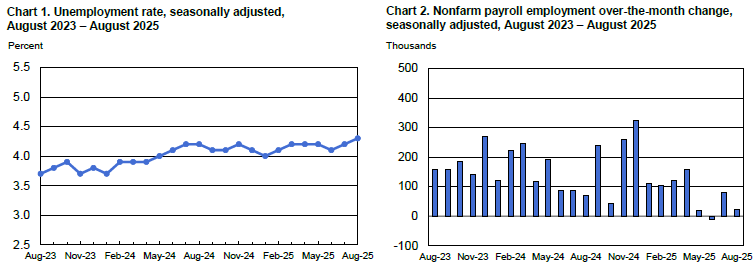
Unemployment Rate: Rose slightly to 4.3% (its highest level since 2021), up from 4.2% in July.
Long-Term Unemployment: Held steady at 1.9 million, now accounting for 25.7% of all unemployed individuals.
Labor Force Participation: Remained unchanged at 62.3%, continuing a gradual decline over the past year.
Employment-Population Ratio: Also unchanged at 59.6%.
Sector Highlights
Gains:
Health Care: Added 31,000 jobs, below the 12-month average of 42,000.
Growth seen in ambulatory services, nursing/residential care, and hospitals.
Social Assistance: Up by 16,000 jobs, mainly in individual and family services.
Losses:
Federal Government: Down 15,000 jobs in August; 97,000 lost since January.
Mining, Quarrying, Oil & Gas: Declined by 6,000 jobs.
Wholesale Trade: Dropped 12,000 jobs; down 32,000 since May.
Manufacturing: Fell by 12,000 jobs, with transportation equipment hit hardest due to strike activity.
Wages and Hours
Average Hourly Earnings: Rose by $0.10 to $36.53 (+3.7% year-over-year).
Average Weekly Hours: Held steady at 34.2 hours.
Manufacturing Overtime: Unchanged at 2.9 hours.
Revisions to Previous Months
June: Revised down from +14,000 to -13,000.
July: Revised up from +73,000 to +79,000.
Net Effect: Employment for June and July combined is 21,000 lower than previously reported.
Demographic Breakdown
Unemployment Rates by Group:
Adult Men: 4.1%
Adult Women: 3.8%
Teenagers: 13.9%
Whites: 3.7%
Blacks: 7.5%
Asians: 3.6%
Hispanics: 5.3%
New Entrants: Fell by 199,000 to 786,000.
Discouraged Workers: Steady at 514,000.
Alternative Measures of Labor Underutilization
U-6 (Broadest Measure): Rose to 8.1%, includes unemployed, marginally attached workers, and those working part-time for economic reasons.
Upcoming Releases
September Employment Report: Scheduled for release on October 3, 2025.
Preliminary Benchmark Revision: To be published September 9, 2025, aligning survey data with unemployment insurance records.
Vermont’s unemployment rate unchanged at 2.6 percent in July
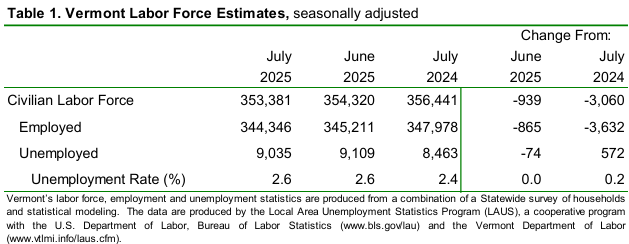
The Vermont Department of Labor reported on August 19 that the seasonally adjusted statewide unemployment rate for July was 2.6 percent. This reflects no change from the prior month’s revised estimate. The civilian labor force participation rate was 64.7 percent in July, a decrease of two-tenths of one percentage point from the prior month’s revised estimate. Vermont has the third lowest rate in the nation, behind South (1.9%) and North Dakota (2.5%). California has the highest rate at 5.5% (Washington, DC, is at 6%).
The Labor Force and Employment dropped from June and are both now more the 3,000 below their numbers from last year. Because the Labor Force is the denominator in these equations, a decline in both data points can offset a change in the rate. The number of unemployed fell slightly by 74 participants.
The comparable United States rate in July was 4.2 percent, an increase of one-tenth of one percentage point from the revised June estimate (August rate up one-tenth to 4.3%). The seasonally adjusted Vermont data for July show the Vermont civilian labor force decreased by 939 from the prior month’s revised estimate (see Table 1). The number of employed persons decreased by 865 and the number of unemployed persons decreased by 74. The change in the labor force participation rate (64.7 percent, down two-tenths of one percentage point) was statistically significant in the seasonally adjusted series.
The July unemployment rates for Vermont’s 14 counties ranged from 2.2 percent in Windsor County to 2.9 percent in Orleans County (note: county unemployment rates are not seasonally adjusted). For comparison, the July unadjusted unemployment rate for Vermont was 2.5 percent, an increase of one-tenth of one percentage point from the revised unadjusted June level and an increase of two-tenths of one percentage point from a year ago.
The seasonally adjusted data for July reported an increase of 100 jobs from the revised June data. There was a decrease of 100 jobs between the preliminary and the revised June estimates due to the inclusion of more data. The seasonally adjusted over-the-month changes in July varied at the industry level. The industries with a notable increase were: Administrative & Waste Services (+500 jobs or +3.5%) and Finance & Insurance (+300 jobs or +3.5%). The industries with a notable decrease were: Federal Government (-200 jobs or -2.9%), Other Services (-300 jobs or -2.8%), and Professional & Technical Services (-300 jobs or -1.7%).
The preliminary ‘not-seasonally-adjusted’ jobs estimates for July showed a decrease of 600 jobs when compared to the revised June numbers. As with the seasonally adjusted data, this over-the-month change is from the revised June numbers which experienced a decrease of 400 jobs from the preliminary estimates. The broader economic picture can be seen by focusing on the over-the-year changes in this data series. As detailed in the preliminary not-seasonally-adjusted July data, Total Private industries increased by 3,400 jobs (+1.3%) over the year and Government (including public education) employment increased by 500 jobs (+1.0%) in the past year.
*** BLS note on LAUS geography and data changes in 2025: https://www.bls.gov/lau/geography-and-data-changes-in-2025.htm ***
To support vital journalism, access our archives and get unique features like our award-winning profiles, Book of Lists & Business-to-Business Directory, subscribe HERE!