
Materials
Magnesium nitrate hexahydrate (Mg(NO3)2·6H2O, > 99.0%), aluminum nitrate nonahydrate (Al(NO3)2·9H2O, > 99.0%), strontium nitrate (Sr(NO3)2, > 99.0%), cerium nitrate hexahydrate (Ce(NO3)2·6H2O, > 99.0%), formamide (HCONH2), sodium hydroxide (NaOH, > 98.0%), H2O2 (30%), BSA, MB, DMPO, DHE, TMB, xanthine, and xanthine oxidase were bought from Aladdin Reagent (Shanghai, China). RB was acquired from MedChemexpress (USA). Phosphate buffered saline (PBS), hydroxyl radical Assay Kit, dimethyl sulfoxide (DMSO), and SOD Assay Kit were obtained from Sigma-Aldrich and Fisher (USA). CCK-8, JC-1 reagent, Calcein-AM/PI reagent, 3,3-diaminobenzidine (DAB), Masson regent, and DCFH-DA reagent were acquired from Beyotime Biotechnology Co., Ltd (Shanghai, China). H&E was acquired from Solarbio Science & Technology Co.,Ltd (Beijing, China). TUNEL was bought from Abcam plc (USA). 0.25% Trypsin-EDTA, DMEM, WGA reagent, and fetal bovine serum (FBS) were sourced from Thermo Fisher Scientific (USA). Penicillin/streptomycin was purchased from ChemeGen Bio-tech Pioneer (Shanghai, China). Matrigel was obtained from Corning (USA). Cleaved-Caspase3 antibody, Phospho-Akt antibody, Phospho-PI3K antibody, PI3K antibody, Akt antibody, Smad9 antibody, Faslg antibody, and VEGFb antibody were acquired from Affinity Biosciences (Jiangsu, China). TGF-β2 antibody and Bax antibody were acquired from Santa Cruz Biotechnology (USA). α-actinin antibody and β-actin antibody were sourced from Cell Signaling Technology (USA). CD31 antibody was bought from Abcam plc (USA). Rabbit secondary antibody, mouse secondary antibody and Angiopoietin1 (Ang1) antibody were acquired from Proteintech Group (USA).
Characterizations
A HT7700-MS2 transmission electron microscope (HITACHI, Tokyo, Japan) was adpoted to capture TEM images with an accelerating voltage of 100 kV. XRD patterns were characterized by a Shimadzu XRD-6000 diffractometer (SHIMADZU, Japan) with Cu Kα radiation. An atomic force microscope (MultiMode 8, Bruker) was employed to characterize the thickness of the sample in tapping mode. A EMX1598 spectrometer (Bruker, USA) was employed to record the ESR spectra. XPS measurements were performed on an Escalab 250Xi spectrometer (Thermo Scientific, USA) with an Al Kα X-ray source. DLS on a Malvern Zetasizer UV instrument (U.K.) was used to analyze the sizes and zeta potentials. The concentration of Sr was detected by ICP-AES (Shimadzu ICPS-7500). The OGD/R model was constructed using a hypoxia incubator chamber (billups-rothenberg, USA). Fluorescence images were observed under a Nikon ECLIPSE Ti microscope (Nikon, Japan). Bright images were observed under microscope (Nikon, Japan). Western blot results were analyzed by ChemiDicTM XRS + ImagingSystem (Bio-Rad, USA).
Preparation of Mg2Sr0.2CexAl0.8−x-LDH nanosheets
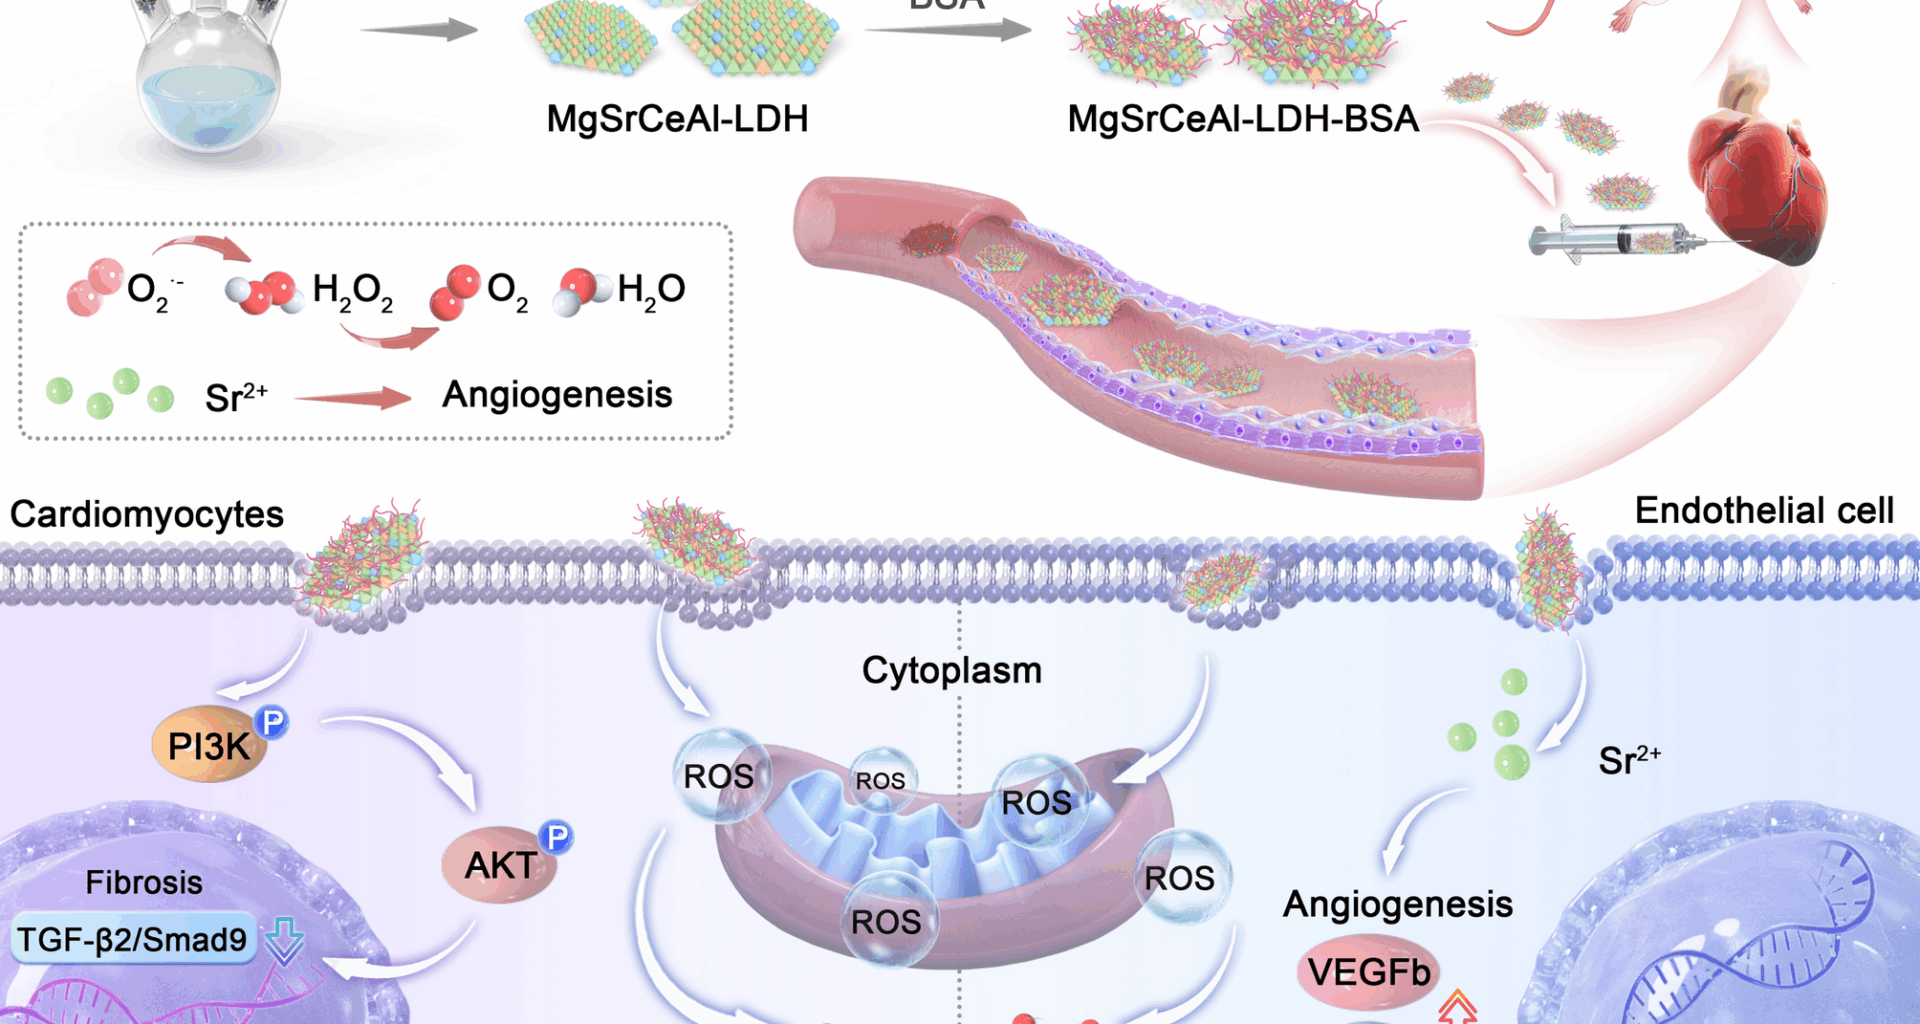
Mg2Sr0.2CexAl0.8−x-LDH nanosheets were prepared through bottom-up method. Taking Mg2Sr0.2Ce0.75Al0.05-LDH as an example, Mg(NO3)2·6H2O (0.004 mol), Sr(NO3)3 (0.0004 mol), Ce(NO3)3·6H2O (0.0015 mol), and Al(NO3)2·9H2O (0.0001 mol) were dissolved in deionized water (20 mL) to obtain solution (A). NaNO3 (0.0002 mol) was dissolved in deionized water (20 mL) containing 25% formamide to form solution (B). NaOH (0.006 mol) was dissolved in deionized water (20 mL) to form solution (C). Solution A and solution C were added slowly into solution B and stirred at room temperature in N2 atmosphere for 0.5 h, and the resulting Mg2Sr0.2Ce0.75Al0.05-LDH nanosheets were rinsed three times with deionized water.
Preparation of MgSrCeAl-LDH-BSA nanosheets
The BSA (200 mg) was added to the MgSrCeAl-LDH (10 mg) suspension under stirring at room temperature for 12 h. The formed MgSrCeAl-LDH-BSA was centrifuged for 5 min and washed thoroughly with deionized water for three times.
·OH scavenging performance evaluation
Firstly, ·OH was produced by Fenton reaction between FeSO4 (1.8 mM) and H2O2 (5 mM) for 10 min. The ·OH scavenging capacities of Mg2Sr0.2CexAl0.8−x-LDH and CeO2 were assessed by ESR. Specifically, Mg2Sr0.2CexAl0.8−x-LDH or CeO2 was mixed with the formed ·OH solution for 30 min. After that, DMPO was added to the mixture for 10 min and then the radical signals were detected by ESR. The ·OH scavenging activities of Mg2Sr0.2CexAl0.8−x-LDH and CeO2 were also determined by TMB and MB assays. Mg2Sr0.2CexAl0.8−x-LDH or CeO2 was treated with the formed ·OH solution for 30 min. Then, TMB or MB was added to the mixture for 10 min and the UV-vis absorbance spectra of TMB and MB were acquired by UV-vis spectrometer.
·O2
− scavenging performance evaluation
·O2− was formed from the reaction between xanthine oxidase (0.1 U/ml) and xanthine (0.5 mM) at room temperature for 0.5 h. The ·O2− scavenging abilities of Mg2Sr0.2CexAl0.8−x-LDH and CeO2 were evaluated by ESR. Specifically, Mg2Sr0.2CexAl0.8−x-LDH or CeO2 was treated with the formed ·O2− solution for 0.5 h, followed by the addition of DMPO for 10 min incubation. Then, the radical signals were detected by ESR. The ·O2− scavenging activities of Mg2Sr0.2CexAl0.8−x-LDH and CeO2 were also determined by DHE assay. Mg2Sr0.2CexAl0.8−x-LDH or CeO2 was treated with the formed ·O2− solution for 30 min. DHE probe was added to the mixture for 10 min and the fluorescence emission of the solution was measured by fluorescence spectrometer.
SOD mimetic activity assay
The ·O2− scavenging ability was evaluated using SOD assay kit. In brief, MgSrCeAl-LDH and CeO2 solutions were treated with WST1 working solution (200 µL), respectively. The reaction was initiated by adding xanthine oxidase solution (20 µL). Subsequently, the absorbance of mixture at 450 nm was detected by a micro plate reader after 20 min of incubation. The SOD mimetic activity can be quantified by measuring the absorbance at 450 nm, which is proportional to the amount of ·O2−.
Cell culture
H9C2 cells and MCMECs were obtained from Wuhan Pricella Biotechnology Co., Ltd. and treated with 4.5 g/L DMEM medium containing 1% streptomycin/penicillin (Gibco) and 10% FBS (Gibco) at 37 ℃ with 5% CO2.
In vitro OGD/R process
The OGD/R model was conducted following a standardized protocol. Briefly, when cell density reached 80%, H9C2 cells and MCMECs were cultured in glucose-free DMEM under hypoxic conditions (95% N2, 5% O2) at 37 °C for 24 h to induce OGD. After the OGD period, the previous medium was substituted with 4.5 g/L DMEM complete growth media, and the cells were then cultured under normoxic conditions for 24 h to simulate reperfusion process.
In vitro MgSrCeAl-LDH-BSA intervention
Following the aforementioned protocol, H9C2 cells and MCMECs were subjected to OGD treatment. Subsequently, the culture medium was replaced with 4.5 g/L DMEM complete growth medium supplemented with MgSrCeAl-LDH-BSA (10 µg mL−1), and the cells were cultured under normoxic conditions for 24 h to simulate reperfusion process.
Cell viability assay
H9C2 cells and MCMECs were incubated in 96-well plates (8000 cells per well) for 24 h. Following either 24 h of normoxic incubation or the OGD/R process, cells were rinsed three times with PBS (Gibco). The previous medium was then substituted with 4.5 g/L DMEM complete growth medium (100 µL) containing varying concentrations of MgSrCeAl-LDH-BSA (5–60 µg mL−1). Finally, basal medium (100 µL) with 10% CCK-8 solution (Beyotime) was added to each well for 1 h of incubation. Finally, the absorbance at 450 nm was recorded using a spectrometer.
Hemolysis assay
To assess the biocompatibility of MgSrCeAl-LDH-BSA, a hemolysis assay was performed on RBCs. Briefly, 10 µL of RBCs suspension was transferred to 1.5 mL tubes, followed by the addition of distilled water, PBS, and MgSrCeAl-LDH-BSA (40–200 µg mL−1), respectively. After thorough mixing, the tubes were transferred to a water bath (37 °C) for 3 h. Hemolysis ratio was quantitatively analyzed using a UV-visible spectrophotometer.
ROS assay in vitro
Intracellular ROS levels were assessed with DCFH-DA reagent. H9C2 cells and MCMECs were incubated in 12-well plates (2 × 10⁵ cells per well) for 24 h. Subsequently, the previous medium was discarded, and cells were rinsed three times with PBS. Next, cells underwent OGD by exposure to a hypoxic environment in glucose-free DMEM at 37 °C for 24 h. Following the OGD period, the previous medium was substituted with 4.5 g/L DMEM complete growth medium supplemented with MgSrCeAl-LDH-BSA (10 µg mL−1), and cells were incubated under normoxic conditions for another 24 h to simulate reperfusion. Following reperfusion period, cells were exposed to DCFH-DA reagent (10 µM) in the dark and incubated in a humidified chamber at 37 °C for 20 min. All treated cells were thoroughly rinsed with serum-free culture medium to eliminate excess DCFH-DA reagent after incubation. The fluorescence signal of the cells was captured on a fluorescence microscope (Leica, Japan) and analyzed using Image J software.
Live/dead staining
Calcein-AM/PI staining reagents (Beyotime) were employed to differentiate live and dead cells for visualization the results of CCK-8 assay. H9C2 cells and MCMECs were plated in 12-well plates (2 × 10⁵ cells per well) and incubated for 24 h. Then, the previous medium was discarded, and cells were rinsed three times with PBS. After that, cells were subjected to OGD by exposure to a hypoxic environment (95% N2 and 5% O2) in glucose-free DMEM at 37 °C for 24 h. After the OGD period, the culture medium was replaced with 4.5 g/L DMEM complete growth medium supplemented with MgSrCeAl-LDH-BSA (10 µg mL−1), and cells were incubated under normoxic conditions for another 24 h to simulate reperfusion. Following reperfusion period, cells were treated with Calcein-AM (2 µM) and PI (5 µM) mixture in a dark at 37 ℃ for 20 min, then rinsed three times with PBS to eliminate extracellular Calcein-AM/PI staining reagents. The fluorescence signal was captured on a fluorescence microscope (Leica, Japan) and analyzed using Image J software.
Mitochondrial membrane potential
JC-1 dye was employed to detect the mitochondrial membrane potential. Initially, H9C2 cells and MCMECs were incubated in 12-well plates (2 × 10⁵ cells per well) for 24 h. Subsequently, the previous medium was discarded, and cells were rinsed three times with PBS. Following this, cells underwent OGD by exposure to a hypoxic condition with glucose-free DMEM at 37 °C for 24 h. Following the OGD treatment, the previous medium was substituted with 4.5 g/L DMEM complete growth medium supplemented with MgSrCeAl-LDH-BSA (10 µg mL−1), and cells were allowed to recover under normoxic conditions for an additional 24 h to simulate reperfusion. Afterwards, cells were treated with JC-1 solution (10 µg mL−1) at 37 °C for 20 min. Then, cells were rinsed three times with PBS to remove excess JC-1 dye. The fluorescence signal was captured with a fluorescence microscope (Leica, Japan) and analyzed using Image J software.
Tube formation assay
MCMECs were initially plated in 6-well plates (1 × 10⁶ cells per well) for 24 h. Then, the previous medium was discarded, and cells were rinsed three times with PBS. Following this, cells underwent OGD by exposure to a hypoxic condition with glucose-free DMEM at 37 °C for 24 h. After the OGD treatment, the previous medium was replaced with 4.5 g/L DMEM complete growth media supplemented with MgSrCeAl-LDH-BSA (10 µg mL−1), and cells were allowed to recover under normoxic conditions for an additional 24 h to simulate reperfusion. All groups of MCMECs were then digested with trypsin (Gibco) and collected. The collected cells were subsequently plated in 24-well plates (1.2 × 10⁵ cells per well) precoated with matrigel (Corning, 200 µL/well). After 6 h of incubation, the previous medium was carefully removed, and cells were washed three times with Ca2+-free D-Hanks balanced salt solution. The formation of capillary-like tubes was observed under microscopy. The tube lengths and junction points were measured and averaged using ImageJ software.
Cell migration assay
MCMECs were plated in 6-well plates (1 × 10⁶ cells per well) and incubated for 24 h. Next, the previous culture medium was removed, and cells were rinsed three times with PBS. Following this, cells underwent OGD by exposure to a hypoxic condition with glucose-free DMEM at 37 °C for 24 h. After the OGD treatment, the cell monolayers were gently scratched using a sterile pipette tip to create wounds, and the previous medium was substituted with normal medium containing MgSrCeAl-LDH-BSA (10 µg mL−1), followed by incubation under normoxic conditions for an additional 24 h to simulate reperfusion. Subsequently, after 24 and 48 h of incubation, the wounds were examined using a microscope (Leica, Japan).
RNA sequencing and analysis
H9C2 cells were plated in 6-well plates (1 × 10⁶ cells per well) for 24 h. Then, the previous medium was discarded, and cells were rinsed three times with PBS. Following this, cells underwent OGD by exposure to a hypoxic environment with glucose-free DMEM at 37 °C for 24 h. Following the OGD treatment, the previous medium was substituted with 4.5 g/L DMEM complete growth media supplemented with MgSrCeAl-LDH-BSA (10 µg mL−1), and cells were allowed to recover under normoxic conditions for another 24 h to simulate reperfusion. Subsequently, the RNA from H9C2 cells was extracted using TRIzol reagent. The purity and concentration of RNA were evaluated with a NanoDrop 2000 spectrophotometer (Thermo Scientific, USA). RNA libraries were prepared using the NEBNext® Multiplex RNA Library Prep Set for the Illumina Novaseq™ 6000 platform (NEB, USA). The quality of the RNA libraries was further evaluated using a Bioanalyzer 2100 system (Agilent Technologies, USA), and sequencing was performed on the Illumina Novaseq™ 6000 platform. Gene expression levels were quantified using HTSeq-count. Differential expression analysis was conducted using the DESeq2 package. To explore the biological significance of the differentially expressed genes, clustering analysis and KEGG pathway enrichment analysis were conducted to determine significantly enriched pathways.
Western blotting analysis
H9C2 cells and MCMECs were seeded at a density of 1 × 10⁶ cells per well into medium culture dish for 24 h. Subsequently, the previous medium was discarded, and cells were washed three times with PBS. Following this, cells were subjected to OGD by exposure to a hypoxic environment with glucose-free DMEM at 37 °C for 24 h. Following the OGD treatment, the previous medium was substituted with 4.5 g/L DMEM complete growth media supplemented with MgSrCeAl-LDH-BSA (10 µg mL−1), and cells were allowed to recover under normoxic conditions for another 24 h to simulate reperfusion. After the reperfusion period, the previous medium was discarded and cells were rinsed three times with PBS. All treated cells were homogenated and lysed using lysis buffer (BOSTER) supplemented with a protease inhibitor. Protein concentrations were determined using Bradford (Abcam). Protein samples of equal amounts were separated using 7.5%−12.5% SDS-PAGE, and then transferred onto a PVDF membrane (Bio-Rad). The membranes were blocked with QuickBlock solution (Beyotime) at room temperature for 10 min, followed by treatment with primary antibodies at 4 ℃ overnight. For H9C2 cells: p-PI3K (1:1000, AF3241), PI3K (1:1000, AF6241), p-Akt (1:1000, AF0016), Akt (1:1000, AF6261), TGF-β2 (1:1000, sc-374658), Smad9 (1:1000, AF5114), Faslg (1:1000, AF5333), Bax (1:1000, sc-7480), β-actin (1:1000, 4967 S). For MCMECs: Ang1 (1:1000, 27093-1-AP), VEGFb (1:1000, DF6855), β-actin (1:1000, 4967 S). After washing three times with TBST (Tween-20, NaCl and Tris-HCl), the membranes were treated with secondary antibodies at room temperature for 1 h. The signals were detected by ChemiDoc™XRS + ImagingSystem (Bio-Rad, USA) and quantitatively analyzed using Image J software.
Animals and ethics statement
Animal experiments were performed strictly in accordance with the guidelines of the National Institutes of Health (NIH) and received approval from the Laboratory Animal Ethics Committee of Wenzhou Medical University. 100 healthy male Sprague-Dawley rats (8-week-old) were obtained from Vital River Laboratory Animal Technology Co., Ltd (Beijing, China). Sprague-Dawley rats were housed under standard conditions with a 12-hour light/dark cycle and allowed unrestricted access to water and food. Temperature was kept at 20–25 °C with a relative humidity of 40%−70%. The rats were euthanized through inhaling 2% isoflurane, followed by cervical spine dislocation.
In vivo pharmacokinetic study
For pharmacokinetic analysis, Sprague-Dawley rats received intramyocardial injection of 30 µL of MgSrCeAl-LDH-BSA (1 mg mL−1) into the left ventricular wall. Blood samples were collected at specified time points (0.5, 1, 2, 4, 6, 8, 16, 24, and 48 h), and Mg ion concentration in the blood was monitored by ICP-AES.
In vivo biodistribution study
Sprague-Dawley rats were administered with MgSrCeAl-LDH-BSA (1 mg mL−1, 30 µL) via intramyocardial injection, followed by euthanasia at designated time points (0.5, 1, 2, 4, 8, 12, 16, 24, and 48 h). Major organs (heart, liver, spleen, lungs, and kidneys) were harvested, digested with concentrated nitric acid. Then the Mg ion concentration was determined by ICP-AES to obtain the biodistribution of MgSrCeAl-LDH-BSA in different organs.
Hepatic and renal function
To evaluate the in vivo biocompatibility of MgSrCeAl-LDH-BSA, 8-week-old male SD rats were injected with 30 µL of MgSrCeAl-LDH-BSA (1 mg mL−1) or PBS in the left myocardium, respectively. The blood samples were collected after 14 days and the biosafety of MgSrCeAl-LDH-BSA was evaluated by biochemical tests of hepatic and renal function.
H&E staining
To evaluate the in vivo biocompatibility of MgSrCeAl-LDH-BSA, 8-week-old male SD rats were injected with 30 µL of MgSrCeAl-LDH-BSA (1 mg mL−1) or PBS in the left myocardium, respectively. The major organs were collected after 14 days. Tissues were perfused with PBS to remove the blood, then fixed with formaldehyde (4%) and further underwent paraffin embedding and sectioning. The biosafety of MgSrCeAl-LDH-BSA was evaluated by H&E staining, and images were captured by a fluorescence microscope (Leica, Japan).
Ischemia/reperfusion model
Myocardial I/R was conducted on 8-week-old male SD rats. In brief, rats were anesthetized with 2% isoflurane and mechanically ventilated at a rate of 80–100 strokes per minute using a ventilator (Zhongshi Science & Technology, China). Thoracotomy was conducted to expose the heart, and the left anterior descending coronary artery (LAD) was temporarily ligated with 6 − 0 sutures for 0.5 h, followed by reperfusion upon suture removal (set as MIRI group). Upon loosening the suture, a total volume of 30 µL of MgSrCeAl-LDH-BSA was administered twice (15 µL per injection) into the injury border zones with a 32-gauge needle (set as MIRI + LDH group). Equivolumetric PBS injections were administered into the corresponding sites (set as MIRI + PBS group), while rats in the MIRI group underwent no injection into the infarcted myocardium. For the Sham group, the normal rats underwent no additional procedures except skin preparation, chest opening and heart exposure. Surgical incisions were closed using sterile 4 − 0 sutures. All rats continued to be fed for 14 days, and their weight and mortality condition were recorded.
Exclusion criteria for ischemia/reperfusion model establishment
Preoperative abnormalities: aberrant behavior (e.g., lethargy, aggression), spontaneous diseases (e.g., respiratory infection, skin ulceration).
Intraoperative complications: major hemorrhage (blood loss > 1.5 mL), accidental organ injury (e.g., inadvertent ligation of major vessels, pneumothorax).
Failed ischemia induction: absence of myocardial pallor post-coronary ligation (> 30% left ventricular surface), ST-segment elevation < 0.2 mV after coronary ligation (sustained > 5 min).
Postoperative events: refractory infection (e.g., fever > 39.5 °C, purulent wound).
Echocardiography evaluation
Blinded echocardiographic measurements were performed on Sham, MIRI, MIRI + PBS, MIRI + LDH group rats on day 1 post myocardial I/R injury (dpi), 7 dpi, 14 dpi after anesthesia with 2% isoflurane by the VEVO 2100 echography device (VisualSonics, Toronto, Canada). M-mode tracing was recorded from the left ventricular short-axis view at the papillary muscles level to assess parameters such as LVEF, LVFS, LVSV, LVIDs, and LVESV. All assessments were performed by a single observer who was blinded to the rats’ identities, with measurements taken as the average of three cardiac cycles. Visualization and analysis of the data were conducted using RadiAnt Dicom Viewer software.
Inflammatory cytokine analysis
To assess systemic inflammation levels, blood samples were collected from Sham, MIRI, MIRI + PBS, and MIRI + LDH group rats at 1 dpi. Samples were centrifuged to isolate serum, which were subsequently analyzed using high-sensitivity ELISA kits for quantitative detection of TNF-α, IFN-γ, IL-1β, and IL-18 concentrations.
Evans blue/TTC staining
The hearts from Sham, MIRI, MIRI + PBS, MIRI + LDH group rats were perfused with PBS to remove remaining blood, followed by perfusion with Evans blue (1%, Solarbio). The hearts were sliced into 0.1-cm-thick cross sections, and then treated with TTC (2%, Solarbio) solution in the dark for 15 min. After that, the sections were fixed with paraformaldehyde (4%), and images were captured using a stereomicroscope (Nikon, Japan).
Masson staining
The hearts from Sham, MIRI, MIRI + PBS, MIRI + LDH group rats were perfused with PBS to remove remaining blood, then fixed with formaldehyde (4%) and further underwent paraffin embedding and sectioning. The resulting tissue sections were further treated with Masson’s trichrome Kit (Beyotime) to differentiate the fibrotic and healthy regions. Images were captured by a fluorescence microscope (Leica, Japan) and analyzed by Image J software.
ROS assay in vivo
DHE reagent (Aladdin) was adopted to assess the ROS levels in the cardiac tissue. The 5 μm heart tissue cryosections from Sham, MIRI, MIRI + PBS, MIRI + LDH groups were rinsed with PBS to remove optimal cutting temperature compound (OCT). All heart sections were treated with DHE (5 µM) in a dark, then incubated at 37 ℃ for 20 min. The fluorescence signal was observed using a fluorescence microscope (Leica, Japan) and analyzed by Image J software.
Apoptosis assays
TUNEL reagent (Abcam) was used to analyze the level of apoptosis in myocardial tissue. The hearts from Sham, MIRI, MIRI + PBS, MIRI + LDH group rats were perfused with PBS to remove remaining blood, then fixed with formaldehyde (4%) and further underwent paraffin embedding and sectioning. The resulting tissue sections underwent antigen retrieval under microwave treatment, then rinsed three times with PBS. Afterwards, the sections were treated with TUNEL. Finally, the fluorescence signal was captured by a fluorescence microscope (Leica, Japan) and analyzed using Image J software.
Immunostaining analysis
The 5 μm heart tissue cryosections from Sham, MIRI, MIRI + PBS, MIRI + LDH groups were rinsed with PBS to remove OCT. Following fixation, permeabilization, and blocking, tissues were treated with the indicated primary antibody at 4 ℃ overnight. For immunofluorescence, the sections were treated with following primary antibodies: p-PI3K (1:200, AF3241), p-Akt (1:200, AF0016), α-actinin (1:200, 3134 S), and CD31 (1:200, ab76533). After washing three times with PBST, the sections were treated with secondary antibodies (AlexaFluor Cy5, AlexaFluor FITC, AlexaFluor TRITC) at 37 ℃ for 1 h, followed by DAPI staining. For immunohistochemistry, the sections were treated with following primary antibodies: Cleaved-Caspase3 (1:200, AF7022), TGF-β2 (1:200, sc-374658), Caspase1 (1:200, AF5418), GSDMD-NT (1:200, DF13758) and Ang1 (1:200, 27093-1-AP). After rinsing three times with PBS, the sections were treated with secondary antibodies at 37 ℃ for 1 h, followed by treatment with DAB and counter-stained with hematoxylin. The slides were visualized under a Nikon ECLIPSE Ti microscope (Nikon, Japan).
Statistical analysis
All data were presented as mean ± SEM. Data analysis was conducted using GraphPad Prism 8.0.2 software. Student’s t-test was applied for comparison between the two groups, while One-way ANOVA or Two-way ANOVA followed by a Tukey’s multiple comparison test was employed for comparison among multiple groups. Statistical significance was defined as p < 0.05.