
Demographic data and headache diagnoses of the participants
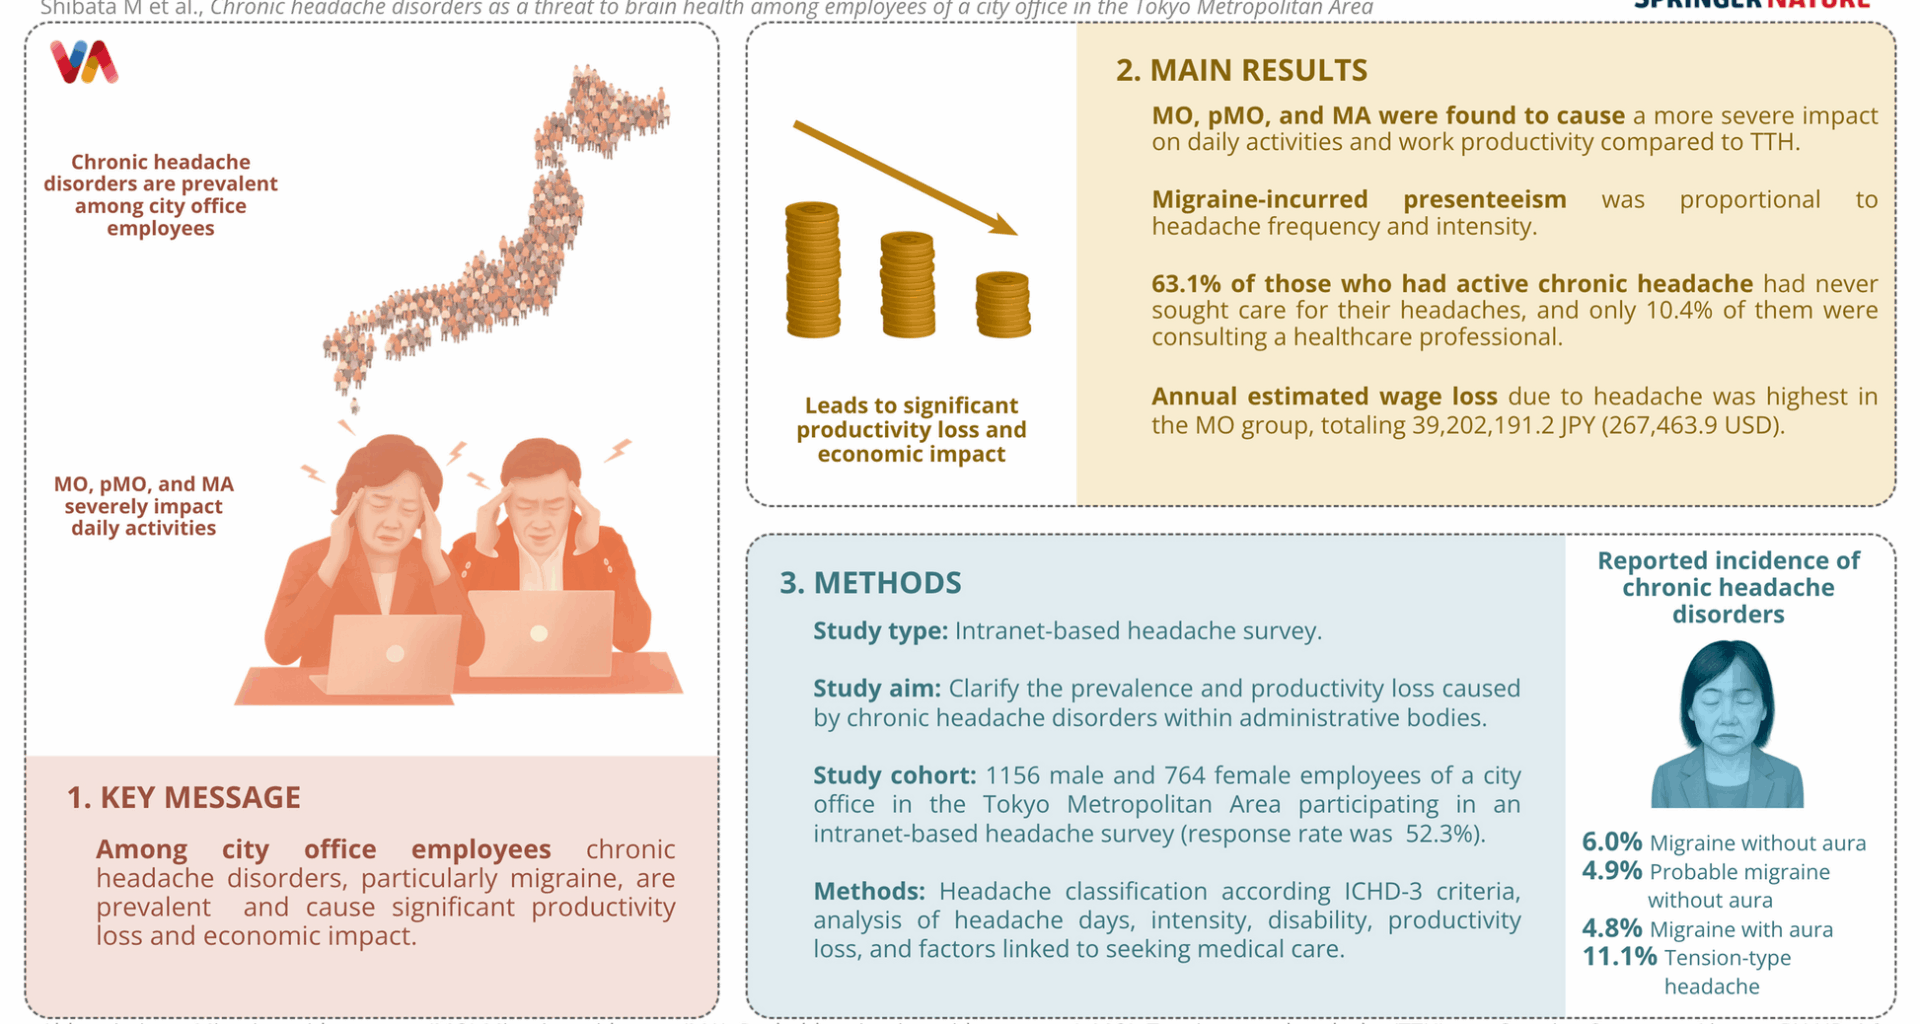
A total of 3682 employees of the Ichikawa City Office were invited to participate in this survey. Among them, 1926 (52.3%) provided informed consent and completed the questionnaire, with 1156 men (60.0%) and 764 women (39.7%). Six respondents did not disclose their sex (Table 1). The age group distribution of the participants is shown in Table 1. The mean body mass index (BMI) was 22.8 ± 3.3. Active chronic headache, defined as described above, was reported by 605 participants (31.4%), while 163 participants (8.5%) did not experience current chronic headache but had a history of chronic headache prior to the past 12 months. Among the individuals with current active chronic headache, 116, 95, 93, and 214 had MO, pMO, MA, and TTH, respectively (6.0%, 4.9%, 4.8%, and 11.1%, respectively) as their most severe and distressing headache. No patients met the criteria for cluster headache. We were not able to establish a headache diagnosis in the remaining 87 participants.
Table 1 Demographic characteristics of study participants
The demographic characteristics of each headache group are presented in Table 2. There was a significant difference in age group distribution between the MO and TTH groups, with individuals in the MO group being younger than those in the TTH group (p = 0.0136, Fisher’s exact test). The proportion of individuals aged 20–29 years was significantly greater in the MO group than in the TTH group (p = 0.0266, Fisher’s exact test). The proportions of females were significantly greater in the MO and pMO groups than in the TTH group (p < 0.0001 and p = 0.0189, respectively, Fisher’s exact test).
Table 2 Demographic and headache characteristics in each headache groupHeadache characteristics and headache-induced impairment in daily activities
The distributions of headache frequency and intensity in each headache group are shown in Table 2 and Supplementary Fig. 1. The most common frequency range was 2–4/month across all the groups. A headache frequency of ≥ 15 days per month was observed in 8.7%, 8.4%, 10.8%, and 7.0% of individuals in the MO, pMO, MA, and TTH groups, respectively (Table 2, Supplementary Fig. 1). With respect to headache intensity, NRS scores were significantly higher in the MO, pMO, and MA groups than in the TTH group (6.6 ± 1.5, 6.4 ± 1.9, and 5.8 ± 2.0 vs. 4.3 ± 1.9, respectively, p < 0.0001, the Kruskal–Wallis test followed by Dunn’s multiple comparisons test, Table 2). However, no differences in NRS scores were observed among age groups (p = 0.7074, Kruskal–Wallis test) (Supplementary Fig. 2). The proportions of individuals reporting that headache interfered with daily activities “sometimes”, “often”, or “always” were significantly greater in the MO, pMO, and MA groups than in the TTH group (95.7%, 90.5%, and 84.9% vs. 58.9%, respectively, p < 0.0001, Fisher’s exact test) (Fig. 1). A significantly greater proportion of individuals in the MO, pMO, and MA groups reported that they felt the need to lie down during headache attacks ‘sometimes,’ ‘often,’ or ‘always’ compared to those in the TTH group (93.1% [p = 0.0002], 90.5% [p = 0.0066], 92.5% [p = 0.0011] vs. 77.5%, respectively, Fisher’s exact test) (Fig. 1). Moreover, a significantly greater proportion of individuals in the MO, pMO, and MA groups worried about planning social or leisure activities because they might have a headache compared to those in the TTH group (25.0% [p < 0.0001], 18.9% [p = 0.0051], and 19.4% [p = 0.0048] vs. 7.5%, respectively, Fisher’s exact test). Across all the headache groups, those who were worried about doing so reported a significantly greater impact of their headache on their regular daily activities, other than working at a job, compared with those who were not worried (Table 3).
Fig. 1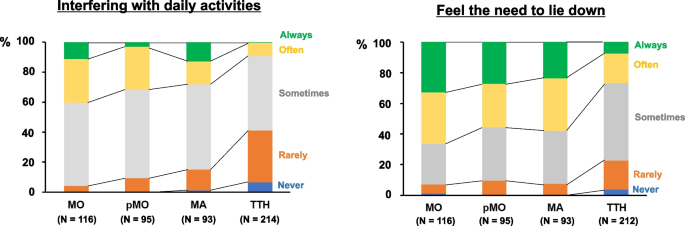
Frequency of negative impact of headache (interfering with daily activities and feeling the need to lie down) in each headache group. Blue: never, Orange: rarely, Gray: sometimes, Yellow: often, Green: always). The number of respondents in each headache group is shown in parentheses
Table 3 Interactal burden and impact on non-job daily activities in each headache groupHeadache management and healthcare resource utilization
Among the 605 individuals with active chronic headache, 382 (63.1%) had never sought care for their headaches, and only 63 (10.4%) were consulting a healthcare professional at the time of the survey. The remaining 160 individuals had discontinued seeing their physicians. Regardless of headache diagnosis, the majority of patients reported utilizing over-the-counter (OTC) analgesics (81.0%, 62.1%, 58.1%, and 55.1% in the MO, pMO, MA, and TTH groups, respectively) to relieve their headaches (Fig. 2). Compared with TTH, migraine was associated with a higher consultation rate at the time of survey (10.3% [p = 0.1919], 17.9% [p = 0.0028], 17.2% [p = 0.0047], and 6.2% in MO, pMO, MA, and TTH, respectively, Fisher’s exact test). With respect to prescribed medications, only a small proportion of active migraine sufferers used triptans (10.3%, 8.4%, and 8.6% in the MO, pMO, and MA groups, respectively). Acetaminophen and nonsteroidal anti-inflammatory drugs (NSAIDs), such as loxoprofen and ibuprofen, were commonly prescribed (10.3%, 10.5%, and 18.3% in the MO, pMO, and MA groups, respectively). The use of migraine preventives was uncommon (6.0%, 8.4%, and 8.6% in the MO, pMO, and MA groups, respectively).
Fig. 2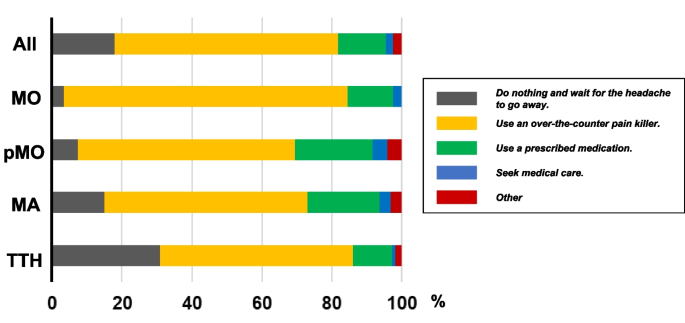
Headache management patterns among individuals with active chronic headache disorders. The data are shown for all participants (All) and separately for each headache group (MO, pMO, MA, and TTH). Data are presented as percentage points in each category
Factors relevant to seeking medical care
We sought to determine which clinical features were linked to seeking medical care among individuals with active chronic headache. In this analysis, we examined the proportion of individuals who were seeking medical care at the time of the survey. According to the univariate analysis, severe headache intensity (NRS: 8–10) significantly increased the likelihood of seeking medical care compared with that associated with mild headache intensity (NRS: 1–4) (odds ratio [OR]: 2.46, 95% confidence interval [CI]: 1.18–4.83, p = 0.0133). In logistic regression analyses in which age group, sex, and headache frequency were used as covariates, vomiting, photophobia, and worsening by physical activity were found to be associated with seeking medical care (Fig. 3A). On the other hand, the frequency of feeling the need to lie down did not influence the likelihood of seeking medical care (Fig. 3B). The frequency of interference with daily activities due to headache tended to increase the likelihood of seeking medical care, although this difference was not statistically significant (p = 0.3669, Fisher’s exact test) (Fig. 3B). A stepwise logistic regression analysis revealed that age (older people were more likely to seek medical care), photophobia, and worsening physical activity were significant predictors of seeking medical care (Supplementary Table 2).
Fig. 3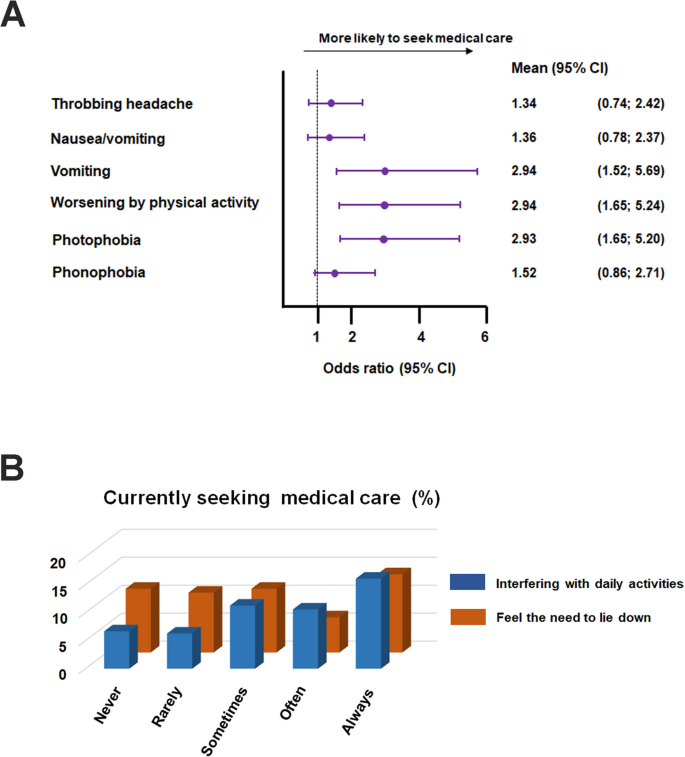
A Clinical features linked to the likelihood of seeking medical care. Data are presented as forest plots, with each bar representing the mean and corresponding 95% confidence interval of the odds ratio for each clinical feature. Numerical data are presented on the right. B Effects of the frequency of negative impact of headache (interfering with daily activities and feeling the need to lie down) on the frequency of patients currently seeking medical care. The vertical axis indicates the proportion of individuals currently seeking medical care. The horizontal axis indicates the frequency with which their headache interferes with daily activities (blue) and makes them feel the need to lie down (brown)
Productivity loss due to headache in the workplace
We compared the impact of headache on work productivity among the headache groups using WPAI metrics. With respect to absenteeism, the number of missed hours due to headache per week did not differ among the headache groups (0.84 ± 3.96, 0.08 ± 0.44, 0.41 ± 1.97, and 0.20 ± 1.87 in the MO, pMO, MA, and TTH groups, respectively; p = 0.838, Kruskal–Wallis test; Fig. 4A). In terms of presenteeism, work productivity was significantly more compromised in the MO, pMO, and MA groups than in the TTH group (3.2 ± 2.5 [p < 0.0001], 2.5 ± 2.5 [p = 0.0131], and 2.5 ± 2.6 [p = 0.018] vs. 1.5 ± 1.9, respectively; Kruskal–Wallis test followed by Dunn’s test; Fig. 4B). The impact of headache on work productivity increased with headache frequency and intensity in individuals with migraine (MO, pMO, and MA) (Fig. 5A). These correlations were less robust in those with TTH (Fig. 5B).
Fig. 4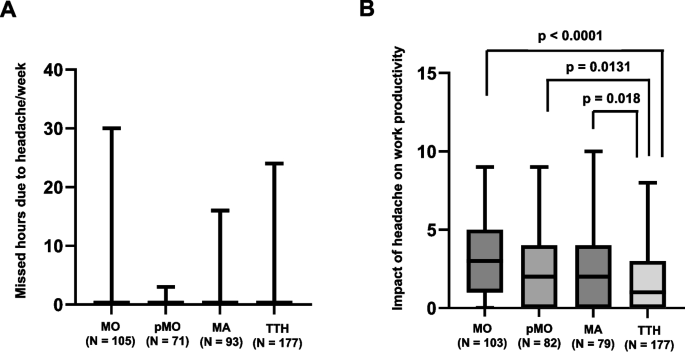
A Missed hours due to headache per week in each headache group. The data are presented as box-and-whisker plots. Between-group comparison was performed by Kruskal–Wallis test. B Missed hours due to headache per week in each headache group. The data are presented as box-and-whisker plots. Between-group comparison was performed by Kruskal–Wallis test followed by Dunn’s test. The number of respondents in each headache group is shown in the parentheses
Fig. 5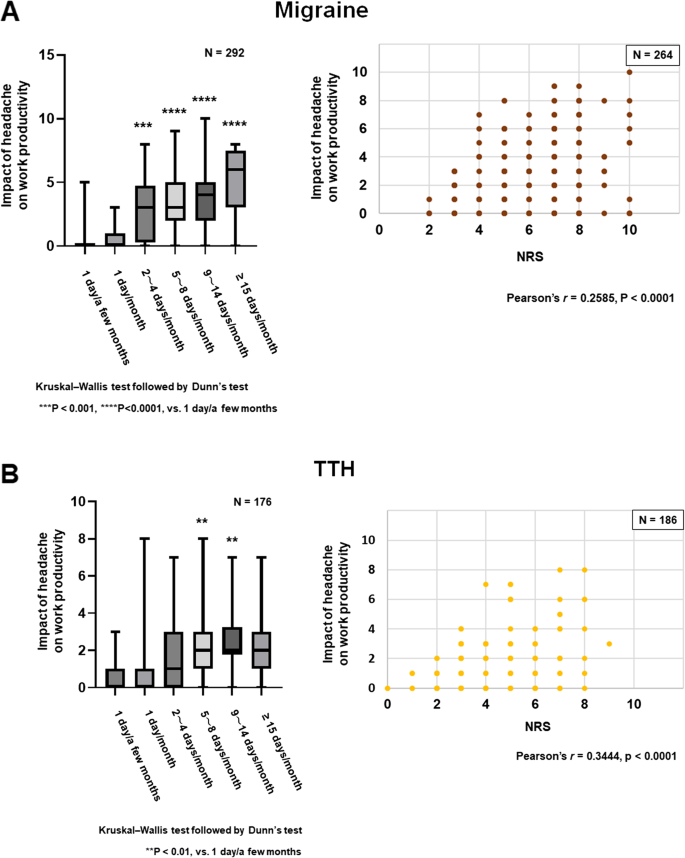
Correlations of the impact of headache on work productivity with headache frequency and intensity in patients with migraine (A) and TTH (B). On the left, the data are presented as box-and-whisker plots. Statistical analyses were performed by Kruskal–Wallis test followed by Dunn’s test (left) and Pearson’s test (right). For migraine, the combined data from the MO, pMO, and MA groups were analyzed
Based on the wage data provided by the Ichikawa City Office, we estimated headache-associated economic loss (lost wage) in each headache group. The annual estimated wage loss due to headache was highest in the MO group, totaling 39,202,191.2 JPY (267,463.9 USD) per year, 81.6% of which was derived from presenteeism (Fig. 6A and 6B, Table 4). The annual estimated wage loss per capita in the MO group was 355,828.9 JPY (2,427.7 USD) (Table 4). The detailed data for each headache group are presented in Table 4. It was estimated that active chronic headache disorders were responsible for 8.6% of the total wage.
Fig. 6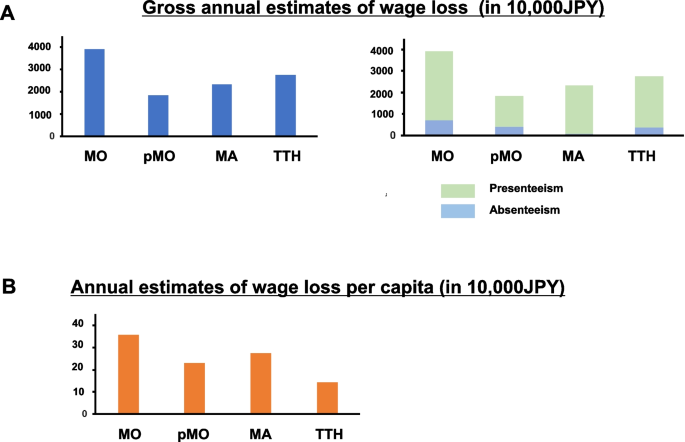
Economic loss due to chronic headache disorders among employees of Ichikawa City Office. A On the left hand, gross annual estimates of wage loss in each headache group. On the right hand, the breakdown into the presenteeism (light green) and absenteeism (sky blue) portions is shown. B Annual estimates of wage loss per capita in each headache group. The amounts are indicated in 10,000JPY
Table 4 Annual estimated wage loss due to headache in each headache group (in JPY)