
Observations and data reduction
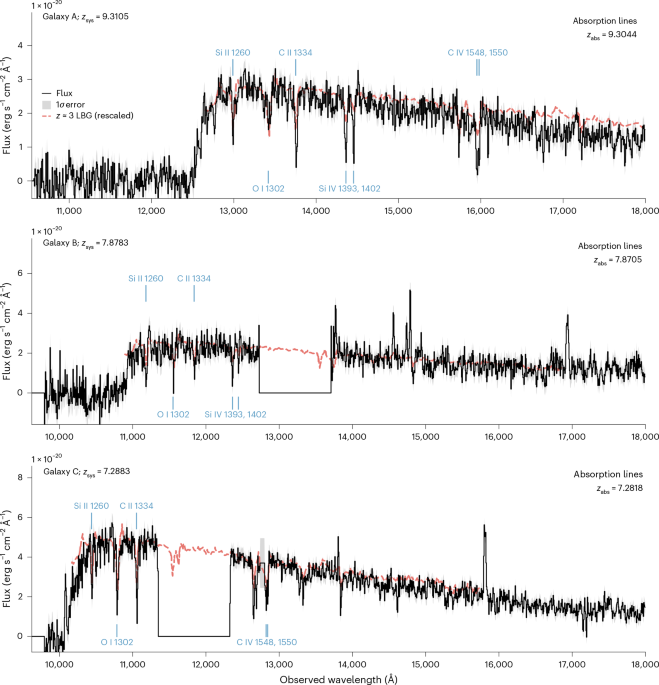
The data analysed in this work were obtained as part of the JWST Cycle 4 programme SPURS in the Abell 2744 field17,51. Medium-resolution spectroscopy was carried out with JWST/NIRSpec52 in micro-shutter assembly (MSA) mode using the three medium-resolution gratings F100LP/G140M, F170LP/G235M and F290LP/G395M, providing continuous wavelength coverage from ~1 to 5 μm. Each galaxy was observed with all three gratings using a standard three-nod dithering pattern to improve background subtraction and mitigate detector artefacts. The effective exposure times were 29.2 h for G140M, 7.9 h for G235M and 2.9 h for G395M. In this work, we analyse the three galaxies at z > 7 in SPURS whose rest-frame ultraviolet continuum near 1,450 Å is detected at a signal-to-noise ratio >10, enabling absorption-line measurements against the stellar continuum.
The raw data were reduced and calibrated using the JWST Calibration Pipeline53, version 1.14.0, with Calibration Reference Data System (CRDS) context jwst_1236.pmap. The calwebb_detector1 stage was used to process the uncalibrated exposures and generate slope images, followed by the calwebb_spec2 stage to perform wavelength calibration, flat-fielding, flux calibration and local background subtraction, producing rectified two-dimensional spectra for each nod position. Spectra from individual nods were then combined using the calwebb_spec3 stage. One-dimensional spectra were extracted using a boxcar aperture centred on the spatial trace of each galaxy. For all targets, spectra obtained with the three medium-resolution gratings were stitched together to form a continuous spectrum, with overlapping wavelength regions used to verify flux consistency. In addition to the standard pipeline steps, we applied custom procedures for hot pixel rejection, mitigation of low-level detector noise, and treatment of spatially extended sources, following the approach described in ref. 54. Flux uncertainties were propagated through all reduction steps and carried forward in subsequent measurements. We further scale the pipeline-provided flux uncertainties by a factor of 1.7 to account for residual pixel-to-pixel variations that are not fully captured by the formal error model55,56,57.
Photometric fitting and host-galaxy properties
To characterize the host galaxies, we fit their SEDs using publicly available HST and JWST imaging in the Abell 2744 field, fixing the redshift of each source to the NIRSpec spectroscopic measurement. The input photometry includes the HST filters F435W, F606W and F814W, together with JWST/NIRCam imaging spanning both broad and medium bands: F070W, F090W, F115W, F140M, F150W, F162M, F182M, F200W, F210M, F250M, F277W, F300M, F335M, F356W, F360M, F410M, F430M, F444W, F460M and F480M. We model these data with Prospector, following the same fitting strategy as in ref. 54. The model includes flexible star-formation-history, stellar-population, dust-attenuation and nebular-emission components appropriate for non-AGN star-forming galaxies at high redshift. We use a non-parametric star formation histories (SFHs) with seven age bins. The bin edges are logarithmically spaced from \({\log }_{10}(t/{\rm{yr}})=7.1295\) to \({\log }_{10}(0.9\,{t}_{{\rm{univ}}}/{\rm{yr}})\), with an additional final bin extending to \({\log }_{10}({t}_{{\rm{univ}}}/{\rm{yr}})\), where tuniv is the age of the Universe at the galaxy redshift and t is measured as lookback time from that redshift. We replace the first logarithmic bin edge, 107.1295 years, with zero lookback time. In practice, for the redshift range of the three galaxies (z = 7.3–9.3), the bin edges correspond to lookback times of approximately 0, 24–26, 44–49, 80–94, 144–179, 261–341, 471–651 and 524–724 Myr. For Galaxies A, B and C, the fits yield stellar masses of \(\mathrm{log}({M}_{\star }/{M}_{\odot })=9.8{0}_{-0.05}^{+0.06}\), \(9.1{1}_{-0.01}^{+0.01}\) and \(9.4{8}_{-0.01}^{+0.01}\), observed ultraviolet slopes of \({\beta }_{{\rm{UV}},{\rm{obs}}}=-2.1{9}_{-0.01}^{+0.01}\), \(-2.1{2}_{-0.01}^{+0.01}\) and \(-2.2{6}_{-0.01}^{+0.01}\), dust attenuation parameters of \({\mathtt{dust2}}=0.4{5}_{-0.07}^{+0.08}\), \(1.1{3}_{-0.02}^{+0.02}\) and \(0.4{4}_{-0.01}^{+0.01}\), stellar metallicities of \(\mathrm{log}({Z}_{\star }/{Z}_{\odot })=-1.7{6}_{-0.09}^{+0.07}\), \(-1.6{8}_{-0.02}^{+0.02}\) and \(-1.97{8}_{-0.001}^{+0.002}\), and gas metallicities of \(\mathrm{log}({Z}_{\mathrm{gas}}/{Z}_{\odot })=-0.5{2}_{-0.09}^{+0.09}\), \(-0.8{5}_{-0.01}^{+0.01}\) and \(-0.7{8}_{-0.02}^{+0.02}\), respectively. The uncertainties quoted here correspond to the 16th–84th percentile ranges of the posterior distributions; the typical systematic uncertainty of this SED-fitting framework is ±0.15 dex (ref. 54). The recent star-formation histories inferred from the fits are also substantial, with youngest-bin star-formation rates of 19, 39 and 29 M⊙ yr−1 for Galaxies A, B and C, respectively.
Systemic redshifts and velocity reference frame
Accurate systemic redshifts are essential for interpreting absorption-line kinematics. Extended Data Fig. 1 shows observed-frame cutouts of Hβ λ4861 and the [O III] λλ4959, 5008 doublet for all three galaxies. For each galaxy, we adopt the centroid of [O III] λ5008 as the fiducial systemic reference, as this is the strongest and most robustly measured nebular line in the current data. We independently fit Hβ where detected and use it as a consistency check on the systemic frame. For Galaxy C, Hβ agrees with [O III] λ5008 within ~5 km s−1, whereas for Galaxy B it is offset redward by ~90 km s−1; adopting Hβ in that system increases the inferred absorption blueshift. For Galaxy A, Hβ is only weakly detected and does not provide a comparably reliable independent centroid. Lower-redshift interloper solutions are disfavoured by the combination of the Lyα break, the Hβ+[O III] line pattern at a common redshift, and the absence of other sources within the MSA slitlets. Emission-line centroids were measured by fitting Gaussian profiles to continuum-subtracted spectra, with uncertainties estimated from the covariance matrix of the fit. The nebular profiles show no separate, well-constrained broad or shifted emission component. We therefore use the nebular lines to define the systemic frame, while the absorption-line kinematics provide the evidence for outflowing or otherwise disturbed gas. For Galaxy A, [O III] λ5008 lies near the red end of the G395M wavelength range, but the fitted line window remains within the available spectral coverage, the wavelength solution extends beyond the fitted window, and the line centroid is not clipped by the data edge. All absorption-line velocities are computed relative to these adopted nebular systemic redshifts, and Table 1 reports the corresponding velocity uncertainties. The absorption-line velocities are reported relative to this systemic frame as
$$v=c\,\frac{{z}_{{\rm{abs}}}-{z}_{{\rm{sys}}}}{1+{z}_{{\rm{sys}}}},$$
(1)
where zabs is the absorber redshift and c is the speed of light. We also considered whether the stellar continuum could provide an independent systemic velocity reference, but the spectra do not show stellar absorption features strong enough to yield a velocity zero point with precision comparable to the nebular-line centroids.
For completeness, we also measure rest-frame optical nebular emission-line flux ratios from the same NIRSpec spectra used to determine systemic redshifts. The measured [O III] λ5008/Hβ ratios are 8.0 ± 1.7, 8.1 ± 0.3 and 6.7 ± 0.2 for Galaxies A, B and C, respectively. Such high ratios are commonly observed in low-metallicity star-forming galaxies at high redshift and can also arise under harder ionizing conditions. We do not attempt to use these line ratios to discriminate between ionizing sources or excitation mechanisms. Although AGN can also drive efficient baryon cycling and metal redistribution58, the current spectra do not show a definitive AGN diagnostic, such as broad emission lines with full width at half maximum (FWHM) >1,000 km s−1. Importantly, the identification, kinematics and abundance inferences of the absorption features presented in this work do not depend on the physical origin of the nebular emission.
Continuum normalization, absorption-line identification and profile fitting
We measure absorption-line properties in a two-step procedure that (1) fits a local linear continuum around each transition and produces a continuum-normalized spectrum, and (2) fits Voigt absorption models to the normalized profiles. For each transition, we extract a wavelength window of typically ±300–500 Å around the expected observed wavelength based on zsys. We fit the local continuum with a linear model, fλ = a + b(λ − λ0), using inverse-variance weighting. To avoid bias from line features, we mask a central region of ±12–25 Å around the expected line centre (depending on transition and spectral resolution) and iteratively sigma-clip (4σ) outliers in the remaining continuum region repeated for up to three iterations. In addition, when other obvious absorption features fall within the continuum window (for example, unrelated lower-redshift absorbers not discussed in this work), we manually mask those regions before the continuum fit; for the Galaxy C C IV doublet, this includes masking the adjacent blue-side absorption feature before fitting the local continuum. Masked intervals due to noisy data are visible as locally increased uncertainties in the relevant wavelength ranges. The observed spectrum is divided by the best-fitting linear continuum to obtain a continuum-normalized flux and uncertainty spectrum.
Absorption features are identified at the expected wavelengths of known metal transitions, requiring ≳3σ significance, where available, consistent detections across multiple transitions tracing the same ion or ionization phase. We fit the continuum-normalized absorption profiles using Voigt models. For isolated single transitions (O I λ1302, Si II λ1260, C II λ1334), we fit a single component characterized by the absorber redshift zabs, a Gaussian width σg (in wavelength units), a Lorentzian damping parameter γl and a line-centre optical-depth normalization τ0 of an area-normalized Voigt profile. Fits are performed via χ2 minimization, with parameter bounds chosen to avoid unphysical solutions, including enforcing a minimum resolved width comparable to the instrumental core. For resonance doublets (Si IV λλ1393, 1402 and C IV λλ1548, 1550), the two components are fit simultaneously, enforcing a common absorber redshift and kinematic width and fixing the optical-depth ratio to the ratio of oscillator strengths. EWs for the two components are measured separately within integration windows defined as ±3σg around each fitted line centre, with the additional requirement that the integration domains lie on opposite sides of the midpoint between the two components to prevent overlap when the doublet is partially blended.
At the spectral resolution of these data (R ≈ 1,000), the fitted profiles and measured EWs should be interpreted as effective, unresolved representations of potentially multiple narrow components, following, for example, ref. 19. In particular, for C II λ1334, the measured EW may include contributions from unresolved fine-structure absorption (C II* λ1335) and weak wing structure, which cannot be reliably separated at the present resolution and signal-to-noise ratio. We also identify tentative absorption consistent with Si II* λ1264 in Galaxy A (for example, ref. 59); however, given the low signal-to-noise ratio and potential blending with the Si II λ1260 profile, we do not attempt an explicit fit or EW measurement for this feature.
We report two EW estimates for each transition. The primary measurement is the data EW, computed by direct integration of (1 − Fnorm) over an objectively defined line window. For single transitions, the integration window is taken as ±3σg around the fitted line centre. For doublets, EWs are computed for each component within ±3σg of its fitted centre (split at the doublet midpoint) and summed to obtain a total doublet EW. The corresponding statistical uncertainty is computed by propagating the normalized flux uncertainties across the same integration window. In addition, we compute a model EW by integrating the best-fitting Voigt model over the same window; its uncertainty is estimated from the parameter covariance via finite-difference propagation. Rest-frame EWs are obtained by dividing observed-frame values by (1 + zabs). We also record the minimum continuum-normalized flux within the integration window as a model-independent measure of line depth and saturation. The fitted optical-depth normalizations τ0 are provided for reference only. Given the moderate spectral resolution, the presence of saturation and the possibility of partial covering, τ0 and Voigt-derived column densities are not used as primary constraints. Throughout the main text, we therefore emphasize EWs, minimum normalized fluxes and overlapping kinematics as the most robust observables. Our measurements are summarized in Table 1.
Extended Data Fig. 2 shows a validation of these detections for all three galaxies in this work. For each galaxy and transition, the two-dimensional NIRSpec spectra and the corresponding one-dimensional extracted spectra with the best-fitting absorption profiles overlaid are shown, together with the integration windows used for EW measurements after local continuum normalization. The spatial coincidence of the absorption features with the galaxy continuum trace in the two-dimensional spectra shows that the detected lines are associated with the target galaxies instead of detector artifacts or background residuals. The fitted line centroids also show blueshifted absorption and ionization-dependent velocity structure, summarized in Fig. 3.
Line centroid uncertainty estimation
To quantify realistic uncertainties on line centroid measurements given the moderate spectral resolution of the NIRSpec medium-resolution gratings (R ≈ 1,000), we performed mock line-injection tests directly on the observed, calibrated one-dimensional spectrum. Synthetic Gaussian absorption features were injected at representative wavelengths (for example, λ ≈ 15,500 Å) with widths fixed by the typical grating resolution, σ = λ/(2.355R), and with depths comparable to those of the detected absorption lines. The injected features were added to the real spectrum, preserving the native wavelength grid, noise properties and any correlated residual structure. For each realization, we refit the line centroid using the same fitting procedure applied to the science data. Repeating this procedure for 3,000 Monte Carlo realizations, we find a negligible centroid bias (~−15 km s−1) and a 1σ scatter of ~47 km s−1.
As discussed earlier, the formal pipeline uncertainties underestimate the true pixel-to-pixel variance in the NIRSpec spectra. When the flux uncertainties are conservatively scaled by a factor of 1.7 to account for this effect, the corresponding centroid scatter increases to ~133 km s−1. The velocity uncertainties reported in Table 1 are the statistical fit uncertainties from the profile fits; the injection-based scatter is used as a conservative guide to the robustness of individual centroid offsets. The repeated occurrence of blueshifted absorption across multiple transitions and galaxies, together with the overlapping velocity structure within each system, indicates that the measured velocity shifts are not driven by a single marginal centroid measurement. The injection tests provide an empirical estimate of the typical centroid uncertainty.
Constraints on gas temperature from line widths
As a consistency check, we use the measured absorption-line widths to place thermal-only upper limits on the gas temperature. For each transition, we adopt the fitted Gaussian dispersion in wavelength units, σg, from the profile fitting described above, and convert it to a velocity dispersion using a reference wavelength λref (the fitted line centre for single transitions and the midpoint of the fitted doublet components for Si IV and C IV).
Because the observed widths include instrumental broadening, we correct them using a Gaussian approximation to the instrumental profile with resolving power R ≈ 1,000. We take FWHMinst = λref/R and σinst = FWHMinst/2.355, and estimate the intrinsic width via quadrature subtraction, \({\sigma }_{\mathrm{int}}^{2}={\sigma }_{{\rm{g}}}^{2}-{\sigma }_{\mathrm{inst}}^{2}\). This correction is intended only for order-of-magnitude thermal checks. The exact NIRSpec line-spread function varies with wavelength, so σint values near the instrumental limit should not be over-interpreted. At the same time, because the effective resolution is generally better at the longer observed wavelengths corresponding to higher-redshift lines, the resolved/unresolved classification is unlikely to be set primarily by this wavelength dependence. Transitions that are unresolved under this correction (that is, σg ≲ σinst within a small tolerance) or that reach the imposed minimum width in the fitting procedure are excluded from the temperature analysis. Accordingly, differences in fitted σint among transitions do not by themselves imply distinct bulk kinematics, as they can also reflect unresolved substructure, saturation, blending and measurement uncertainty near the resolution limit.
We convert σint to a Doppler parameter b = c σint/λref and compute
$${T}_{\max }=\frac{m\,{b}^{2}}{2{k}_{{\rm{B}}}},$$
(2)
where m is the atomic mass of the ion and kB is the Boltzmann constant. These values are upper limits on the thermal temperature, as any contribution from turbulence, bulk flows or unresolved velocity substructure would reduce the thermal component of the line width. The resulting limits are therefore interpreted only as indicative checks on physical plausibility instead of direct temperature measurements.
The inferred \({T}_{\max }\) values for neutral (O I), low-ionization (Si II, C II) and high-ionization (Si IV, C IV) species in each galaxy are shown in Extended Data Fig. 3. Because these limits exceed the ionization survival temperatures of the detected species, the observed line widths are probably dominated by non-thermal motions. This is consistent with lower-redshift studies in which multiphase galaxy-associated absorption reflects substantial unresolved or turbulent kinematic structure60,61,62.
Ionic column-density lower limits and relative carbon absorption
We first compute conservative ionic column-density lower limits from the measured rest-frame EWs. We use the optically thin linear curve-of-growth relation63
$${N}_{{\rm{ion}}}=1.13\times 1{0}^{20}\frac{{W}_{0}}{{\sum }_{i}\;{f}_{i}{\lambda }_{i}^{2}}\,{{\rm{cm}}}^{-2},$$
(3)
where W0 and λi are in Å, and the sum is taken over both components for doublets. These values, listed in Extended Data Table 1, are lower limits because unresolved saturation and partial covering can increase the true ionic columns. We do not infer a total metal mass or Mmetal/M⋆, as that conversion requires the absorber area, covering fraction, geometry and ionization correction.
The optically thin limits in Extended Data Table 1 are intended only as conservative ionic column-density lower limits and are not used to derive the carbon ratios shown in Extended Data Fig. 4. As a qualitative, order-of-magnitude probe of the ionization structure of the galaxy-associated absorbing gas, we examine the ratio of low- to high-ionization carbon, N(C II)/N(C IV), for systems with coverage of both transitions. Ratios between C II and C IV have been widely used as empirical indicators of multiphase gas in absorption systems; however, their interpretation depends sensitively on line saturation, covering fraction and spectral resolution. At the moderate resolution of the NIRSpec medium-resolution gratings (R ≈ 1,000), intrinsically saturated absorption with partial covering can appear unsaturated, placing the inferred column densities on the flat part of the curve of growth and allowing order-of-magnitude variations in N for modest changes in line depth.
For the carbon-ratio comparison, we use optical-depth integrals of the best-fitting Voigt profiles. For C II λ1334, we adopt the fitted (τ0, σg) from the single-line fit. For the C IV doublet, we use the (τ0, σg) from the simultaneous doublet fit and adopt an effective oscillator strength equal to the sum of the two components. Given the likelihood of unresolved saturation and non-uniform covering, the resulting ratios should not be interpreted as precise column-density measurements.
As shown in Extended Data Fig. 4, the inferred N(C II)/N(C IV) ratios fall within the broad range spanned by quasar-selected absorbers at z ≈ 2–6 (refs. 64,65), including systems at 5 ≲ z ≲ 6.3 from the E-XQR-30 sample65; also see refs. 12,28,66,67,68,69,70,71,72,73,74,75,76,77,78. We use this comparison strictly as a consistency check, noting that the present data do not permit robust constraints on ionization state from carbon ratios alone.
To provide qualitative guidance on the ionization conditions compatible with the observed ratios, we computed a set of simple photoionization models using CLOUDY (c25)79. The models assume plane-parallel geometry, constant density, and a single-phase slab illuminated by an external radiation field. We explored a broad range of ionization parameters, gas densities and total hydrogen column densities, focusing on reproducing the observed N(C II)/N(C IV) ratios. Matching the observed values requires ionization parameters of \(\mathrm{log}U\,\approx \,\text{minus1.9}\) to −2.0 across a wide range of densities. These models are intended to provide qualitative guidance only; our main conclusions do not depend on the details of the photoionization modelling and instead rest on the overlapping kinematics and coexistence of low- and high-ionization absorption.
Relative abundance ratios
We also compute approximate coordinates in the [Si/O]–[C/O] plane (Extended Data Fig. 5) using the neutral transition O I λ1302 and the low-ionization transitions C II λ1334 and Si II λ1260. For each line, we adopt the model rest-frame EW W0,model obtained from the best-fitting Voigt profile and convert to an optically thin column density using the linear curve-of-growth relation. Solar abundance ratios are taken from ref. 80.
At the spectral resolution of these data, the low-ionization transitions are strong and probably affected by unresolved saturation and non-uniform covering fractions. In this regime, modest changes in optical depth or ionization corrections can lead to substantial shifts in inferred column densities. The resulting [Si/O] and [C/O] values should therefore be interpreted as empirical line-strength ratios mapped onto abundance space for rough comparison.
For reference, we compare these systems to quasar-selected absorbers from the XQR-30 compilation76 and to representative chemical-evolution model regions from ref. 81, as implemented by ref. 76. The inner model regions represent negligible Population III contributions and use Population II nucleosynthetic yields from ref. 82 and ref. 83, while the enclosing region permits a non-dominant Population III contribution. We also add quasar-selected absorbers from JWST/NIRSpec observations in ref. 69 for reference. We do not attempt to infer nucleosynthetic channels or stellar populations from these comparisons. Instead, we use the diagram as a qualitative consistency check: all three galaxies occupy regions overlapping previously studied high-redshift absorbers and do not exhibit extreme offsets relative to lower-redshift systems. Within the systematic uncertainties described above, the line ratios are therefore consistent with enrichment patterns commonly observed in metal-bearing gas at later cosmic times.
At the same time, the presence of chemically enriched gas associated with galaxies by z ≈ 9 places strong constraints on the timescale and efficiency of early metal production10,84,85,86. These observations suggest that substantial carbon and oxygen enrichment can arise extremely rapidly, as illustrated by Galaxy A at z = 9.3 in this work and by the detection of strong rest-frame optical C and O emission lines in galaxies at z > 14 (refs. 3,87,88). Recent models show that such rapid enrichment does not require a dominant Population III contribution: Population II star formation with an upper stellar mass cutoff of ~200–300 M⊙ can efficiently reproduce high metal yields on short timescales33. Similar very massive, low-metallicity stars have been invoked to explain the high ultraviolet luminosities of galaxies at z ≳ 10 (refs. 34,35), consistent with theoretical expectations that the maximum stellar mass increases at low metallicity owing to reduced opacity and enhanced radiative transparency36,89. In this sense, while the relative-abundance measurements presented here do not obviously require exotic enrichment channels, they are consistent with an early onset of baryon cycling driven by highly efficient star formation in the first galaxies.