
Materials
Ti3AlC2 was supplied by Zhongke Experimental Materials Co., Ltd. (China). Ethyl alcohol, HCl, and lithium fluoride (LiF) were supplied by Aladdin Reagent Co., Ltd (Shanghai, China). Polyethylene glycol-2000 (PEG-2000), phosphate buffer, and normal saline were purchased from Sangon Biotech Co., Ltd (Shanghai, China). DMEM/F12 medium, trypsin, Earle’s balanced salt solution (EBSS), fetal bovine serum (FBS), poly-L-lysine, and Penicillin-Streptomycin Solution (Dual Antibody) were supplied by Shanghai Yuanye Bio-Technology Co., Ltd (China). Fluo-4 AM (excitation/emission maxima: 494 nm/506 nm) and DiO were purchased from Shanghai Biyuntian Biological Co., Ltd (China). All chemicals were used as received without further purification.
Preparation of pre-PANS
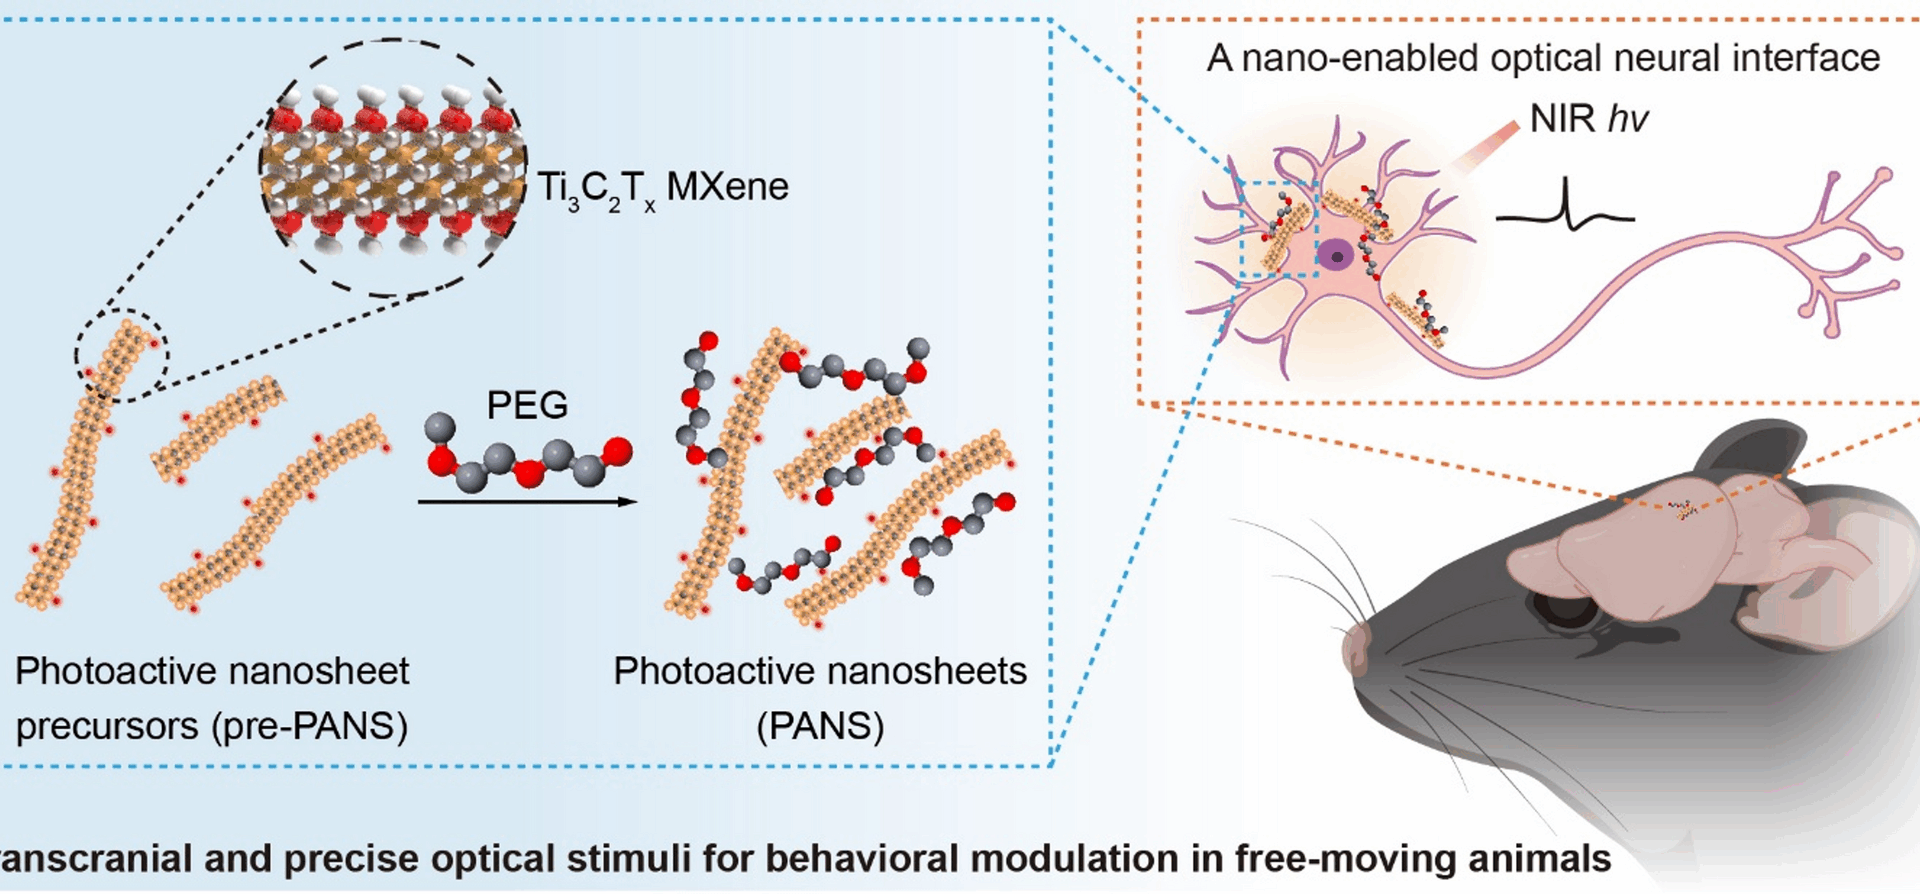
By using a fluorine-containing salt solution to chemically etch the Al layer in Ti3AlC2 material, pre-PANS nanosheets of Ti3C2Tx were successfully prepared. Firstly, 1 g of LiF was dissolved in 20 mL of 9 M HCl in a polytetrafluoroethylene container, and a homogeneous solution was formed through magnetic stirring to ensure complete dissolution of LiF. Subsequently, 1 g of Ti3AlC2 powder was slowly added into the solution under ice bath conditions, with continuous stirring for 1 h to ensure thorough mixing. The mixture was then placed in a water bath at 35 °C and stirred for 24 h to complete the chemical reaction. After the reaction, the acidic solution was removed by centrifugation at 3500 rpm for 5 min. The reaction product was transferred to a centrifuge tube, and the washing and centrifugation process with ultrapure water was repeated until the pH of the solution approached 6. At this point, the solution turns dark green, and the precipitate expands and becomes more viscous, indicating the formation of multi-layered Ti3C2Tx material. Finally, the multi-layered Ti3C2Tx was redispersed in water and treated with ultrasound for 1 h under argon protection to exfoliate the material into few-layer Ti3C2Tx (Fig. 1aIII). The upper clear liquid was collected by centrifugation at 3500 rpm for 1 h, yielding a suspension of few-layer Ti3C2Tx.
Fig. 1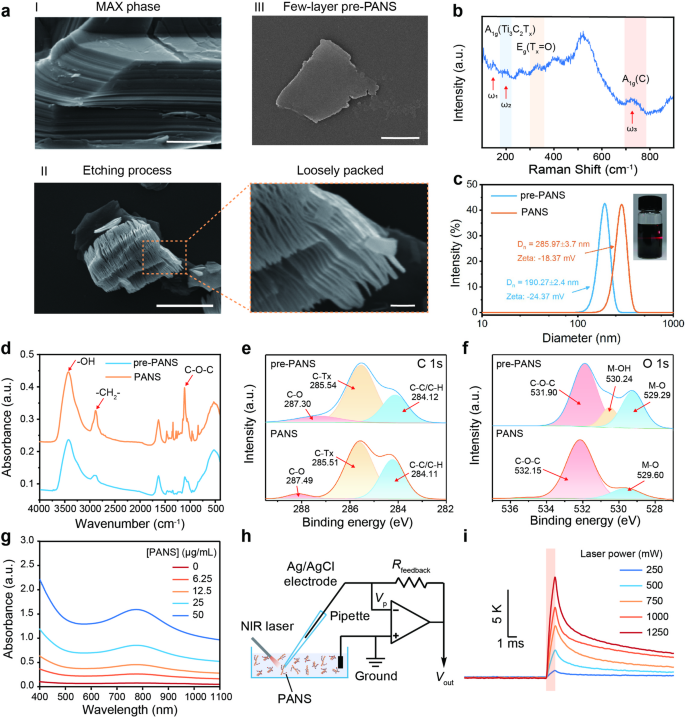
Fabrication and characterization of PANS. (a) SEM images of (I) MAX phase (scale bar: 500 nm), (II) layered pre-PANS (scale bar: 10 μm in the left and 1 μm in the right), and (III) few-layer pre-PANS (scale bar: 1 μm). (b) Raman scattering spectrum of pre-PANS. (c) DLS analyses of pre-PANS and PANS, with the corresponding zeta potentials annotated. The inset shows the Tyndall effect of the few-layer pre-PANS dispersion. (d) The PANS exhibit characteristic FTIR absorption peaks of PEG, indicating that PEG has been successfully modified onto MXene. (e) The C 1s core level spectra of pre-PANS and PANS obtained from XPS. (f) The O 1s core level spectra of pre-PANS and PANS obtained from XPS. (g) UV-Vis-NIR absorption spectrum of PANS. (h) Schematic illustration of the experimental setup for the photoresponse measurement of PANS. (i) Representative traces of the local temperature dynamics of PANS under different laser illumination. The NIR illumination is indicated by red shading
Preparation of PANS
The dispersion and biocompatibility of pre-PANS were enhanced by the functionalization of PEG. Specifically, to ensure effective interaction between the pre-PANS surface and PEG molecules to form a stable complex, the pre-PANS suspension was mixed with PEG (molecular weight of 2000) in deionized water and stirred continuously for 6 h. To further improve the uniformity and dispersion of the PANS composite, it was subjected to ultrasonic treatment for 30 min. Afterwards, unreacted PEG and other possible impurities were removed by centrifugal separation, and PANS nanocomposites were collected from the supernatant for future in vivo applications.
Characterization
For electron microscopy, the samples were sonicated in anhydrous ethanol and dispersed onto silicon slice, followed by drying on a heating plate at 50℃. The morphology of materials was then imaged using a GeminiSEM 300 scanning electron microscope (SEM) (ZEISS, Germany) with 200-mesh ultra-thin carbon film copper grids, which equipped with EX-250 energy-dispersive spectrometer (EDS). To capture a single piece of MXene, the upper clear liquid was dispersed on a copper mesh and left to stand for 5 min. Excess ethanol was gently removed using filter paper, and the sample was allowed to evaporate completely. The microstructure of materials was acquired using a JEM-2100 F transmission electron microscopy (TEM) (JEOL, Japan). The residual ion concentrations in pre-PANS and PANS were quantified by a 7700x inductively coupled plasma spectroscopy/mass spectrometry (ICP-OES/MS) (Agilent, America).
For optical property analysis, different concentrations of materials (6.25, 12.5, 25, 50 µg/mL) were dissolved in deionized water, and their optical properties were measured using a UV-3600 UV-Vis-NIR spectrophotometer (Shimadzu, Japan). Additionally, the chemical structure of materials was characterized using inVia Reflex Raman spectroscopy (with λex = 514 nm, Renishaw, UK). Dynamic light scattering (DLS) and zeta potential measurements were conducted with a ZetaSizer Nano (ZEN3600) and polystyrene cuvettes (ZSU1002) from Malvern Panalytical Limited. Disposable polystyrene semi-micro cuvettes with a path length of 1 cm were used for these measurements.
Measurement of photothermal properties
A standard patch-clamp setup was employed for the photo-response measurements as described before [20, 29]. Specifically, an external laser source produces a 980 nm laser, which was delivered to the PANS through a 200 μm fiber. A digitizer (Molecular Devices, USA, Digidata 1440) delivered transistor-transistor logic (TTL) signals (1 ms) to control the light pulses. Voltage-clamp protocols were performed by an Axopatch 200B amplifier (Molecular Devices, USA), which was controlled by pClamp software (Molecular Devices, USA). Glass pipettes were fabricated using a CO2 laser-based micropipette puller (Sutter Instrument, USA, P-2000). PANS were dispersed in PBS for photothermal measurement. The pipette tip was placed in the PANS suspension, and the electrode tip was aligned with the stimulating light source. The ionic current across the micropipette and the resistance of the micropipette were continuously recorded in voltage-clamp mode. The dependence of the photothermal current (ΔIthermal (t)) on resistance can be expressed by the following equation:
$$\Delta I_{thermal} (t) =\left(\frac{{R}_{0}}{{R}_{t}}-1\right)\times\:{I}_{0}$$
(1)
where R0, Rt, I0, and Ithermal represent the micropipette resistance at room temperature, the micropipette resistance during one-millisecond laser illumination, the current in the dark, and the photothermal current, respectively. After the photo-response measurement, the same micropipette is placed in PBS at ~50 °C. A thermocouple is placed close to the pipette tip during the temperature measurement. A calibration curve was created based on the change in micropipette resistance between 50 °C and 20 °C, which was then used to estimate the local temperature increase [30, 31]. The relationship between temperature and the micropipette’s resistance follows the Arrhenius law:
$$\:\text{ln}\left(\frac{R{t}}{{R}_{0}}\right)\:=\:\frac{A}{T}+C\:$$
(2)
Where A, T, C, Rt, and R0 represent the calibration curve slope, the temperature, the calibration curve intercept, the measured micropipette resistance, and the micropipette resistance at room temperature, respectively.
Cytotoxicity analysis
Live and dead cell staining experiments were conducted to assess cell viability and cytotoxicity. Calcein AM (excitation/emission maxima: 495 nm/515 nm) was used to stain live cells, emitting green fluorescence, while Propidium Iodide (PI) (excitation/emission maxima: 535 nm/717 nm) stained dead cells, showing red fluorescence. Calcein AM can penetrate the cell membrane and is hydrolyzed by endogenous esterases within living cells to form Calcein, which is retained inside the cells and emits strong green fluorescence. PI, on the other hand, cannot penetrate the intact membranes of live cells and only stains dead cells with compromised membrane integrity. Cells were incubated with PANS for 24 h, followed by staining with 4 µM Calcein AM/PI for 30 min at room temperature. The stained cells were imaged using a confocal laser scanning microscope (TI2-E + A1 R, Nikon, Japan), and fluorescence intensity was analyzed offline using ImageJ software (National Institutes of Health, USA). Cell viability was calculated using the following formula: Viability (%) = (Total no. of cells – No. of dead cells) / Total no. of cells ×100%.
In vitro neuron culture
Hippocampal neuron cultures were collected from neonatal Sprague–Dawley (SD) rat pups (n = 4). Briefly, hippocampal neurons were extracted from the brains of decapitated rats and immediately placed in DMEM/F12 media without serum, with all procedures performed on ice. The neurons were then transferred to tubes containing 3.5 mL trypsin solution, sealed with parafilm, and placed on a 37 °C shaker at a speed of 120–144 rpm for 20 min. Following this, the tubes were centrifuged at 1500 rpm for 2 min to remove the supernatant, and EBSS containing 10% FBS was added. After mechanical dissociation and shaking with a pipette, the tubes were centrifuged again at 1500 rpm for 2 min. The supernatant was replaced with 96% Neurobasal medium containing 2% B-27, 1% glutamine, and 1% penicillin/streptomycin. During the centrifugation process, glass-bottom dishes were prepared by coating the glass center with 0.01% poly-L-lysine. The coated dishes were washed three times with sterile water and left to dry. Finally, the dissociated neurons were evenly seeded onto the poly-L-lysine-coated glass dishes and placed in a 37 °C incubator with 5% CO2 for 30 min to allow cell adhesion. Typically, a single neonatal SD rat brain can yield hippocampal cells for approximately three culture dishes. Each dish was then supplemented with 2 mL of 96% Neurobasal medium containing 2% B-27, 1% glutamine, and 1% penicillin/streptomycin. The cultures were incubated for subsequent experiments.
In vitro NIR stimulation and calcium imaging
Calcium imaging experiments were conducted to evaluate changes in intracellular calcium ion concentration. Fluo-4 AM is a fluorescent dye that can be cleaved by intracellular esterases to form Fluo-4. Hippocampal neurons were incubated with pre-PANS or PANS for 30 min before being stained with 2 µM of Fluo-4 AM for another 30 min. After gentle washing with culture media, the stained cells were imaged using a confocal laser scanning microscope (TI2-E + A1 R, Nikon, Japan). The ambient light is mitigated by conducting calcium imaging experiments in a darkroom environment. Subsequently, a laser pulse was delivered to the cells using a Diode Laser System (BWT Beijing LTD., China) in modulation mode, with the laser controlled via custom-written codes. The laser power, i.e., 500 mW, was measured by a thermopile laser power meter consisting of an LP100 header and a TS/HS series probe (Changchun New Industries Optoelectronics Technology Co., Ltd., China). Fluorescence intensity changes over time were analyzed offline using ImageJ software (National Institutes of Health, USA). The data were presented as (F – F0)/F0 vs. time, where F0 represents the resting fluorescence and F represents the time-dependent fluorescence intensity.
Animals
All animal procedures were approved by the Animal Ethics Committee of Tongji University. Male C57BL/6 mice (4 weeks old, 20–25 g, n = 20) and neonatal SD rat pups (n = 4) were purchased from Jihui Laboratory Animal Care Co., Ltd. Before experimentation, the mice were acclimated for 7 days to mitigate transport-related effects and allow adaptation to the new environment.
In vitro electrophysiological testing
To evaluate the ability of PANS to activate cortical neural electrical activity, mice were anesthetized with isoflurane, and their brains were extracted. Hippocampal slices (300 μm) were prepared using a vibratome (Leica Microsystems). The brain slices were then placed in a holding chamber and allowed to recover for at least 1 h in a 32 °C incubator before being transferred to the recording chamber. In the recording chamber, slices were continuously perfused with artificial cerebrospinal fluid (aCSF) solution. The composition of aCSF solution is as follows: 126 mM NaCl, 26 mM NaHCO3, 2.4 mM CaCl2, 1.6 mM KCl, 1.4 mM MgCl2, and 1.1 mM NaH2PO4. The composition of intracellular solution is as follows: 130 mM K-Gluconic acid, 5 mM KCl, 4 mM MgCl2−6H2O, 0.2 mM EGTA, 10 mM HEPES, 10 mM Na2-phosphocreatine, 3 mM Mg-ATP, 3 mM Na-GTP, pH 7.2. Whole-cell patch-clamp recordings were performed using a MultiClamp 200B amplifier. The electrodes were connected to a multichannel recording system (Digital Lynx SX, Neuralynx, USA), and the electrophysiological data were analyzed using MATLAB.
In vivo stereotaxic injection of PANS
All surgical metal tools were autoclaved in preparation for the experiment, and plastic tools were sterilized with 75% alcohol. Mice were anesthetized with isoflurane through an anesthesia machine (RWD) (3% isoflurane, 1 L/min, 3–5 min), and then fixed on a stereotaxic frame using two ear rods and a nose clamp (1% isoflurane, 1 L/min). Veterinary ointment (Vitamin E ointment) was applied to the eyes of mice to avoid surgical injury. Animal hair removal cream was applied to the head of mice to remove hair. The scalp was sterilized with iodophor. A 1 mm longitudinal incision was made with a scalpel along the midline of the scalp, followed by an extension of the incision with surgical scissors. The scalp was clamped to allow adequate exposure of the skull. Subsequently, the Bregma point and the Lambda point of the mice skull were found, and the two points were adjusted to the same height. A 0.5 mm diameter hole was drilled using a dental drill based on the location of the target brain region (hippocampus: AP −1.5 mm, ML + 1.5 mm, DV −1.5 mm), and the dura mater was gently removed with a curved needle. 2 µL of PANS (0.05 mg/mL in aCSF) was injected into the hippocampus using a nanoliter injection pump (R480, RWD) and a glass microelectrode. The injection rate was consistently set at 0.5 µL/min, and the needle was left inside the brain for 15 min before the withdrawal. Finally, the incised scalp of mice was placed back and stitched up using biodegradable polyglycolic acid surgical sutures (Shenzhen RWD Life Science Co., Ltd., China), and the body temperature of the mice was maintained at 37–38 °C using a heated blanket throughout the procedure.
NIR optical stimulation and electrophysiological recordings in vivo
A slight difference from the microinjection of PANS, the electrophysiological recording involves the implantation of a probe with 16 recording sites into the anesthetized mouse brain. The stereotactic coordinates of hippocampus are as follows: AP −1.5 mm, ML + 1.5 mm, DV −1.5 mm. The probe was inserted into the hippocampus through a 1 mm diameter hole, while skull screws were implanted near the Lambda point to serve as grounding and reference electrodes. The recording electrodes were connected to a multichannel recording system (Digital Lynx SX, Neuralynx, USA), and the ground wire was gently attached to the grounding screw. A laser device was then set up, and laser pulses (50 ms pulse at 980 nm, 10 Hz for 10 s) were delivered to the neurons in the hippocampus. The recorded electrophysiological signals were analyzed using MATLAB.
Transcranial optical stimulation for behavioral modulation
The PANS-mediated NIR optical neuromodulation was first performed in the rhythmic whisker motor region (AP: +1.8 mm, ML: +1.5 mm, DV: −1.0 mm) in the primary motor cortex of anesthetized mice. The whisker movement was analyzed using ResNet50 backbone [30]. For open field test, after the injection of PANS in M2 (AP +1.0 mm, ML +0.5 mm, DV −0.5 mm), a fiber head (length = 2 mm, core diameter = 200 μm, numerical aperture = 0.22) was immobilized on the mouse scalp using dental cement and a reserved cranial nail, and a fiber patch cord was subsequently connected. In the control experiments for the mice with aCSF injection, the fiber heads were immobilized at the same place as the mice with PANS injection. For each measurement, one mouse was placed in a 40 cm × 40 cm acrylic box and allowed to explore the space for 30 min. Such a large arena can provide objective and accurate analyses for animal behavioral study compared to small arenas. A video camera recorded the mice motions before, during and after the NIR optical stimulation. Each record lasted for 10 min, during which the laser pulses (10 ms) at 980 nm were delivered at 10 Hz for 30 s for 10 times. The videos were analyzed in MATLAB with custom-written codes, by which the trajectory heat maps, moving distance, and velocity of mice can be obtained.
Statistical analysis
Regular statistical analyses were performed using Origin. In vivo electrophysiological signals were statistically analyzed with MATLAB. The sample sizes are included in the methods or in figure legends. Data were presented as mean ± standard deviation (SD). One-way analysis of variance (ANOVA) was used for statistical comparisons, and the corresponding P-values are indicated in the figures and legends as follows: *P < 0.05, **P < 0.01, ***P < 0.001, and ****P < 0.0001. P-values < 0.05 were considered statistically significant.
For comparisons involving more than two independent groups, the Kruskal-Wallis H test was first conducted, followed by Dunn’s test for post-hoc pairwise comparisons with Bonferroni correction to control the family-wise error rate. The Kruskal-Wallis H test was used according to Eq. (3):
$$\; H=\frac{12}{n(n+1)}\sum\limits_{i=0}^{k}\frac{R_{i}^{2}}{n_i} – 3(n + 1)$$
(3)
where k shows number of samples, Ri is the sum of the ranks assigned to the scores in the i-th trial. The measurement results for all cases are numbered from the lowest value to the highest.
Subsequently, Dunn’s test was used for pairwise comparisons to determine which groups had statistically significant differences. The standard error (SE) calculation formula for Dunn’s test is as follows:
$$\text{SE}= \:\sqrt{\frac{n\:(n+1)}{12}}\cdot\:\sqrt{\frac{1}{{n}_{i}}+\frac{1}{{n}_{j}}}\:$$
(4)
Next, calculate the statistic z according to Eq. (5):
$$\text{Z}= \:\frac{{\bar{\text{R}}_{{\rm i}}}-{\bar{\text{R}}_{{\rm j}}}}{\text{SE}}$$
(5)
Based on the z-value, the two-sided p-values were obtained by consulting the standard normal distribution table, and Bonferroni correction was performed according to Eq. (6) and Eq. (7):
$$\text{p}_{{\rm adj}} = \text{p} \times \text{m}$$
(6)
$$\:\text{m}=\frac{\text{k}\:(\text{k}-1)}{2}$$
(7)
where m is the number of pairwise comparisons, and k is the number of groups.
Given the small sample sizes (n) across experimental groups, non-parametric tests were applied throughout the study to avoid assumptions of normality. For comparisons between two independent groups, the two-tailed Mann-Whitney U test was employed:
$$\:\text{U}_1={\text{n}}_{1}\times\:{\text{n}}_{2}+\frac{\text{n}_{1}(\text{n}_{1}+1)}{2}-\text{R}_{1}$$
(8)
$$\:\text{U}_2=\text{n}_{1}\times\:\text{n}_{2}+\frac{\text{n}_{2}(\text{n}_{2}+1)}{2}-\text{R}_{2}$$
(9)
$$\text{U} = \text{min}(\text{U}_1, \text{U}_2)$$
(10)
where n1 and n2 are the capacities of two samples.