
Study design and setting
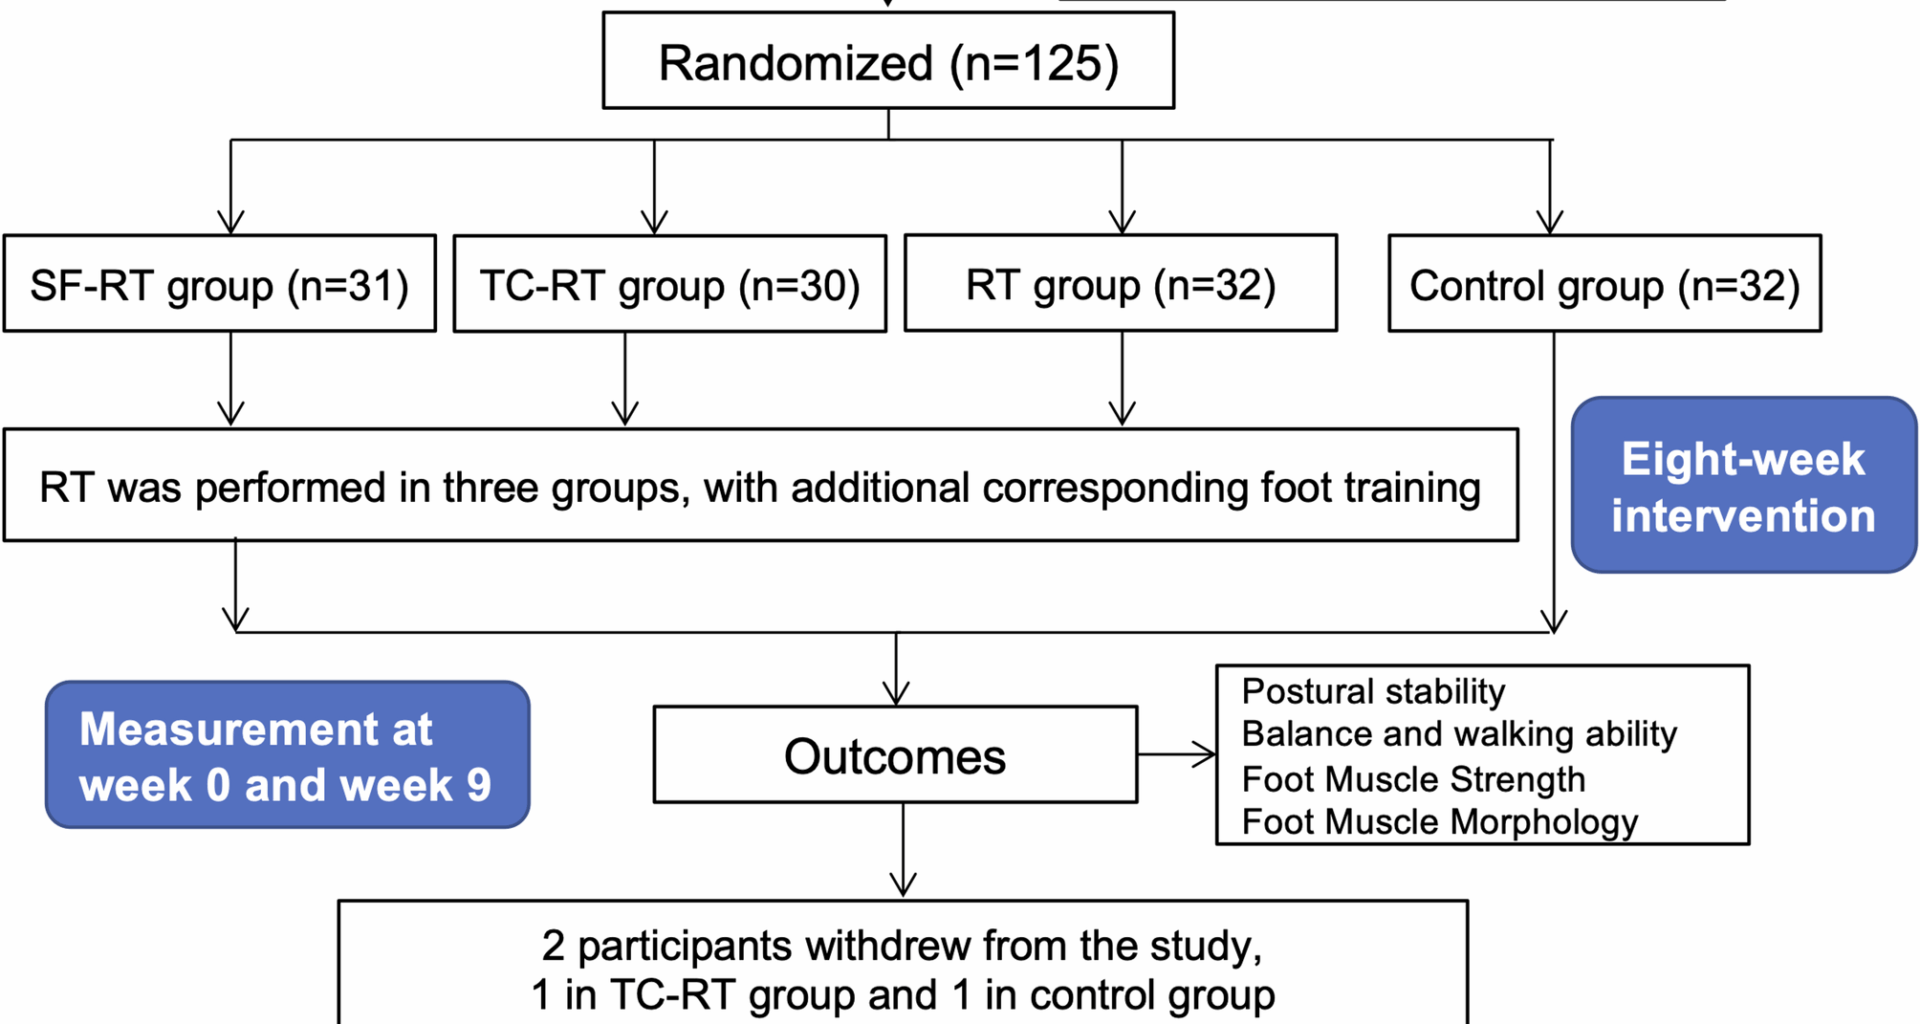
This study was a single-blind randomized controlled trial and its intervention was conducted at several community centres in Shanghai, China and its evaluations were conducted at the Sport Medicine and Rehabilitation Centre, Shanghai University of Sport. Moreover, it was approved by the Ethics Committee of the Shanghai University of Sport (Ref. No.: 102772020RT001) and registered at Chinese Clinical Trial Registry a priori as a clinical trial (ID: ChiCTR2000033623). This study met the ethical aspects based on Resolution 466/12 of the National Health Council and the Declaration of Helsinki. In this study, the researcher and evaluators were blinded to the group allocation. All these measurements were conducted by trained research assistants who blinded to group assignment and conducted in randomized order. Furthermore, the researchers responsible for data collection and data analysis were blinded for the random allocation. The flow diagram of this study was shown in Fig. 1. Three different intervention programs were employed for postural stability promotion in the elderly, while the participants were randomly divided into four groups, including a control group without intervention. The study was grouped separately according to community to avoid the influence of confounding factors on the findings, such as the distribution of age and gender, and education level among these communities. And the evaluations of postural stability, IFMs function, and its morphology were managed at pre-intervention and post-intervention.
Fig. 1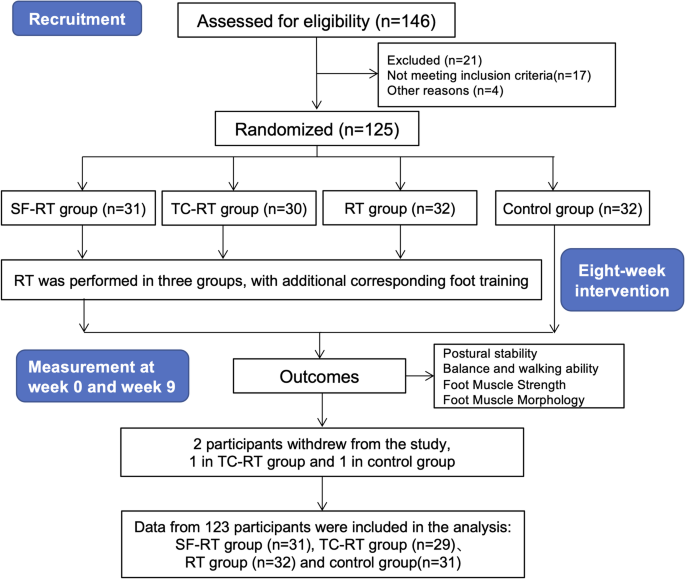
The flow diagram of this study. Abbreviation: SF-RT group, the short-foot training combined the lower extremity resistance training group; TC-RT group, the towel-curl training combined the lower extremity resistance training group; RT group, the lower extremity resistance training group
Participants
The G*POWER software 3.1 software was used for the suitable sample size for the multivariate of analysis for repeated measurements (MANOVA) test. With the settings of α = 0.05, power (1 − β) = 0.80 and effect size = 0.25, power analysis showed that 23 participants for each group were the required sample size. Considering the drop-out rate (30%), 30 participants in each group at least were recruited in this study.
The voluntary participation was requested via posters, and expert lectures on community centres in Shanghai, China. The study team (clinicians, physical therapists and exercise specialists) screened all participants based on the following inclusion and exclusion criteria. Prior to the formal testing, the interviewer gave a detailed introduction of the trial process and intervention settings to all the eligible participants, explaining the purpose of the study and its significance in real-life situations, and informing them of the contribution of participation in the study to future health promotion among older adults, the possible benefits to them as individuals, as well as the possible dangers and adverse effects. The interviewer distributed an informed consent form to each participant to obtain his/her agreement and signature.
Recruited participants were grouped by computer-generated random numbers after completing the initial screening, and the grouping information was transferred into opaque envelopes for storage and blinded to all examiners. A total of 125 eligible elderly participants were recruited into this study and randomly divided into 4 groups, respectively, the lower extremity resistance training group (RT group), short-foot training combined the lower extremity resistance training group (SF-RT group), towel-curl training combined the lower extremity resistance training group (TC-RT group), and a control group through the automatic random number generation method.
Inclusion criteria
1.
Able to maintain the standing position;
2.
Able to walk alone, without others, prosthesis or mobility aids;
3.
Normal cognitive function, able to understand the intervention and evaluation process;
4.
Adults older than 60 years old;
5.
Availability: three times a week over 8 weeks.
Exclusion criteria
1.
Abnormal foot posture which has been shown to be associated posture instability [19] (It was determined by FPI-6 scale, and the cutoff scores were defined at + 1 to + 8 [20]);
2.
Abnormal foot structure (toe deformity, hallux valgus, etc.);
3.
Participants diagnosed with diseases related to postural control, such as vestibular dysfunction, Alzheimer’s disease, Parkinson’s disease and motor neuron disorders;
4.
History of lower limb trauma in the past year;
5.
Participants with medical contraindications for exercise, including severe cardiovascular diseases, respiratory diseases, musculoskeletal disorders, and any situation where exercise causes pain or discomfort;
6.
Currently undertaking a structured exercise programme for postural control, such as the balance function rehabilitation training used in clinical settings.
Interventions
In the present study, participants in each intervention groups performed three different intervention programs, whereas participants in the control group did not undergo any intervention, and were asked to maintain their previous lifestyles. The short-foot and towel-curl training, as foot muscle training, are common interventions to promote foot function. The difference is that the short-foot training focuses more on the intrinsic foot muscles [21] and improves their ability to support the arch by enhancing the neuromuscular control, whereas the towel-curl training stimulates the intrinsic foot muscles to a certain extent but focuses more on the flexion of metatarsophalangeal joints and relies on the extrinsic foot muscles to complete the training maneuvers.
The intervention groups were required to complete eight consecutive weeks of training, three times per week, with a minimum of one day between each session. A metronome was used to standardize the duration and number of intervention sessions, and several qualified physical therapists provided supervision and timely guidance to actively encourage the participants to complete the intervention sessions. The foot muscles trainings, the short-foot training and towel-curl training, were performed after the resistance training. 5-min warm-up and 5-min cool-down exercise were conducted before and after each intervention session, which consisted of joint mobility training and muscle stretching. The resting time about one minute was provided between two set of exercises.
In addition, any reason for absence from training or withdrawal from the study, including personal reasons or adverse reactions, was recorded with the date and reason. There were 24 sessions of intervention and if a participant was absent more than 20% [5] of the total number of times, that participant’s data would not be used in subsequent data analyses. Similarly, if control group additionally participated in other intervention components, their data would be excluded.
The following is a detailed description of the arrangements during the intervention period for the three intervention groups as well as the control group:
(1)
The lower extremity resistance training group (RT group)
The RT program included resistance training for hip joints (flexion, extension, adduction, abduction), knee joints (flexion, extension), and ankles (plantar flexion, dorsiflexion) bilaterally (Table 1). Two different strengths of elastic bands (20 lbs, and 30 lbs) were used for resistance training, with three sets of 8–12 repetitions of blocks, with the elastic band intervention protocol referenced to Kwak et al. [22].
Table 1 The lower extremity resistance exercise program
(2)
The short-foot training combined the lower extremity resistance training group (SF-RT group)
Same as the RT group, participants in SF-RT group were also required to complete elastic band lower extremity strength training that lasted for 8 weeks, three times per week under the supervision of trainer. Differently, SF-RT group were additionally required to perform short foot training. Under the direction of trainers, participants raised their foot arch for 5 s and pulled the metatarsal heads toward the heel bone without flexing the metatarsophalangeal joints. The trainers placed hand over participants’ arch to determine if the arching foot maneuver is completed correctly. As with the lower extremity strength training, participants performed short-foot training with 3 sets of 12 repetitions. The short-foot training was performed progressively in the seated, bipedal standing, and unilateral standing position (at the unilateral standing position section, the SF training was conducted on the dominant side and non-dominant side) [23, 24], with the participants moving on to the next position when he or she could perform the training maneuver skillfully and easily in the previous position.
(3)
The towel-curl training combined the lower extremity resistance training group (TC-RT group)
The participants in TC-RT group performed additional towel roll training, in addition to RT. The trainer placed a towel under the feet of participants, who trained by flexing their toes to the best of their ability and curling the towel up, and continued for 5 s. Similarly with SF training, participants performed towel-curl training with 3 sets of 12 repetitions. And the intensity was progressively increased by foot loading (seated, bipedal standing, and unilateral standing position). Similarly, at the unilateral standing position section, the TC training was conducted on the dominant side and non-dominant side.
(4)
The control group
The control group did not undergo any intervention training involved in this study. Additionally, this group was required to maintain their usual daily activities and not to participant any additional training or treatments related to postural control promotion during study period. And the participants of control group received treatment, including the resistance training and foot muscle training after the end of study.
Measurement
This randomized controlled study included measurement in the pre-test (pre-intervention, week 0) and post-test (post-intervention, week 9). To avoid bias, all these measurements were conducted by trained research assistants who blinded to group assignment and conducted in randomized order. Moreover, to minimize the potential confounding effects of fatigue associated with resistance training, the post-intervention assessment was scheduled two days after the completion of the intervention period and conducted within a seven-day timeframe.
Primary outcome measurementsPostural stability
The NeuroCom Balance Manager System (Version 9.3, Copyright ©1989–2016 Natus Medical Incorporated) were used to determine static and dynamic postural stability of older participants. The balance platform is equipped with 23 cm×46 cm dual-force plate to trace the trajectory of center of pressure (COP) of each participant, and its sampling frequency is at 100 Hz. We employed the commonly used sensory organization test (SOT), limits of stability test (LOS), and motor control test (MCT), the test details of which have been reported in previous studies [12, 25]. In SOT, LOS and MCT test, the tasks were performed in a randomized order. All participants were informed and demonstrated of all procedures in advance and performed barefoot at the NeuroCom Balance Manager System.
(1)
Sensory organization test (SOT).
In this test, participants were required to maintain postural stability in six different conditions, each of which needed to be performed three times each and each Task needed to be maintained for 20 s. The change of viewing, visualization, and support surface are combined with each other to make up the six conditions of SOT test, which in turn interferes with the participant’s postural control. In the SOT test, the system evaluated the participants’ postural perturbations, thus produced equalization scores, strategy scores for each of the six test conditions, and a composite postural stability score which using a weighted average of these scores and be used for analysis. A high equilibrium score means a low postural sway, indicating greater postural stability [26].
(2)
Limits of stability test (LOS)
This test is an active motor function test in the NeuroCom Balance Manager System. In LOS, the participants were barefoot and stood in a bipedal standing position on dual-force plate. The research assistants instructed the participants with the test procedure and assisted in adjusting their initial stance and foot position. The test required the participants to actively move the center of gravity (COG) toward the limit of stability in eight directions (positive forward, right forward, positive right, right backward, positive backward, left backward, positive left, left forward), without lifting the feet off balance and without significant movement of the hip joints. To avoid ambiguity, we uniformly defined the dominant side as the right side and the non-dominant side as the left side. Based on the participant’s shift in 8 directions, the system calculated following parameters based on the changes in COP of each trial: Reaction Time (RT), Movement Velocity (MVL), Endpoint Excursions (EPE), Max Excursions (MXE), and Directional Control (DCL). The system calculated the values of the above parameters in eight directions and made a weighted average of the scores according to each direction, and finally took the scores of the above five parameters in the four directions of forward, backward, dominant direction, and nondominant direction as well as the composite score.
(3)
Motor Control Test (MCT)
This test aims to assess the dynamic postural stability of participants in the anterior-posterior direction. During the procedure, participants stood barefoot in a bipedal stance on a support surface that underwent sudden horizontal displacements in the anterior-posterior direction. Participants were required to maintain postural stability, without informing of either the direction or timing of the displacement. The displacement speed is categorized into three distinct levels: low (base threshold: 2.8°/s), medium (moderate level: 6.0°/s), and high (saturation speed: 8.0°/s). For each combination of direction and speed, participants were required to complete three trials in random order. Comprehensive safety measures have been implemented to ensure the protection of participants from potential adverse events. The primary parameters were calculated in this study: (1) the Latency (ms): the response time from the movement of support surface to movement of COP, (2) the Amplitude Scaling: the capacity to apply appropriate force and effectively counteract the perturbation of the support surface to restore postural stability.
Secondary outcome measurementsBalance and walking ability
We performed the Berg Balance Scale (BBS) and the Timed Up and Go Test (TUGT) to assess balance and walking function in the elderly, both of which are commonly used in clinical evaluations as well as research in this population [27, 28]. In this study, the same skilled research assistant conducted the pre- and post-intervention assessments of BBS and TUGT.
Foot muscle strength
An ergoFet ergometer (Hoggan Health, USA, sampling frequency of 100 Hz) was used to determine the foot muscle strength of dominant side. Foot Muscle Strength consisted of EFMs and IFMs strength. In particular, the IFMs strength test (arching foot), accomplished by activating IFMs, was performed on customized frame with the dynamometer. The EFMs strength consisted of the 1st toe flexion strength (T1), the 2nd–3rd toe flexion strength (T23) and the 2nd–5th toe flexion strength (T2345). The participants were encouraged to pull “T”-shaped metal bar or screw buckle as best he or she could by corresponding toes. The “T”-shaped metal bar or screw buckle were secured to the dynamometer in a custom wood frame. The described strength test required the participants to complete three valid tests, and the data were initially processed and then averaged for statistical analysis and normalized to the participants’ body weights. These strength tests and its reliability have been reported in our previous studies [12, 29].
Foot muscle morphology
In this study, foot muscles morphology was determined by a portable color Doppler ultrasound system (Diagnostic Ultrasound System, M7 Super, Mindary, China) with a 10 MHz linear broadband array transducer (model: L14-6s), including abductor hallucis (AbH), flexor digitorum brevis (FDB), quadratus plantae (QP), and flexor hallucis brevis (FHB) of the dominant foot [29, 30]. Based on previous studies [4, 31] and findings of our own work [12], it has been established that IFMs, including the AbH, FDB and QP, exhibit a significant correlation with various parameters indicative of human postural stability. Given the sensitivity of ultrasound imaging in evaluating superficial musculoskeletal structures, the morphology of AbH, FDB and QP were assessment for IFMs. All thickness and cross-sectional area (CSA) of these IFMs were standardized with participants’ height. Due to the specificity of the ultrasound test, human soft tissue morphology would change depending on the amount of pressure applied, and tester should apply as little pressure as possible to the skin tissue during ultrasound test. In addition, all pre- and post-intervention muscle morphology tests were performed by the same skilled research assistant to ensure the reliability of the test.
Statistical methods
The SPSS statistical software (version 20.0 for Windows; SPSS, Inc., Chicago, IL, USA) was used for statistical analyses. The Kolmogorov–Smirnov test was used to determine the normality of distribution. The normally distributed continuous variables were calculated as the mean and SDs, and the non-normally distributed continuous variables were described as the median and interquartile range. The one-way analysis of variance (ANOVA) and the chi-square test were used to determine whether there were differences between general characteristics (age, height, weight, etc.) and demographic parameters (male-to-female ratio and dominant side) among these four groups.
The multivariate of analysis for repeated measurements (MANOVA) test (time*group) was used to determine whether there were differences in primary outcomes and secondary outcomes among groups. Moreover, the Tukey correction was used for multiple comparisons, and the partial η2 was used to calculate for effect sizes. Statistical significance was set at 0.05 for analyses. Additionally, for post hoc test, the paired samples t-tests for within-group analysis.