
Study population
Our sample was drawn from five nationally representative databases of middle-aged and older adults, including China Health and Retirement Longitudinal Study (CHARLS), Mexican Health and Ageing Study (MHAS), Health and Retirement Study (HRS), English Longitudinal Study of Ageing (ELSA), and Survey of Health, Ageing and Retirement in Europe (SHARE). All of these cohorts provided data on participants’ internet use, social participation, and cognitive function. We analyzed data from a similar time span, that is from 2010 to 2020. Considering whether or not the waves in the database contained questions related to internet use, the final data we included were: 2011–2018 for CHARLS (wave1–wave4), 2013–2018 for MHAS (wave3–wave5), 2010–2020 for HRS (wave10–wave15), the 2012–2019 for ELSA (wave6–wave9), and 2013–2020 for SHARE (wave5–wave8).
We included participants aged 50 years and older and excluded participants with missing information on internet use, social participation, cognitive function, and covariates. Two analytic samples were finalized to address the 3 purposes of this study: 1) whether or not one uses the internet, 2) transition patterns of internet use, and 3) the interaction of social participation and internet use on cognitive function. Sample 1 contained 15,961 participants (30,257 observations) from CHARLS; 17,925 participants (36,339 observations) from MHAS; 13,350 participants (21,858 observations) from HRS; 7976 participants (16,130 observations) from ELSA; and 53,040 participants (113,266 observations) from SHARE were used to test aims 1 and 3. Sample 2 consisted of 12,712 participants (20,446 observations) from CHARLS; 12,470 participants (20,387 observations) from MHAS; 9613 participants (15,132 observations) from HRS; 6600 participants (13,848 observations) from ELSA; and 28,878 participants (38,487 observations) from SHARE were used to test aim 2. In the HRS, as orientation was only measured for non-internet users in face-to-face and phone interviews, we did extra analyzes on samples of different sample sizes in the supplementary materials to best utilize participants’ information. At this time, the global cognitive function was evaluated according to an adapted version of the Telephone Interview, that is, by taking the average value of memory and executive function29. The validity and consistency of this cognitive testing method have been fully demonstrated30. The detailed population selection process is described in Supplementary Fig. 1.
We conducted secondary analyes of data from the five publicly available datasets, with full ethical approval for these studies dating back to their respective original surveys. These datasets included CHARLS (approved by the Ethical Review Committee of Perking University, IRB00001052-11015), MHAS (approved by National Institutes of Health/National Institute on Ageing, NIH R01AG018016), HRS (approved by National Institute on Aging and the Social Security Administration, NIA U01AG009740), ELSA (sanctioned by the National Research and Ethics Service Committee, South Central-Berkshire), and SHARE (approved by the Ethics Council of the Max Planck Society). The detailed ethical approval could be found on respective origin surveys. Meanwhile, written informed consent was also obtained from all participants.
Internet use and its transition
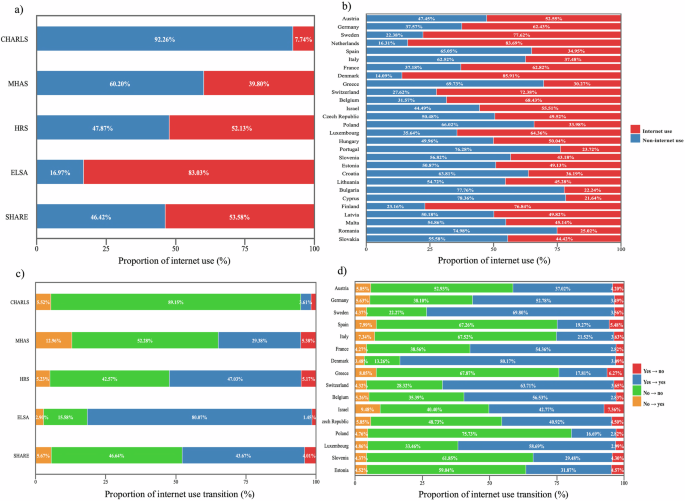
Data on internet use was collected through the following questions: “Have you used the Internet in the last month?” in CHARLS; “In the house do you have Internet?” in MHAS; “Whether the respondent uses the World Wide Web, or Internet, for sending and receiving email or for any other purpose……?” in HRS; “On average, how often do you use the Internet or email?” in ELSA; and “During the past 7 days, have you used the Internet, for e-mailing, searching for information, making purchases, or for any other purpose at least once?” in SHARE. Internet use was categorized as “yes” or “no” based on the questions above. Participants selected “yes” (in CHARLS, MHAS, HRS, and SHARE) or made the following choices: “less than every 3 months”, “at least once every 3 months”, “at least once a month (but not every week)”, “at least once a week (but not every day)”, “every day”, or “almost every day” (in ELSA) was defined as internet use25. The transition in internet use was determined by the internet use status between two consecutive waves in each database. Accordingly, it was classified into four categories: (1) “Yes → No,” (2) “Yes → Yes,” (3) “No → No,” and (4) “No → Yes.”
Social participation
Social participation was evaluated by inquiring of the participants regarding their engagement in social activities within the distinct cohorts. The classification of social participation was binary, designated as either “yes” or “no.” Specifically, a participant was regarded as having social participation if they had engaged in any of these activities within their cohort.
Cognitive function
Cognitive function covers a number of domains, and based on previous research, we assessed three main domains: memory, orientation, and executive function31. Memory tests included immediate and delayed recall. Orientation was assessed through four questions on the year, month, date of the month and day of the week or three questions on the year, month, and date of the month. The scores for memory and orientation in CHARLS, HRS, ELSA, and SHARE were 20 and 4, respectively, while for MHAS, they were 16 and 3. Executive function was tested by “the Serial Sevens test” and “copy the overlapping pentagons” in CHARLS (0–6 points); “constructional praxis”, “constructional praxis recall”, “visual scanning”, and “verbal fluency” in MHAS (0–132 points); “the counting-backward test” and “the Serial Sevens test” in HRS (0–7 points); and “verbal fluency” (0–100 points) in ELSA and SHARE. These tests have been widely validated in previous studies and have shown good validity and reliability32,33. Due to the fact that the measurements of the three domains of cognitive function varied among different cohorts, we standardized the raw scores to ensure the comparability between the results. Global cognitive function was calculated as the average of the standardized scores from the three domains, reflecting the overall relative performance of each cohort across these domains. Therefore, the global cognitive scores between cohorts remained comparable, with higher scores indicating better cognitive function. This method of calculating global cognitive function scores has been used in other studies34,35. Internet use and its transitions, social participation, and cognitive function were all assessed as time-varying variables to reflect potential changes in these variables at different time points. For more information on these variables’ measurements, please refer to the Supplementary Table 1.
Covariates
The potential confounding factors were selected based on the literature review. These factors included demographic characteristics (age, gender, marital status, educational level, residence status, employment status, and consumption/income), health-related behaviors (current smokers and current drinkers), and health status (self-rated health and chronic disease). Except for gender and educational level, all other covariates were also treated as time-varying covariates. See Supplementary Table 2 for more information.
Statistical analysis
Descriptive analysis was employed to describe the sample’s characteristics. For continuous variables, the mean and standard deviation (SD) were calculated, whereas frequencies and percentages were utilized for categorical variables. We used linear mixed models to analyze repeated measures data. The linear mixed model included internet use (transition) group, time (duration since baseline), and other covariates mentioned above. It combines fixed and random effects and is able to better analyze time trends and inter-individual differences, thus effectively handling repeated measures data. At the same time, it also works well for analyzing unbalanced and subsequent data with missing data. The lme4 package in R was utilized to estimate the relationship between internet use, its transition, and cognitive function, using years since baseline as the time scale and incorporating random intercepts. Data from four waves of CHARLS to six waves of HRS were used for analysis, with multiple repeated measurements taken for the individual’s internet use, its transitions, social participation, cognitive function, and other variables. We used five models in the analysis. Model 1 was a crude model without any adjustment. In model 2, we accounted for demographic characteristics. We additionally adjusted for health-related behaviors in model 3, and health-related behaviors and health status in model 4. Model 5 was fully adjusted to include social participation.
Because the effects of internet use and its transition on cognitive function may vary by demographic characteristics, health-related behaviors and health status, we conducted a set of subgroup analyses. We conducted stratified analyses based on age, gender, marital status, educational level, residence status, employment status, consumption/income, current smokers, current drinkers, chronic disease and social participation to explore potential effect modifications. In addition, we explored the multiplicative interaction effects of internet use and social participation on cognitive function. The multiplicative interaction effect refers to the product of the individual risks associated with each factor36, and the interaction term coefficient along with its 95% confidence interval (CI) were used to estimate this effect. And then, participants were divided into four groups based on the combination of internet use (use and non-use) and social participation (participation and non-participation) to examine the joint impact of internet use and social participation on cognitive function.
To test the robustness of the results, we conducted two sensitivity analyses. First, we included only individuals who participated in the first wave of the survey within the timeframe described above, controlling for baseline cognitive function scores. Based on the above, we excluded participants who did not have repeated measures of internet use, social participation, and cognitive functioning for a second sensitivity analysis.
Finally, random-effects meta-analysis was used to pool the effect values and corresponding 95% CIs from the different cohorts to derive an overall effect estimate. All data analysis were conducted using R software Version 4.4.2 or Origin2024, and a two-tailed p-value < 0.05 was set for statistical significance.