
Alpaca immunization and VHH immune phage library biopanning
Six alpacas were immunized subcutaneously with the ECD of hIL-10Rα, hIL-10Rβ or a hIL-10Rα–hIL-10Rβ heterodimer–hIgG1 Fc fusion (1 mg, five times at 2 week intervals; Lampire Biological Laboratories). All procedures were performed by Lampire under IACUC-approved protocols and applicable animal welfare regulations. No statistical methods were used to predetermine the sample size because the study was intended to isolate the antibody rather than compare groups. Animals were not randomized, and investigators were not blinded. Serum titre values were evaluated by IL-10Rα and IL-10Rβ enzyme-linked immunosorbent assay (ELISA) on days 35 and 49. Peripheral blood lymphocytes were isolated on days 49 and 63, RNA was extracted (Qiagen, 74104) and converted to cDNA, and VHH regions (~400 bp) were amplified by two-step PCR. The VHH product and pMES4 phagemid vector (Creative Biogene, OVT3038) were digested, ligated and transformed into Escherichia coli TG1 cells by electroporation; the library size was estimated by colony counting. The TG1 library was infected with M13K07 helper phage (Antibody Design lab, PH010L) to generate VHH-presenting phages, and rescue with polyethylene glycol precipitation was performed as described previously38. Phage libraries were panned against hIL-10Rα or hIL-10Rβ immobilized on MaxiSorp plates (Thermo Fisher Scientific, 439454); non-specific phage was washed away and bound phage was eluted at low pH, neutralized and used to infect TG1 cells for subsequent rounds. Enrichment was monitored by comparing eluted phage titre from antigen-coated versus uncoated wells, and stringency was increased each round by adding washes and alternating blocking reagents. Enriched phages were plated for single-colony phage ELISA.
Generation of humanized and knockout mouse lines
Double-humanized B-hIL10RA/hIL10RB mice (Biocytogen, 111871) were obtained by intercrossing B-hIL10RA and B-hIL10RB mice, both generated on a C57BL/6 background by homologous recombination. B-hIL10RA mice express a chimeric receptor in which mouse Il10ra exons 1–6 (signal peptide, ECD, transmembrane domain) were replaced with the human sequences while retaining the mouse cytoplasmic domain; B-hIL10RB mice similarly carry humanized Il10rb exons 2–6 (Supplementary Figs. 14 and 15). Tyk2-deficient mice were generated by Taconic Biosciences using CRISPR–Cas9 editing (deletion of exons 4–23) on the C57BL/6NTac background.
Protein expression and purification
Designed VHH molecules were codon-optimized, synthesized and cloned as bivalent VHH-hIgG1 with a short Gly-Ser linker. Plasmids were transiently transfected using the Expi293 or ExpiCHO systems (Thermo Fisher Scientific, A14635, A29133), and VHH-Fc constructs were purified by protein A affinity chromatography (5 ml HiTrap MabSelect-SuRe column, Cytiva, 11003495) followed by size-exclusion chromatography (SEC) (HiLoad 16/600 Superdex 200 pg column, Cytiva, 28989335); purity was assessed by analytical SEC, SDS–PAGE and mass spectrometry. The tandem VHH E07-A05, individual VHHs, anti-VHH tool Fab (Fab 1; PDB: 7PIJ) and framework-mutant variants were expressed and purified similarly. Null-binding variants were generated by introducing CDR mutations into VHH E07 or VHH A05 to abolish binding to IL-10Rα and IL-10Rβ, respectively. Human IL-10Rα and IL-10Rβ ECDs were expressed with C-terminal 8×His or hIgG1 Fc tags and purified by Ni-NTA or protein A chromatography followed by SEC. To improve cryo-EM map quality, IL-10Rα ECD was partially deglycosylated with PNGase F (37 °C, 1 h) and repurified by SEC. Complexes containing IL-10Rα ECD, IL-10Rβ ECD, tandem VHH E07-A05 and tool Fab were assembled, analysed by SEC-HPLC in 25 mM HEPES pH 7.5/150 mM NaCl. IL-10 muteins (10DE, D25K, E96K) were cloned into the PB510B mammalian expression vector (SBI System biosciences) containing an N-terminal HSA signal peptide and a C-terminal 6×His tag, and expressed in TurboCHO cells (GenScript) and purified by AmMag Ni magnetic beads (GenScript, L00776-4) followed by SEC (HiLoad 16/600 Superdex 75 pg column, Cytiva) in 25 mM HEPES pH 7.4/150 mM NaCl. Detailed protein and antibody sequence information is provided in the Supplementary Table 4.
Human PBMC stimulation
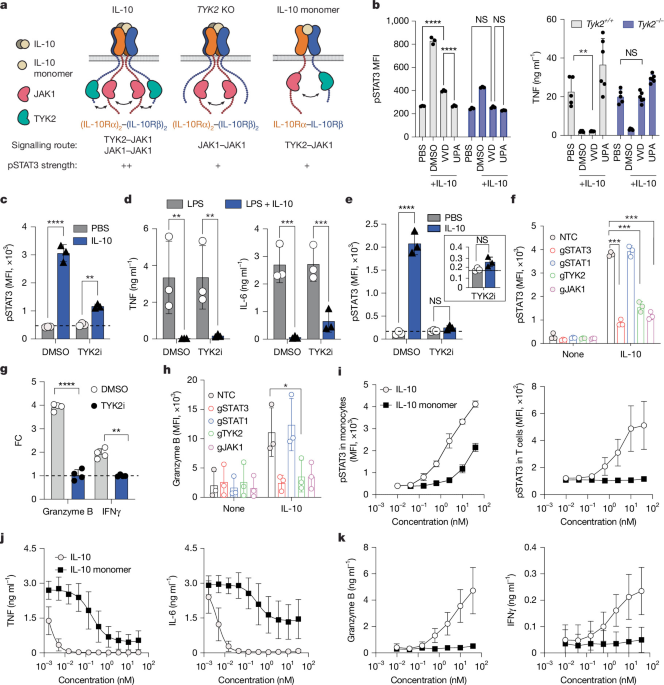
PBMCs from healthy donors were stimulated with 10 ng ml−1 LPS in the presence of PBS, recombinant human IL-10 (Peprotech, 200-10) or msIL-10R agonist (0.005–1,000 nM). For TYK2 inhibitor experiments, cells were pretreated with DMSO or zasocitinib (MedChemExpress, HY-150096, 1 μM) before stimulation. After 24 h, supernatant TNF, IL-6 and IL-1β were measured using the Meso Scale Discovery (MSD, K15049D) assay and analysed in GraphPad Prism.
MDM differentiation and CRISPR editing
Monocytes were isolated from PBMCs by negative selection (StemCell Technologies, 19359) and differentiated into MDMs in M-CSF–supplemented RPMI for at least 6 days. For TYK2 knockout, freshly isolated monocytes were nucleofected with Cas9–guide RNA ribonucleoprotein (RNP) complexes (Lonza 4D Nucleofector) and differentiated for 6 days before downstream phosphoflow or cytokine assays. RNPs were generated by combining 2 μl gRNA (100 μM) and 2 μl of Cas9 (20 μM) (EditCo) in supplemented P3 nucleofection buffer (Lonza, V4SP-3096). The solution was incubated at room temperature for 20 min. In total, 106 monocytes were resuspended in 20 μl of pre-formed RNPs in P3 buffer and nucleofected using Lonza 4D Nucleofector using pulse code CM-137.
T cell isolation and in vitro T cell assay
Human bulk or CD8+ T cells were isolated from PBMCs by negative selection (>99% purity, StemCell Technologies, 17951, 17953) and activated with plate-bound 10 μg ml−1 anti-CD3 and soluble 5 μg ml−1 anti-CD28 for 3 days. T cells were then cultured with or without IL-10, msIL-10R agonist, IL-10 monomer or IL-10 muteins for 3 additional days, restimulated with anti-CD3/anti-CD28 (5 μg ml−1 each) overnight and assessed for secreted IFNγ and granzyme B by ELISA and MSD (R&D, DIF50C, DGZB00; MSD, K251TTK) or by intracellular flow cytometry.
CRISPR–Cas9 gene editing in T cells and HEK293T cells
Activated human T or CD8+ T cells were nucleofected with Cas9–gRNA RNP complexes and poly-l-glutamic acid using a 4D Nucleofector (Lonza) and expanded for 3 days before use. RNP complexes were generated by incubating guide RNA (EditCo Bio) with recombinant Cas9 protein (IDT, 10007803) for 20 min at room temperature. Cells were electroporated using the EO115 pulse program. To generate TYK2-knockout HEK293T IL-10 pSTAT3 reporter cells, Cas9–RNP complexes targeting TYK2 were assembled using a predesigned human TYK2 gene knockout kit (EditCo) and delivered by electroporation using the Neon Transfection System (Thermo Fisher Scientific). After recovery, single-cell clones were isolated by flow cytometry single-cell sorting and expanded. TYK2 knockout was confirmed by DNA-seq.
Lentiviral transduction
Human CD8+ T cells were activated with anti-CD3/anti-CD28 Dynabeads overnight, debeaded and transduced with concentrated lentivirus encoding IL10RA-mCherry, IL10RB-GFP, JAK1-GFP or TYK2-mCherry (cloned into the GLV3 backbone under the EF1A promoter with C-terminal P2A-mCherry/EGFP reporters) by spin-infection on retronectin-coated plates (100 μg ml−1, Takara, T100B). Cells were rested 2–3 days before functional assays. The gating strategy for transduced T cells is shown in Supplementary Fig. 16.
pSTAT3 and pSTAT1 staining
After stimulation, PBMCs, MDMs or T cells were surface stained, fixed, permeabilized with ice-cold methanol and stained with anti-pSTAT3 (pY705) and anti-pSTAT1 (pY701). Cells were analysed by flow cytometry (LSR Fortessa) and quantified in FlowJo. The gating strategy is shown in Supplementary Fig. 17.
Copy numbers of IL-10Rα and IL-10Rβ
PBMCs, macrophages (detached from UpCell plates with cold PBS) and monocyte-derived DCs (CellXVivo, CDK004) were stained with lineage markers and titrated anti-IL-10Rα and anti-IL-10Rβ antibodies with matched isotype controls. The delta geometric mean fluorescence intensity (gMFI) was calculated as the sample gMFI minus the isotype gMFI. Absolute receptor copy numbers were determined using Quantum Simply Cellular anti-rat and anti-mouse IgG bead standards (Bangs Laboratories, 817B, 815B). Antibody details are provided in the Reporting Summary.
Immunoblot analyses
Macrophages or T cells were serum-starved, pretreated with DMSO, JAK1 inhibitor upadacitinib (10 µM) or TYK2 inhibitor zasocitinib (1 µM), and stimulated with or without IL-10 or msIL-10R agonist (10 nM). The lysates were resolved on NuPAGE 4–12% Bis-Tris gels, transferred to nitrocellulose and probed for phosphorylated and total TYK2, JAK1, STAT3, STAT1 and GAPDH. Chemiluminescence was detected on the ChemiDoc MP system and quantified in Image Lab, with brightness/contrast adjustments applied uniformly across all groups. pTYK2, pJAK1 and pSTAT3 were normalized to total TYK2 and expressed as the fold change relative to the unstimulated control. Antibody details are provided in the Reporting Summary.
IL-10Rα–IL-10Rβ pSTAT3 reporter assay
An HEK293T reporter line stably expressing human IL10RA, IL10RB and a STAT3-responsive firefly luciferase reporter was used to measure IL-10 receptor agonist activity. Reporter cells were incubated with eight-point dose–responses of test molecules or recombinant IL-10 (positive control) for 3 h, and luminescence was measured using an EnVision reader (Revvity) after Bio-Glo addition (Promega, G7941). The half-maximum effective concentration and Emax were calculated by four-parameter logistic regression on the IL-10-normalized signal.
Inhibition of LPS-mediated PBMC cytokine secretion
Thawed PBMCs were pre-incubated with eight-point dose–responses of IL-10 or antibodies for 30 min, stimulated with LPS (1 ng ml−1) for 20 h, and supernatant IL-6 and TNF were measured by time-resolved Förster resonance energy transfer (Revvity, TRF1223C) and MSD (K151UCK), respectively. Data were normalized to positive/negative controls and fitted by four-parameter logistic regression.
Evaluation of the IL-10R agonist activity on primary T cells
CD8+ T cells from three donors were expanded for 3 days with anti-CD3/anti-CD28, incubated with eight-point antibody dose–responses for 3 days, restimulated with anti-CD3/anti-CD28 for 6 h and the supernatant IFNγ was measured by MSD (K151TTK). Data were normalized and fitted by four-parameter logistic regression.
RAW264.7 knockout and IL10RA-mutant cell line generation
Endogenous Il10ra and Il10rb were disrupted in RAW264.7 cells by CRISPR–Cas9 nucleofection using a Lonza 4D Nucleofector with pulse code DS-136, and single-cell knockout clones were validated by genomic sequencing and flow cytometry. IL-10R-deficient cells were then reconstituted by lentiviral expression of chimeric receptors (human IL-10Rα/IL-10Rβ ECDs fused to the corresponding mouse intracellular domains, linked by P2A), including IBD-associated IL-10Rα extracellular mutants. To assess anti-inflammatory activity, cells were stimulated with LPS (10 ng ml−1) with or without IL-10, IL-10 muteins (10DE, D25K) or msIL-10R agonist (0.1–10 nM) for 6 h with monensin, and intracellular TNF was measured by flow cytometry. For immune complex assays, RAW264.7 cells expressing human IL-10Rα and IL-10Rβ were cultured with mouse IgG2a antibody (10 μg ml−1) and 10 nM isotype control, IL-10 Fc, or msIL-10R agonist for 1 h before addition of 10 μl Dynabeads Protein A to generate immune complexes. After 24 h, culture supernatants were harvested and cytokines quantified by MSD.
SPR measurement of binding kinetics
Antibody binding to human and cynomolgus macaque (cyno) IL-10Rα and IL-10Rβ was measured on the Biacore 8K system. The C1 chip (Cytiva VR100535) was preconditioned with glycine-NaOH/Triton X-100, activated with s-NHS/EDC chemistry, and anti-human Fc (Southern Biotech, 2014-1) was amine-coupled in sodium acetate (pH 5.0) to a final density of around 500 RU for antibody capture through the Fc tag; excess activated carboxyls were quenched with ethanolamine. Antibodies were captured at 50 nM to around 50–60 RU per channel. After ten blank buffer injections for stabilization, human and cyno IL-10Rα were injected as a threefold concentration series (150 nM top) and IL-10Rβ as a threefold series (1,000 nM top), using 180 s association and 30 min dissociation at 25 °C in 10 mM HEPES pH 7.4, 150 mM NaCl, 1 mM EDTA, 0.005% Tween-20 and 0.2 mg ml−1 BSA, with 10 mM glycine (pH 1.5) regeneration between cycles. Data were fit to a simple 1:1 kinetic model to derive kon and koff, from which KD was calculated (KD = koff/kon).
Cryo-EM sample preparation and data acquisition
To facilitate cryo-EM study of the IL-10Rα–IL-10Rβ–tandem VHH E07-A05 complex, framework mutations (Lys116/Pro119/Lys244/Pro247) were introduced into the tandem VHH so that a tool anti-VHH Fab (Fab 1; PDB: 7PIJ) could bind to and enlarge the particle. When IL-10Rα ECD, IL-10Rβ ECD, tandem VHH and tool Fab 1 were mixed at a 1:1:1:2 molar ratio (0.8 mg ml−1, in 25 mM HEPES pH 7.5 and 150 mM NaCl), the Fab bound preferentially to the engineered site on A05 but heterogeneously to E07, of which the engineered Fab site is not solvent exposed in the complex (Extended Data Fig. 4). To improve homogeneity, IL-10Rα ECD, IL-10Rβ ECD and tandem VHH were pre-incubated on ice for 1 h before adding tool Fab 1 to a 1.2:1:1:1 final molar ratio, which markedly improved particle homogeneity in 2D and 3D classification (Supplementary Fig. 10). For the IL-10Rα–VHH E07 complex, partially deglycosylated IL-10Rα ECD, VHH E07 and a second anti-VHH Fab (Fab 2, GenScript, A02165) were mixed at a 1.2:1:1 molar ratio (1.3 mg ml−1, in 25 mM HEPES pH 7.5 and 150 mM NaCl) and incubated on ice for 1 h. Deglycosylation significantly improved IL-10Rα density in the map. Complexes were cross-linked with 0.05% glutaraldehyde (15 min on ice in the dark), and a 3.5 µl aliquot was applied to a glow-discharged UltrAuFoil R1.2/1.3 grid (R1.2/1.3, Quantifoil), blotted in Vitrobot Mark IV (Thermo Fisher Scientific) (2 s, 4 °C, 100% humidity), and plunge-frozen in liquid ethane. Both untilted and stage-tilted (15–30°) data were acquired to improve angular sampling. Videos were collected in EPU (Thermo Fisher Scientific) on the Titan Krios system (300 kV) (Thermo Fisher Scientific) with a Falcon 4i direct electron detector (Thermo Fisher Scientific) at ×165,000 nominal magnification (0.729 Å per pixel), a defocus range of −0.6 to −2.2 µm, and a Selectris X energy filter (10 eV slit), over a 5.85 s exposure with 50 frames and a total dose of around 50 e− Å−2.
Cryo-EM image processing and model building
All data processing was performed in CryoSPARC (v.4)39 with patch motion correction and patch contrast transfer function (CTF) estimation; images with CTF fit to 5.5 Å or better were retained. For the IL-10Rα–IL-10Rβ–tandem VHH E07-A05–anti-VHH Fab complex (Supplementary Fig. 10), 15,755 untilted videos (two sessions of 6,460 and 9,295) and 7,508 tilted (15–30°) videos were collected, processed separately and merged after 2D classification, yielding 2,730,139 particles used for iterative heterogeneous refinement, 3D classification and non-uniform refinement with local and global CTF refinement to give a 3.14 Å map (FSC = 0.143; 101,358 particles). For the IL-10Rα–VHH E07–anti-VHH Fab complex (Supplementary Fig. 11), 19,416 untilted videos (two sessions of 9,680 and 9,736) and 7,461 tilted (15–30°) videos yielded 1,215,819 particles used for ab initio reconstruction, heterogeneous refinement and non-uniform refinement with local and global CTF refinement, giving a 2.40 Å map (FSC = 0.143; 458,458 particles). The IL-10Rα structure (PDB: 1Y6K) and an AlphaFold40 model of VHH E07 were docked into the 2.40 Å map by rigid-body fitting in ChimeraX41, manually adjusted in Coot42 and refined with phenix.real_space_refine43. The refined IL-10Rα–VHH E07 model, together with IL-10Rβ (PDB 3LQM) and the anti-VHH tool Fab (PDB 7PIJ), served as initial models to refine against the 3.14 Å complex map. The Gly-Gly-Gly-Ser inter-VHH linker was not resolved and was omitted from model building. Structural figures were generated and validated using standard cryo-EM refinement metrics, with full processing pipelines, particle counts and map–model statistics provided in Supplementary Figs. 10 and 11 and Supplementary Table 5.
DSS-induced colitis model
Ten-week-old female humanized IL10RA/IL10RB mice received 2% DSS in drinking water for 7 days and were dosed three times weekly with isotype control, IL-10 Fc or msIL-10R agonist (1 nmol per mouse). Colon length and weight were measured on day 10 and colonic gene expression was quantified by TaqMan qPCR. Neutrophil gating is shown in Supplementary Fig. 18.
LPS-induced sepsis model
Six-week-old female humanized IL10RA/IL10RB mice received intraperitoneal LPS (E. coli O111:B4, 4 mg kg−1) with a single dose of isotype control, human IL-10 Fc or msIL-10R agonist. Serum TNF, IL-6 and IL-12p70 were measured 4 h later by MSD (N05048A-1).
KLH-induced DTH sensitization recall model
Humanized IL10RA/IL10RB mice were sensitized subcutaneously with KLH/complete Freund’s adjuvant (Sigma, H7017; Chondrex, 7009), dosed intraperitoneally on day 4 with isotype, IL-10 Fc or msIL-10R agonist (2 mg kg−1), rechallenged intradermally with KLH in the ear on day 5, and taken down on day 8. Draining lymph node cells were restimulated ex vivo with KLH, and supernatant cytokines were measured by MSD (N05048A-1).
RNA extraction, library generation and sequencing for RNA-seq analysis
Total RNA was extracted (Qiagen, 74104), quality-checked and used (500 ng) for TruSeq stranded mRNA library preparation and paired-end sequencing on an Illumina NextSeq2000. A Nextflow pipeline performed quality control (FastQC, RNA-SeQC2, MultiQC), alignment to GRCh38 with STAR and gene quantification with featureCounts44,45. Differential expression used TMM normalization and edgeR (glmQLFit/glmQLFTest) with Benjamini–Hochberg FDR < 0.05.
DC differentiation and cytokine secretion
CD14+ monocytes were differentiated into DCs with IL-4 and GM-CSF for 6 days, with IL-10 Fc or msIL-10R agonist (10 nM) present throughout differentiation, and CD1a/CD14 expression was assessed by flow cytometry. The gating strategy is shown in Supplementary Fig. 17. For activation, DCs were stimulated with zymosan with or without IL-10–Fc or msIL-10R agonist molecules for 24 h, and TNF and IL-23 were measured by MSD.
DC antigen presentation to HA-specific CD4+ T cells
Monocyte-derived DCs were differentiated (R&D Systems, CDK004) and matured (IL-4, GM-CSF, TNF and LPS) in the presence of isotype control, IL-10 Fc or msIL-10R agonist (1 or 10 nM), then pulsed with influenza haemagglutinin HA307 peptide (Influenza A HA 307–319, DRA1*01:01/DRB1*04:01, PKYVKQNTLKLAT). HA307-reactive CD4+ T cells from an HLA-DRB1*04:01 donor were expanded, tetramer-sorted and co-cultured with peptide-pulsed DCs. Expansion of tetramer+ T cells was assessed by flow cytometry using the gating strategy shown in Supplementary Fig. 18.
Pharmacokinetic assessment in cynomolgus monkey
Plasma concentrations of msIL-10R agonist and IL-10 Fc were measured by an MSD electrochemiluminescence assay using anti-human Fc capture (Southern Biotech, 9048-08) and SULFO-TAG anti–IL-10Rα detection, with a lower limit of quantification of 15 ng ml−1 and concentrations back-calculated from four-parameter logistic standard curves.
In vitro human B cell activation and plasmablast differentiation
Isolated human B cells (StemCell Technologies, 17954) were cultured with recombinant CD40 ligand (R&D, 6420-CLB, 1 μg ml−1) and IL-10 (10 nM), fed on day 3, and collected on day 6. Plasmablasts (CD19+CD27+CD38+) were quantified by flow cytometry, and the gating strategy is shown in Supplementary Fig. 19.
BMDM differentiation, pSTAT3 signalling and cytokine-secretion assays
Bone marrow from wild-type or Tyk2-deficient mice was differentiated into BMDMs with M-CSF (Gibco 31502250UG) for 5–6 days. For pSTAT3 induction, BMDMs were pretreated with upadacitinib (Tocris, 7783, 10 µM) or the JAK1-selective inhibitor VVD-118313 (MedChemExpress, HY-151385, 100 nM) and stimulated with IL-10–Fc (10 nM); intracellular pSTAT3 was measured by flow cytometry. For cytokine secretion, BMDMs were pretreated with upadacitinib, VVD-118313 or zasocitinib (1 µM), stimulated with IL-10 Fc and LPS, and supernatant cytokines were measured by MSD.
Statistical analysis
All analyses were performed using two-tailed Student’s t-tests, log-normalized Welch’s t-tests or one-way/two-way ANOVA with correction for multiple comparisons (GraphPad Prism 8). All bar graphs show means with overlaid scatter and s.d. as indicated in each figure legend.
Reporting summary
Further information on research design is available in the Nature Portfolio Reporting Summary linked to this article.