
Study population
EPIC is a large prospective multicentre study involving 521,323 healthy adults from the general population, aged 35–70 years, who were recruited between 1992 and 2000 across 23 centres in 10 European countries: Denmark, France, Germany, Greece, Italy, the Netherlands, Norway, Spain, Sweden, and the United Kingdom. This cohort was primarily designed to investigate the relationship between diet and lifestyle factors and cancer risk, as well as other chronic diseases across a diverse European population. A detailed description of EPIC’s rationale, study design, data collection, and methodology has been provided elsewhere [16, 17].
At the time of recruitment, participants completed validated self-administered, country or study-centre-specific dietary and lifestyle questionnaires to obtain information about their diet and lifestyle prior to the inclusion. Informed consent was obtained from them as well during questionnaire completion. For the current study, participants also filled out a follow-up lifestyle questionnaire with completion dates ranging from 1996 to 2013. The International Agency for Research on Cancer (IARC) Ethics Committee and all participating centres granted ethical approval.
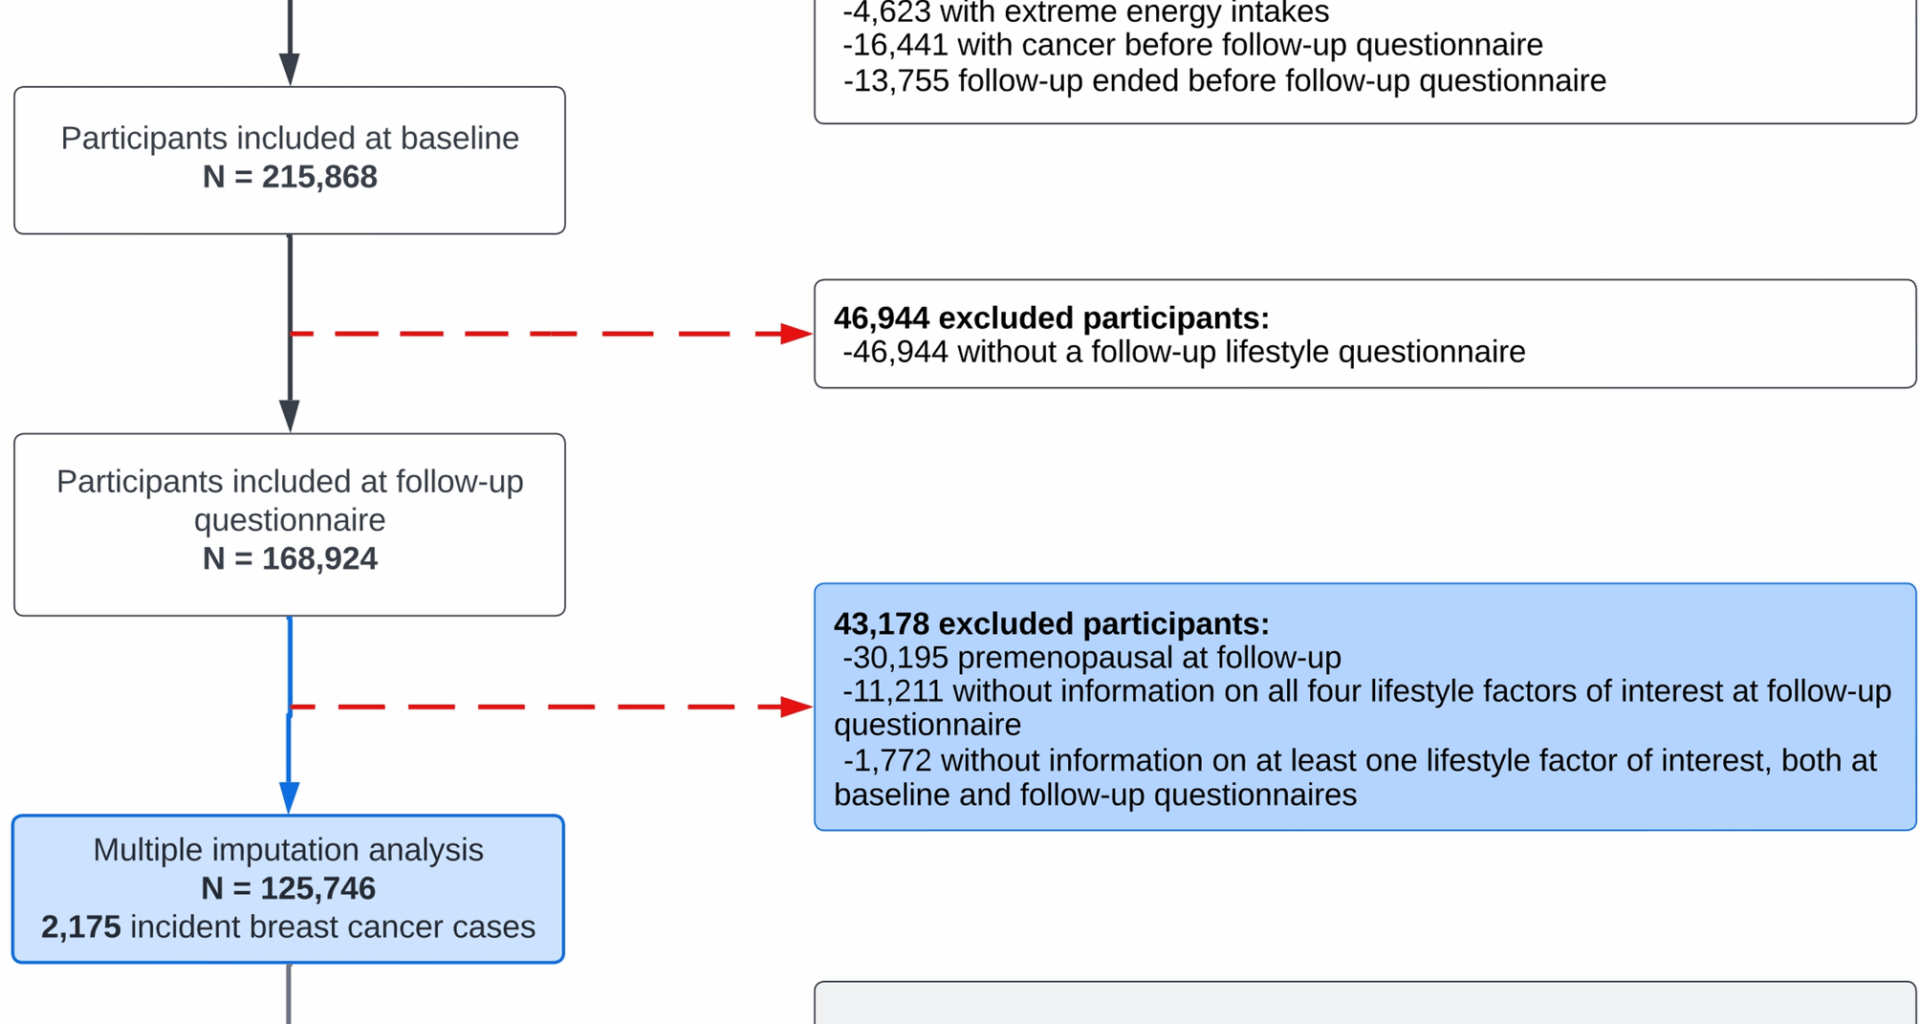
The study population underwent exclusions based on specific criteria, as illustrated in Fig. 1. Firstly, male participants were excluded as this study focuses exclusively on female breast cancer. Greek, Norwegian, and Swedish participants were also excluded due to administrative restrictions regarding data usage. Denmark was further excluded due to the complete absence of information concerning alcohol consumption from the follow-up assessment. Female participants who did not complete a baseline questionnaire were excluded, as well as those whose energy intake was below the 1st percentile and above the 99th percentile of the energy intake to energy requirement ratio distribution, to reduce the influence of potential misreporting or outliers in dietary data. Additional exclusions were applied to participants who had a cancer diagnosis prior to completing the follow-up questionnaire, if their follow-up period ended before they could complete the questionnaire, or if they failed to complete it. Participants who remained premenopausal at follow-up were excluded as menopausal status constitutes a significant effect modifier in the association between BMI and breast cancer risk [3, 18]. Furthermore, given that the primary exposure of interest was lifestyle changes, women who had missing information about all four lifestyle factors at follow-up or lacked information on at least one lifestyle factor at both baseline and follow-up were also excluded from the analysis. Following these initial exclusions, the dataset included 125,746 women, among whom 2,175 cases of incident invasive postmenopausal breast cancer were identified after the follow-up questionnaire. The main analysis was performed on this dataset after applying multivariate imputation by chained equations (MICE) to handle missing data in HLI component scores at baseline and follow-up, from which HLI changes were subsequently derived, along with other covariates. As part of the sensitivity analyses, we subsequently conducted a complete-case analysis, excluding approximately 29% of participants due to missing data on HLI change and covariates. This resulted in a sample of 89,735 women with 1,605 cases of incident invasive postmenopausal breast cancer.
Fig. 1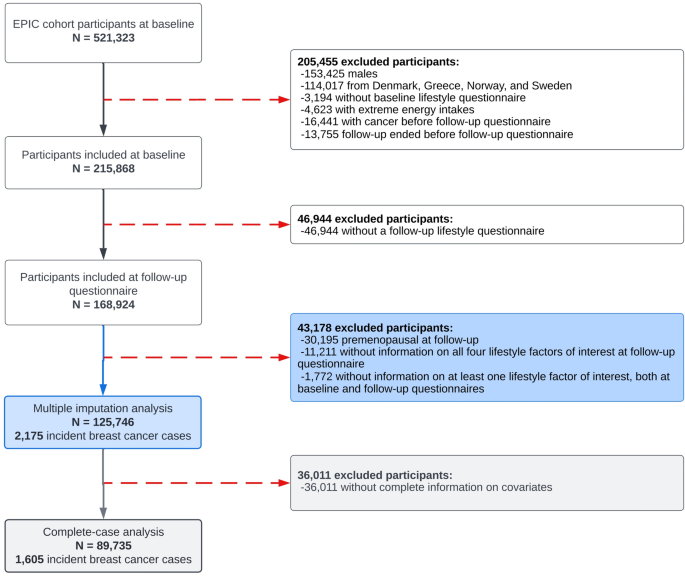
Selection of the study population in EPIC. Note: there were no participants without information on all four lifestyle factors of interest at baseline questionnaire
Assessment of HLI changes
This study examined four lifestyle factors: smoking habits, alcohol consumption, BMI, and physical activity levels. Although diet is usually part of commonly studied lifestyle patterns, it was not included in the construction of the HLI in this analysis, since detailed dietary information in EPIC was available solely at baseline. However, a diet score at baseline was calculated and used as an adjustment variable (further details provided in the statistical analysis section).
Each factor was assigned a score ranging from 0 to 4 according to progressively healthier categories of behaviour (Supplementary Fig. 1). “Favourable” behaviours were defined as follows: never smoking (never smoked = 4; smoking cessation > 10 years = 3; smoking cessation ≤ 10 years = 2; current smoking ≤ 15 cigarettes/day = 1; current smoking > 15 cigarettes/day = 0), low alcohol consumption (< 0.1 (g/day) = 4; 0.1–4.9 (g/day) = 3; 5.0–9.9 (g/day) = 2; 10.0–19.9 (g/day) = 1; ≥ 20 (g/day) = 0), low BMI (< 22 = 4; 22–23.9 = 3; 24–25.9 = 2; 26–29.9 = 1; ≥ 30 = 0), and the top quintile of physical activity, measured using weekly recreational and household metabolic equivalent of task units (in MET-hours/week with baseline (B) and follow-up (F) respectively: B: ≥ 136; F: ≥ 126 = 4; B: 96–135.9; F: 90–125.9 = 3; B: 68–95.9; F: 63–89.9 = 2; B: 44–67.9; F: 39–62.9 = 1; B: < 44; F: < 39 = 0). HLI scores were computed by aggregating the scores of all four factors at both baseline and follow-up, resulting in a total score ranging from 0 to 16, consistent with the methodology employed in a prior EPIC study on HLI changes and colorectal cancer risk [19]. The primary exposure of interest was the change in HLI score between baseline and follow-up, calculated by subtracting the baseline score from the follow-up score. This yielded a possible range from − 16 (maximum worsening) to + 16 (maximum improvement).
Ascertainment of postmenopausal invasive breast cancer cases
Breast cancer cases within the EPIC cohort were identified through national cancer registries in Italy, the Netherlands, Spain, and the United Kingdom, in conjunction with health insurance records, cancer and pathology registries, as well as through active follow-up conducted in France and Germany [17]. Invasive breast cancer cases were defined as the first primary invasive breast tumours (categories under the codes C50.0–C50.9, using the 10th revision of the International Classification of Diseases, ICD-10). Estrogen receptor (ER) status has been documented in pathology reports subsequent to 1997 [6]. Consequently, cases were classified as ER-positive (ER +), ER-negative (ER −), or unknown.
Menopausal status definition
Menopausal status at baseline and follow-up was determined from questionnaire data collected at these two relevant time points. Participants were classified into three categories: premenopausal, perimenopausal, and postmenopausal. As previously mentioned, premenopausal women at follow-up were excluded.
Premenopausal women were characterised as those who experienced regular menstrual cycles within the last 12 months. Perimenopausal women were categorised as those who experienced irregular menstrual cycles in the past 12 months or had menstrual periods in the previous year but were no longer menstruating. Postmenopausal women were identified as those who had no menstrual periods in the past 12 months or had undergone a bilateral ovariectomy, resulting in a surgically induced menopause.
In cases where women had missing or incomplete questionnaire data, reported a previous hysterectomy, or indicated the use of exogenous hormones (oral contraceptives (OC) or menopausal hormone treatment (MHT)), their menopausal status was determined based on age cut-off points. Women younger than 46 years at recruitment were considered premenopausal, those between 46 and 55 years old were categorised as perimenopausal, and women aged 55 or older were classified as postmenopausal.
For analytical purposes, women who were classified as perimenopausal, postmenopausal, or surgically postmenopausal at baseline were grouped into a single “postmenopausal” category. Indeed, according to the updated of Stages of Reproductive Aging Workshop criteria, published 10 years later (STRAW + 10), perimenopause includes both the menopausal transition and the first 12 months after the final menstrual period (early postmenopause), reflecting a physiological continuum rather than distinct phases [10]. Grouping these stages allows for consistent categorisation and improves the robustness of subgroup analyses. The detailed distribution of menopausal status transitions from baseline to follow-up, without merging these subgroups, is presented in descriptive analyses.
Statistical analysis
Descriptive analyses across the categories of HLI changes (where < − 1 = “worsen”; [− 1;1] = “stable”; > 1 = “improve”; and “missing HLI change”) were conducted using cross-tabulations that included frequencies and percentages for categorical variables, as well as medians and the 25th–75th percentiles for continuous variables.
In order to address missing data on HLI changes (n = 22,937) and covariates, MICE was applied, under the assumption that missingness occurs at random [20, 21]. The model incorporated all four HLI components at baseline and follow-up (i.e., smoking, alcohol, BMI, and physical activity), including covariates identified as potential confounders. A total of 15 imputed datasets were generated, each consisting of 20 iterations, which was deemed sufficient to ensure convergence of the imputation models given the sample size and number of variables.
The validity of the imputed data was assessed by comparing variable distributions between the complete and imputed datasets for categorical variables, along with employing density plots for continuous variables. The convergence of the algorithm was evaluated through visual inspection of trace plots corresponding to each imputed variable. The imputed datasets were used in the primary analyses, with estimates pooled in accordance with Rubin’s rules [21].
In faceted dot plots, the mean changes in individual components are summarised both overall and by HLI change categories, using imputed data.
Participants were followed from the lifestyle questionnaire completed at the follow-up assessment until the first occurrence of cancer (excluding non-melanoma skin cancers), death, emigration, loss to follow-up or the end of the follow-up period, whichever came first. The end of follow-up dates varied by country, with maximum dates ranging from 2008 to 2012. Multivariable Cox proportional hazards regression models, using participants’ age as the underlying time scale, were used to estimate hazard ratios (HRs) and the corresponding 95% confidence intervals (CIs) for the association between changes in HLI and the risk of postmenopausal breast cancer. Changes in HLI were initially examined as a continuous variable and subsequently as a categorical variable, as previously described. Associations between continuous changes in the four individual HLI components and postmenopausal breast cancer risk were assessed in a single, mutually adjusted, model. To evaluate whether specific lifestyle components disproportionately influenced the association, the relationship between continuous HLI change and postmenopausal breast cancer risk was also modelled using HLI scores recalculated with one component excluded at a time (e.g. smoking, alcohol, BMI, physical activity). The corresponding baseline HLI score, excluding the same component, was included in each model as an adjustment variable. HRs were estimated overall and stratified by breast cancer subtype, based on the ER status (“ER- + ”, “ER- “, or “Unknown”), with all categories included in the analyses. To account for competing risks, the Lunn & McNeil approach was applied [22]. This methodology involves data augmentation, where each subject is assigned a separate observation for each ER status, followed by stratification by event type in the Cox model. Additionally, associations between categorical HLI levels at follow-up ([0–8]; [8–11]; ≥ 11) with breast cancer risk, were also assessed within each baseline HLI category ([0–8]; [8–11]; ≥ 11). For each stratum, HRs were estimated by follow-up HLI level, using women who remained in the same category over time as the reference group.
All models were stratified by study centre and age at recruitment rounded to the nearest year, and adjusted for confounders selected a priori in accordance with the literature [6] for the relative inequality index (a regression-based measure of socioeconomic status ranging from 0 to 1, with higher values indicating lower socioeconomic status [23]), height (cm), prior use of OCs up to recruitment (“yes”; “no”), prior use of MHT up to recruitment (“premenopausal”; “yes”; “no”), age at menarche (< 12 years; 12–14 years; > 14 years), age at first full-term pregnancy (“nulliparous”; < 21 years; 21–30 years; > 30 years), number of full-term pregnancies (“nulliparous”; 1 FTP; 2 FTPs; ≥ 3 FTPs, with FTP standing for full-term pregnancy), HLI score at baseline (ranging from 0 to 16), diet score at baseline (based on the combination of seven dietary factors at baseline including cereal fibre; folate; polyunsaturated to saturated fat ratio; fatty fish, as a marker for omega-3 fatty acids; margarine, as a marker for industrially produced trans-fats; glycaemic load; vegetable; and fruits, [24]), and the time interval between baseline and follow-up questionnaires. These adjustment variables were obtained from lifestyle questionnaires and food frequency questionnaires (FFQs) administered at baseline.
As sensitivity analyses, the observation period was initiated one to three years after the follow-up questionnaire to account for potential reverse causation stemming from lifestyle changes induced by early symptoms of undiagnosed breast cancer. A complete-case analysis was also conducted after excluding participants with incomplete data on HLI change and covariates. Finally, the main analysis was also repeated in non-MHT users.
Statistical significance was defined as results with a p-value below 0.05. All analyses were performed using R version 4.4.2 (R Foundation for Statistical Computing, Vienna, Austria) via the RStudio® interface.