
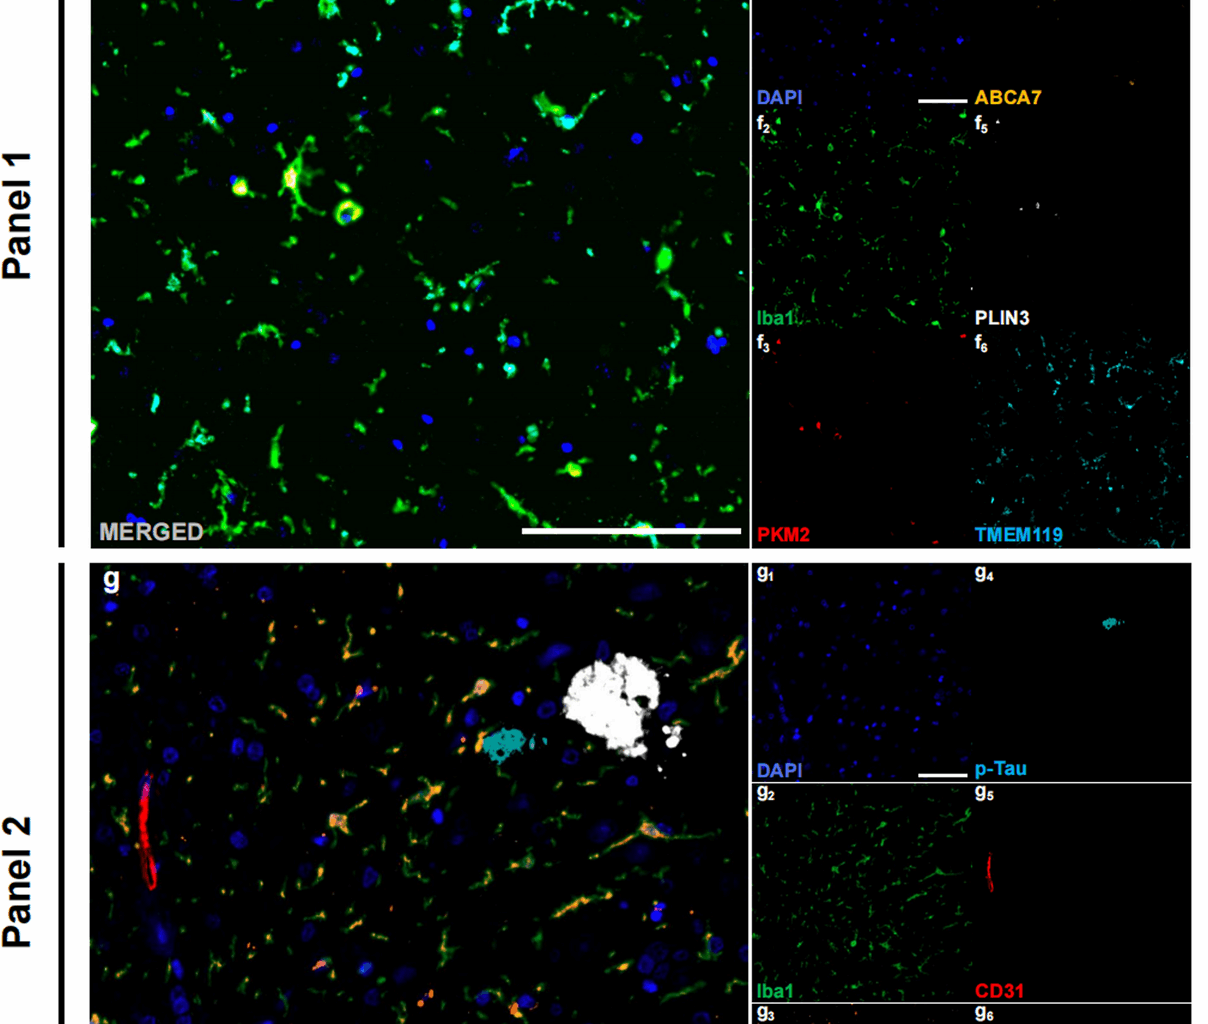
In this study, we analysed HP‒EC tissue from 8 AD patients (mean age: 86.5 years, 5 males, 3 females, ABC score: middle to high AD neuropathologic change) and 8 age- and sex-matched CTL subjects (mean age: 78.8 years, 5 males, 3 females, ABC score: no to low AD neuropathologic change) (Table 1; Fig. 1a). Representative annotations of brain sections are shown in Fig. 1c. In the AD group, there were significantly more Aβ plaques and p-Tau aggregates than in the CTL group (Aβ plaques: p < 0.001, Shapiro-Wilk normality test, CTL p = 0.338, AD p = 0.522, Fig. 1d; p-Tau: p = 0.002, Shapiro-Wilk normality test, CTL p = 0.541, AD p = 0.929, Fig. 1e), indicating robust evaluation of ABC scores. Multiplex immunohistochemical staining was performed using the following two panels: Panel 1, which included Iba1 (microglia), PKM2 (glycolytic enzyme), ABCA7 (Human AD microglia marker, HAM), TMEM119 (homeostatic signature), and PLIN3 (Lipid droplet accumulating microglia marker, LDAM) (Fig. 1f); Panel 2, which included Iba1, PKM2, CD31 (endothelial cells), p-Tau, and Aβ (Fig. 1g); and Panel 3, which included Iba1, PKM2, CD68 (phagocytosis marker), PLIN2 (phagocytic exhaustion), p-Tau, and Aβ (Fig. 1h).
Table 1 Basic information of patientsFig. 1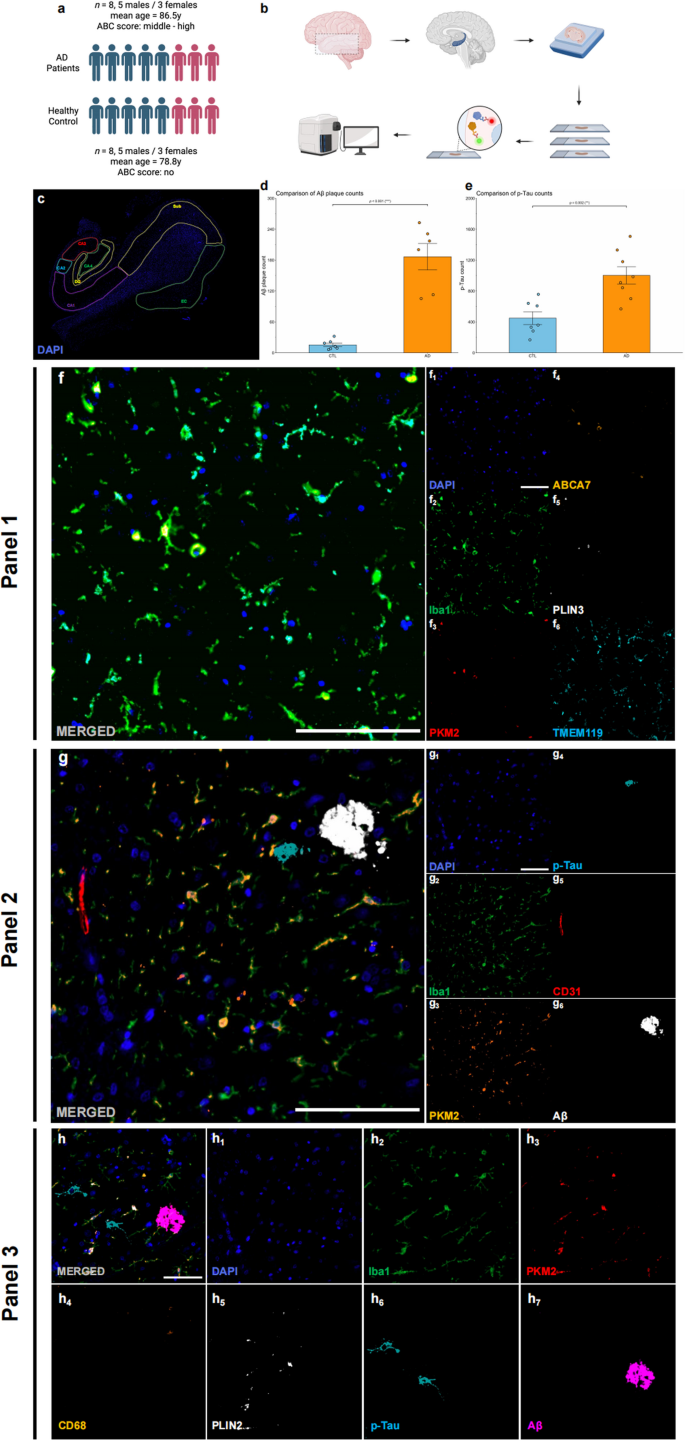
Study overview. (a) Age and sex composition of the AD (n = 8) and control (n = 8) groups. (b) Schematic of the experimental workflow from tissue processing to imaging and analysis. (c) An example of annotations in brain slides. (d) Quantitative analysis of total Aβ plaque counts in AD patients and CTLs. (e) Quantitative analysis of total p-Tau counts in AD patients and CTLs. (f) Example merged mIHC images from Panel (1) DAPI (blue, f1), Iba1 (green, f2), PKM2 (red, f3), ABCA7 (orange, f4), PLIN3 (white, f5), and TMEM119 (cyan, f6). Scale bars = 50 μm. (g) Example merged mIHC images from Panel (2) DAPI (blue, g1), Iba1 (cyan, g2), PKM2 (orange, g3), p-Tau (cyan, g4), CD31 (red, g5), and Aβ (white, g6). Scale bars = 50 μm. (h) Example merged mIHC images from Panel (3) DAPI (blue, h1), Iba1 (cyan, h2), PKM2 (red, h3), CD68 (orange, h4), PLIN2 (white, h5), p-Tau (cyan, h6), and Aβ (magenta, h7). Scale bars = 50 μm. All the data are presented as the means ± SEMs, and unpaired t tests were performed (**p < 0.01 and ***p < 0.001)
PKM2+Iba1+ microglia predominantly exhibit a disease-associated phenotype in AD brains
To further understand the heterogeneity of glycolytically active microglia in AD, we compared the proportion of distinct PKM2+ microglial subpopulations between AD patients and CTL individuals. Specifically, we examined homeostatic microglia (TMEM119+), HAM-like microglia (ABCA7+), and LDAM (PLIN3+).
Representative mIHC images demonstrated clear colocalization of PKM2+Iba1+ microglia with the HAM-like marker ABCA7 in AD brain samples, confirming a robust presence of HAM-like microglia expressing PKM2 (Fig. 2a). Conversely, colocalization of PKM2+Iba1+ microglia with the homeostatic marker TMEM119 was relatively infrequent in AD samples, reflecting a reduction in the homeostatic microglial population (Fig. 2a). LDAM (PLIN3+) were also identified among PKM2+Iba1+ microglia, showing a modest presence (Fig. 2a). In control samples, colocalization of PKM2+Iba1+ microglia with ABCA7, TMEM119, and PLIN3 appeared balanced without clear predominance, indicating a mixed microglial state with lower glycolytic activation compared to AD samples (Fig. 2b). These findings collectively highlight a shift toward disease-associated glycolytic microglial phenotypes in AD.
Quantitative analyses were performed to determine the proportion differences among these PKM2⁺Iba1⁺ microglial subtypes. Overall, PKM2⁺Iba1⁺ glycolytic microglia were significantly increased in AD compared to control brains (p < 0.001; Shapiro-Wilk normality test, CTL p = 0.914, AD p = 0.516; Fig. 2c). Among PKM2+Iba1+ microglia, HAM-like (ABCA7+PKM2+Iba1+) microglia represented the predominant subtype (68.1%), followed by LDAM (PLIN3+PKM2+Iba1+) microglia (13.7%), and homeostatic (TMEM119+PKM2+Iba1+) microglia (2.5%; Fig. 2d). HAM-like (ABCA7+PKM2+Iba1+) microglia exhibited significantly greater proportions compared with LDAM (PLIN3+PKM2+Iba1+) microglia (p < 0.001) and homeostatic (TMEM119+PKM2+Iba1+) microglia (p < 0.001). LDAM (PLIN3+PKM2+Iba1+ microglia) also showed a slightly higher proportion compared to homeostatic TMEM119+PKM2+Iba1+ microglia (p < 0.001; Shapiro-Wilk normality test, ABCA7 p = 0.735, PLIN3 p = 0.283, TMEM119 p = 0.056; Fig. 2d). These results indicate a clear hierarchical distribution among glycolytic microglial subtypes, with HAM-like microglia representing the major glycolytic phenotype.
When comparing AD to CTL groups, HAM-like ABCA7+PKM2+Iba1+ microglia were significantly increased in AD patients (p < 0.001; Shapiro-Wilk normality test, CTL p = 0.312, AD p = 0.854), further emphasizing the shift toward disease-associated glycolytic activation (Fig. 2e). LDAM PLIN3+PKM2+Iba1+ microglia showed a slight yet statistically significant increase in the AD group (p = 0.003; Shapiro-Wilk normality test, CTL p = 0.107, AD p = 0.873), suggesting a mild but meaningful alteration in lipid metabolism within glycolytic microglia (Fig. 2g). In contrast, homeostatic TMEM119+PKM2+Iba1+ microglia had no significant difference in the AD group compared to controls (p = 0.140, Shapiro-Wilk normality test, CTL p = 0.052, AD p = 0.455), reflecting that the homeostatic phenotype is rarely associated with glycolytic PKM2+Iba1+ microglia, thus remaining relatively unchanged in the AD glycolytic context (Fig. 2i).
Regional analyses across HP-EC consistently validated these findings, demonstrating significant increases in HAM-like ABCA7+PKM2+Iba1+ microglia across all examined regions (all ps < 0.05; all Shapiro–Wilk normality test ps > 0.05; Fig. 2f). Similarly, LDAM PLIN3+PKM2+Iba1+ microglia were significantly elevated in most regions, with the exceptions of CA2 (p = 0.080) and CA3 (p = 0.252; other regions, ps < 0.05; all Shapiro–Wilk normality test ps > 0.05; Fig. 2h). Conversely, homeostatic TMEM119+PKM2+Iba1+ microglia exhibited no significant regional differences between AD and controls (all ps > 0.05; all Shapiro–Wilk normality test ps > 0.05; Fig. 2j). These regional patterns collectively indicate that the shift towards HAM-like and LDAM phenotypes broadly occurs across areas particularly vulnerable to AD pathology.
These results collectively indicate that glycolytic reprogramming of microglia in AD is strongly linked to specific functional states, characterized by increased proportions of disease-associated HAM-like and LDAM phenotypes, accompanied by a concurrent reduction in homeostatic microglial populations.
Fig. 2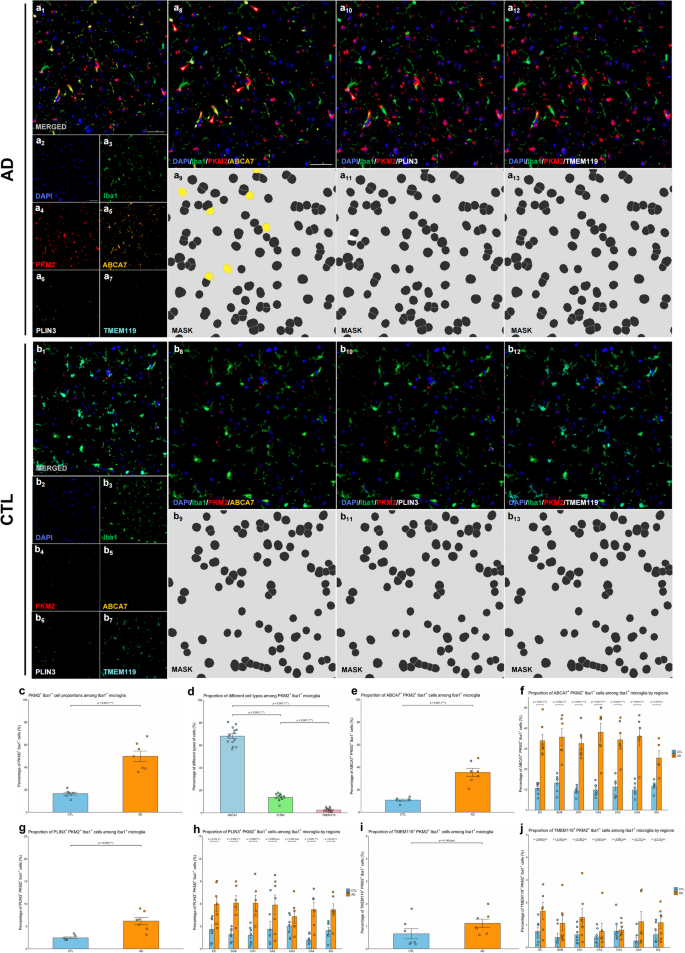
Glycolytic microglia in AD exhibit a disease-associated phenotype in AD brains. (a-b) Representative mIHC images illustrating colocalization of PKM2+Iba1+ cells with ABCA7, PLIN3, and TMEM119 in the AD (a) and CTL (b) groups. Images a1 and b1 show the merged mIHC images. Images a2–a6 and b2–b6 display single-channel images corresponding to a1, including DAPI (blue, a2 and b2), Iba1 (green, a3 and b3), PKM2 (red, a4 and b4), ABCA7 (orange, a5 and b5), PLIN3 (white, a6 and b6), and TMEM119 (cyan, a7 and b7). Images a8 and b8 represent the original fluorescence channels for Iba1, PKM2, ABCA7, and DAPI, with arrows highlighting ABCA7+PKM2+Iba1+ cells. Images a9 and b9 illustrate the corresponding segmentation masks for a8 and b8. Images a10 and b10 show original fluorescence channels for Iba1, PKM2, PLIN3, and DAPI, with arrows indicating PLIN3+PKM2+Iba1+ cells. Images a11 and b11 present the corresponding masks for a10 and b10. Images a12 and b12 display original fluorescence channels for Iba1, PKM2, TMEM119, and DAPI. Images a13 and b13 show the corresponding masks for a12 and b12. Scale bars = 50 μm. (c) Proportions of PKM2+Iba1+ cells within Iba1+ microglial population. (d) Comparison of ABCA7+PKM2+Iba1+, PLIN3+PKM2+Iba1+, and TMEM119+PKM2+Iba1+ proportions within Iba1+ microglial population. (e) Abundance of ABCA7+PKM2+Iba1+ microglia in AD vs. CTL brains. (f) Regional comparison of ABCA7+PKM2+Iba1+ microglia across HP‒EC in AD vs. CTL brains. (g) Abundance of PLIN3+PKM2+Iba1+ microglia in AD vs. CTL brains. (h) Regional comparison of PLIN3+PKM2+Iba1+ microglia across HP‒EC in AD vs. CTL brains. (i) Abundance of TMEM119+PKM2+Iba1+ microglia in AD vs. CTL brains. (j) Regional comparison of TMEM119+PKM2+Iba1+ microglia across HP‒EC in AD vs. CTL brains. All the data are presented as the means ± SEMs, and unpaired t tests were performed (*p < 0.05, **p < 0.01, ***p < 0.001, and ns: no significant difference)
Glycolytic microglia exhibit increased numbers and altered spatial distribution around Aβ plaques in AD brains
To investigate the spatial relationship between glycolytically active microglia and Aβ plaques in AD, we defined the region within a 50 μm radius from the center of Aβ plaques as “plaque-associated” or “periplaque.” (Fig. 3). Representative mIHC images demonstrated the proximity of PKM2+Iba1+ microglia to Aβ plaques in AD patients compared to CTL (Fig. 3a–b, image a1 and b1). Segmentation masks and spatial distance analyses revealed a distinct localization pattern, with PKM2+Iba1+ microglia positioned near Aβ plaques but not closely engaged or actively surrounding these plaques (Fig. 3a-b, image a2 and b2).
The spatial association between PKM2+Iba1+ microglia and Aβ plaques was also examined. The proportion of PKM2+Iba1+ microglia among plaque-associated microglia was significantly greater in AD brains than in control brains (p = 0.002, Shapiro-Wilk normality test, CTL p = 0.256, AD p = 0.139, Fig. 3c), suggesting preferential recruitment of glycolytic microglia to Aβ deposits.
To assess the specific spatial relationship between PKM2+Iba1+ microglia and Aβ plaques, we performed spatial modelling of PKM2+Iba1+ microglial cell counts relative to their distance from Aβ plaques (Fig. 3d). In AD brains, the number of glycolytic microglia increased progressively with increasing distance from plaque centres (β = 7.79, R2 = 0.324, p < 0.001), yet this accumulation was not associated with a corresponding reduction in plaque load. Importantly, the slope of the microglial distribution with distance differed significantly between groups (interaction term: β = −7.824, p < 0.001), suggesting altered spatial dynamics in AD, which may reflect inefficient targeting or impaired phagocytic function. Region-specific analyses revealed that the altered spatial distribution of PKM2⁺Iba1⁺ microglia differed significantly between AD and control groups, with notable differences observed in the EC (p = 0.015), SUB (p < 0.001), CA1 (p = 0.002), CA2 (p < 0.001), CA3 (p < 0.001), and DG (p = 0.005) regions (Fig. 3e).
These results indicate that glycolytically active microglia exhibit enhanced accumulation around Aβ plaques in AD brains, with a characteristic spatial distribution pattern significantly distinct from controls.
Fig. 3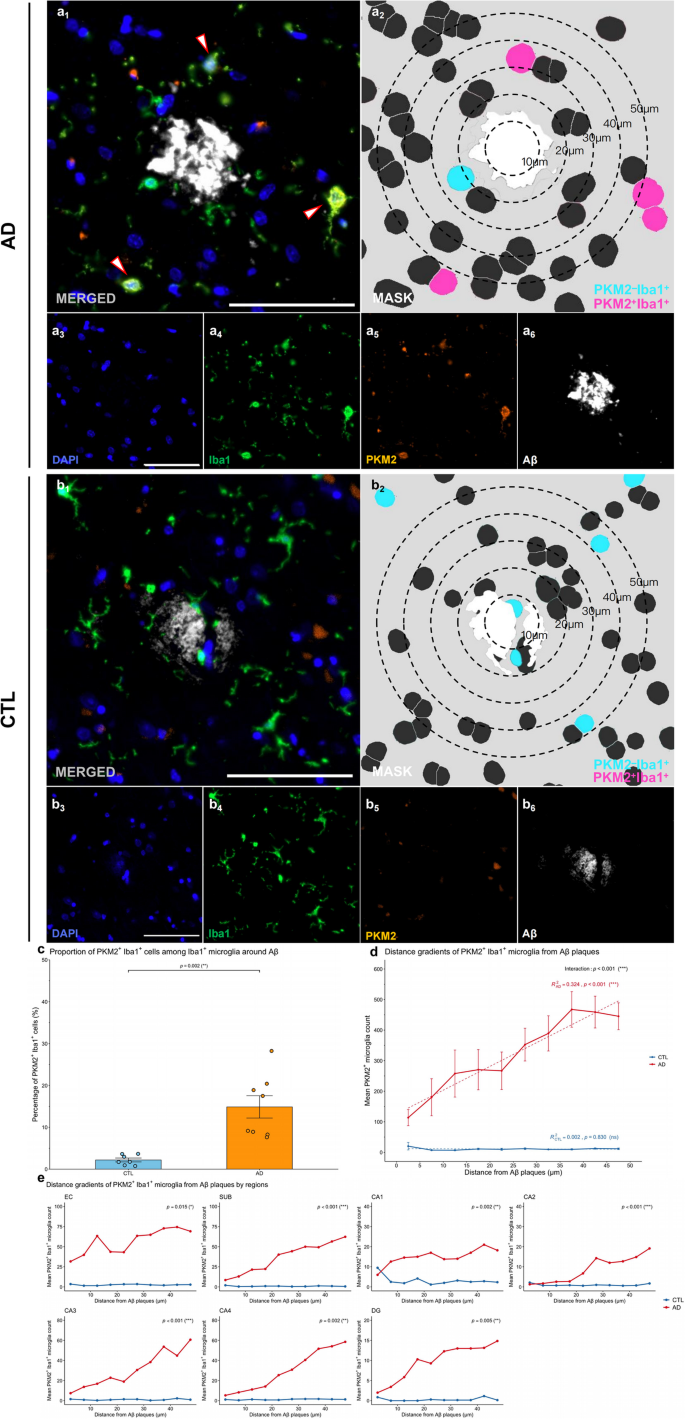
Glycolytic microglia show increased numbers and altered spatial distribution around Aβ in patients with AD. (a-b) Representative images from human HP‒EC sections showing PKM2+Iba1+ microglia in relation to Aβ plaques in the AD (a) and CTL (b) groups. Image a1 and b1 depicts the merged mIHC image, with arrows highlighting PKM2+Iba1+ microglia. Image a2 and b2 presents the corresponding mask, with concentric circles showing the distance to Aβ plaque (white) and highlighting PKM2+Iba1+ (magenta) and PKM2–Iba1+ (cyan) cell masks. Images a3–a6 and b3–b6 show the single-channel images derived from a1 and b1, including DAPI (blue, a3 and b3), Iba1 (green, a4 and b4), PKM2 (orange, a5 and b5), and Aβ (white, a6 and b6). Scale bars = 50 μm. (c) Proportion of PKM2+Iba1+ cells among plaque-associated Iba1+ microglia in AD vs. CTL brains. (d) PKM2+Iba1+ microglia–plaque spatial relationships in AD vs. CTL brains. (e) Region–specific analysis of PKM2+Iba1+ microglia–plaque spatial relationships across HP‒EC in AD vs. CTL brains. All the data are presented as the means ± SEMs, and unpaired t tests, fixed-effects and mixed-effects models were performed (*p < 0.05, **p < 0.01, ***p < 0.001, and ns: no significant difference)
Glycolytic microglia show altered Spatial distribution and increased numbers around p-Tau aggregates in AD brains
To investigate the spatial relationship between glycolytically active microglia and p-Tau aggregates in AD, we defined regions within a 50 μm radius from the center of p-Tau aggregates as “aggregate-associated” or “peri-aggregate” areas (Fig. 4). Representative mIHC images revealed that PKM2+Iba1+ microglia localized near p-Tau aggregates but rarely directly engaged these structures in AD compared to CTL (Fig. 4a-b, image a1 and b1). Segmentation masks and spatial distance analyses revealed that PKM2+Iba1+ microglia accumulated peripherally around p-Tau aggregates without evidence of effective clearance or engulfment activity (Fig. 4a–b, image a2 and b2).
Quantitative analysis revealed that the proportion of PKM2+Iba1+ microglia among aggregate-associated Iba1+ microglia was significantly greater in patients with AD than in controls (p < 0.001, Shapiro-Wilk normality test, CTL p = 0.726, AD p = 0.326, Fig. 4c), suggesting that glycolytic microglia are actively recruited towards regions of tau pathology.
Spatial modeling further clarified this relationship by showing that, in AD brains, the number of PKM2+Iba1+ microglia increased significantly with distance from p-Tau sites (β = 13.14, R2 = 0.175, p = 0.014; Fig. 4d), whereas no such pattern was detected in control brains (p = 0.054). Importantly, a significant interaction between disease status and distance (interaction term: β = −12.33, p = 0.014) indicated that the spatial distribution patterns of microglia around tau aggregates were significantly altered in AD patients. Region-specific analyses confirmed the disrupted microglial–p-Tau interaction in multiple brain areas (Fig. 4e). Significant interaction effects were observed in the EC (p < 0.001), SUB (p < 0.001), CA1 (p < 0.001), CA2 (p = 0.013), CA4 (p < 0.001), and DG (p = 0.004) regions, suggesting pronounced spatial uncoupling of microglial positioning and p-Tau in these regions. In contrast, no significant differences were found in the CA3 (p = 0.375) region.
These findings highlight that glycolytic microglia exhibit increased recruitment and distinct altered spatial distributions relative to p-Tau aggregates in AD brains, suggesting a specific spatial reorganization of microglia in response to tau-related neuropathology.
Fig. 4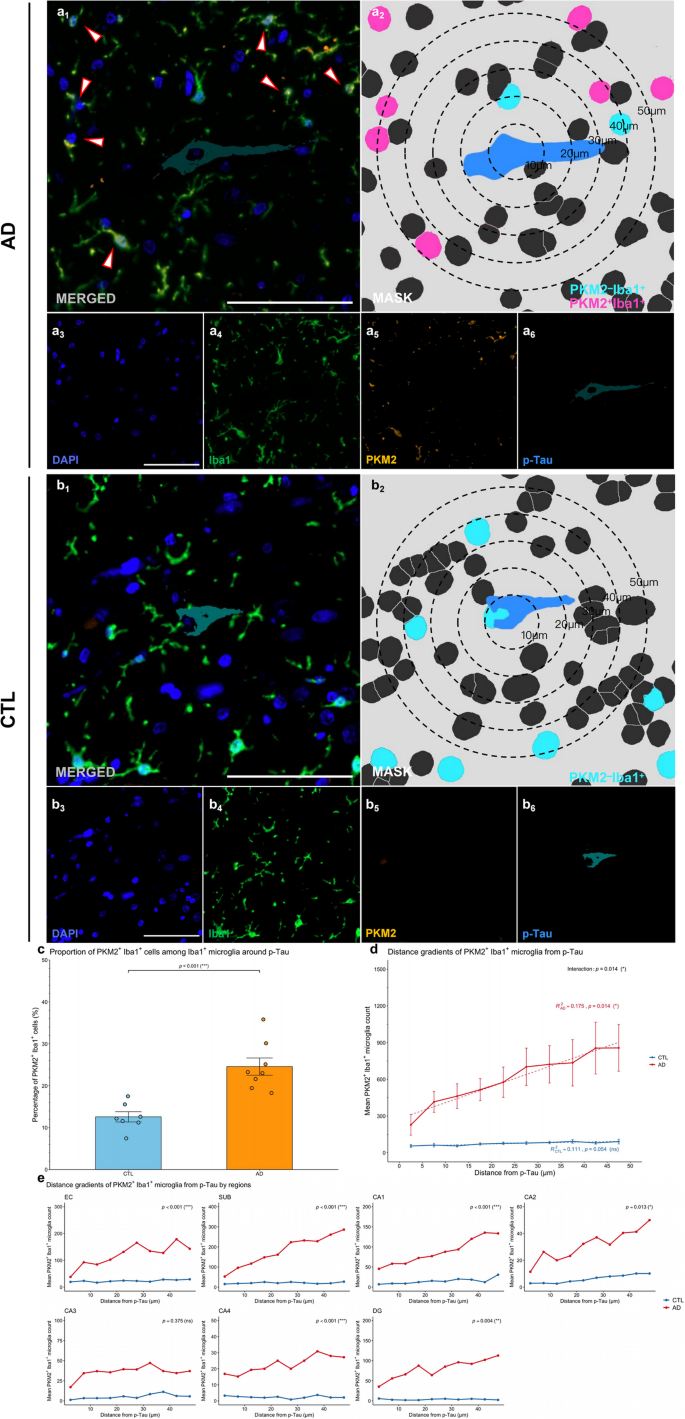
Glycolytic microglia show altered spatial distribution and increased numbers around p-Tau in patients with AD. (a-b) Representative images from human HP‒EC sections showing PKM2+Iba1+ microglia in relation to p-Tau aggregates in the AD (a) and CTL (b) groups. Image a1 and b1 depicts the merged mIHC image, with arrows highlighting PKM2+Iba1+ microglia. Image a2 and b2 presents the corresponding mask, with concentric circles showing the distance to p-Tau aggregates (blue) and highlighting PKM2+Iba1+ (magenta) and PKM2–Iba1+ (cyan) cell masks. Images a3–a6 and b3–b6 show the single-channel images derived from a1 and b1, including DAPI (blue, a3 and b3), Iba1 (green, a4 and b4), PKM2 (orange, a5 and b5), and p-Tau (cyan, a6 and b6). Scale bars = 50 μm. (c) Proportion of PKM2+Iba1+ cells among aggregate-associated Iba1+ microglia in AD vs. CTL brains. (d) PKM2+Iba1+ microglia–aggregate spatial relationships in AD vs. CTL brains. (e) Region–specific analysis of PKM2+Iba1+ microglia–aggregate spatial relationships across HP‒EC in AD vs. CTL brains. All the data are presented as the means ± SEMs, and unpaired t tests, fixed-effects and mixed-effects models were performed (*p < 0.05, **p < 0.01, ***p < 0.001, and ns: no significant difference)
Glycolytic microglia exhibit increased numbers and Preferential localization near cerebral blood vessels in AD brains
We next examined the spatial relationship between glycolytic microglia and cerebral blood vessels in patients with AD by analysing PKM2+Iba1+ microglia in relation to endothelial cells (CD31+) (Fig. 5). We defined the area within a radius of 50 μm from the vessel (CD31+ endothelial cells) as the “perivascular” region.
Representative mIHC images revealed the accumulation of PKM2+Iba1+ microglia near cerebral vessels, as indicated by merged images and spatial segmentation analyses (Fig. 5a–b, images a1–a2 and b1–b2). Compared with those in control brains, the proportion of PKM2+Iba1+ microglia within perivascular regions was significantly higher in AD brains than in CTL brains (p < 0.001; Shapiro-Wilk normality test, CTL p = 0.808, AD p = 0.227, Fig. 5c), indicating increased accumulation of glycolytic microglia around cerebral blood vessels in AD. Furthermore, PKM2+Iba1+ microglia in AD brains were significantly closer to blood vessels (p = 0.013, Shapiro-Wilk normality test, CTL p = 0.430, AD p = 0.116, Fig. 5d), indicating enhanced perivascular accumulation of glycolytic microglia in the diseased state.
To further investigate this spatial relationship, we analysed the distribution of PKM2+Iba1+ microglia across increasing distance intervals from CD31+ structures (Fig. 5d). Although AD brains consistently showed greater numbers of PKM2+Iba1+ microglia at all distances compared to CTL brains, no significant linear relationship between distance and microglial density was observed within either group (AD: p = 0.269, CTL: p = 0.286), and the interaction term between distance and disease status was also nonsignificant (p = 0.151). The lack of a significant linear relationship, despite increased proximity and numbers, suggests that glycolytic microglia preferentially localize near cerebral vessels in AD without exhibiting a strictly linear chemotactic gradient. Region-specific modelling further confirmed that none of the annotations analysed showed significant interactions between distance and disease group (all ps > 0.05). This pattern may imply the involvement of more complex mechanisms beyond simple directional chemotaxis, such as localized microenvironmental factors or vessel-associated signaling.
Collectively, these observations indicate that glycolytically active microglia in AD brains exhibit both increased numbers and enhanced proximity to cerebral blood vessels. Although the spatial distribution does not follow a simple linear gradient, the consistent preferential localization near vessels across brain regions underscores a prominent perivascular accumulation pattern, reflecting altered microglial–vascular interactions that could be crucial in AD pathogenesis.
Fig. 5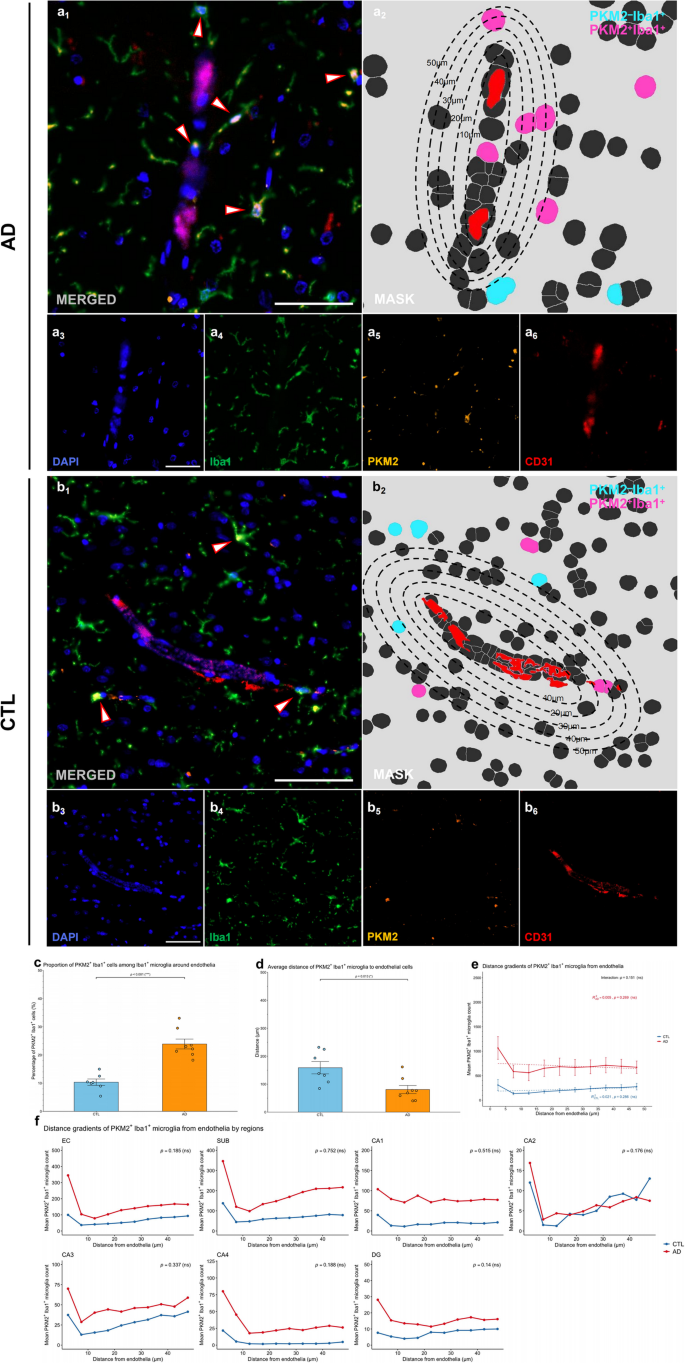
Glycolytic microglia show increased numbers and preferential localization near cerebral blood vessels in patients with AD. (a-b) Representative images from human HP‒EC sections showing PKM2+Iba1+ microglia in relation to blood vessels in the AD (a) and CTL (b) groups. Image a1 and b1 depicts the merged mIHC image, with arrows highlighting PKM2+Iba1+ microglia. Image a2 and b2 presents the corresponding mask, with concentric circles showing the distance to blood vessels (red) and highlighting PKM2+Iba1+ (magenta) and PKM2–Iba1+ (cyan) cell masks. Images a3–a6 and b3–b6 show the single-channel images derived from a1 and b1, including DAPI (blue, a3 and b3), Iba1 (green, a4 and b4), PKM2 (orange, a5 and b5), and CD31 (red, a6 and b6). Scale bars = 50 μm. (c) Proportion of PKM2+Iba1+ cells among endothelia-associated Iba1+ microglia in AD vs. CTL brains. (d) Quantification of the average distance between PKM2+Iba1+ microglia and the nearest blood vessel in AD vs. CTL brains. (e) PKM2+Iba1+ microglia–endothelial spatial relationships in AD vs. CTL brains. (f) Region–specific analysis of PKM2+Iba1+ microglia–endothelial spatial relationships across HP‒EC in AD vs. CTL brains. All the data are presented as the means ± SEMs, and unpaired t tests, fixed-effects and mixed-effects models were performed (*p < 0.05, **p < 0.01, ***p < 0.001, and ns: no significant difference)
Impaired phagocytic activity of glycolytic microglia in AD
To further investigate microglial phagocytic function abnormalities in AD, we utilized mIHC with Panel 3, including markers Iba1 (general microglia marker), PKM2 (glycolytic enzyme marker), CD68 (marker for active phagocytosis), PLIN2 (marker for phagocytic exhaustion), and pathological structures (p-Tau and Aβ). Our goal was to determine whether impaired microglial phagocytosis observed in AD is specifically associated with glycolytic metabolic changes.
Representative mIHC images revealed clear colocalization patterns among the selected markers. In AD brain samples, Iba1+ microglia exhibited visibly reduced CD68 expression, indicative of lower active phagocytosis, particularly within PKM2– populations; and increased PLIN2 expression, indicating higher phagocytic exhaustion, particularly within PKM2⁺ populations (Fig. 6a–h). Segmentation masks confirmed the precise localization and differential distribution of these markers around pathological aggregates (p-Tau and Aβ), demonstrating pronounced differences between AD and CTL groups.
Quantitative analysis showed that the overall proportion of CD68⁺Iba1⁺ microglia among total Iba1⁺ microglia was significantly lower in AD brains compared to CTL (p = 0.001, Shapiro-Wilk normality test, CTL p = 0.774, AD p = 0.762; Fig. 6i1), clearly indicating reduced overall phagocytic capacity in AD. However, within the glycolytic (PKM2⁺Iba1+) microglial subgroup, there was no significant difference in active phagocytosis (CD68+PKM2⁺Iba1+) proportions between AD and CTL (p = 0.342; Shapiro-Wilk normality test, CTL p = 0.214, AD p = 0.225; Fig. 6i2). In contrast, among the non-glycolytic (PKM2⁻ Iba1+) microglial subgroup, the active phagocytic (CD68+PKM2–Iba1+) proportion was significantly lower in AD brains compared to CTL (p < 0.001; Shapiro-Wilk normality test, CTL p = 0.557, AD p = 0.109; Fig. 6i3). This result indicates that the observed overall decline in phagocytic activity in AD brains is predominantly observed in PKM2⁻ microglial populations, suggesting that PKM2 expression is not closely related to active phagocytic function.
In parallel, we observed a significant increase in the proportion of PLIN2⁺Iba1⁺ microglia in AD brains compared to CTLs (p = 0.002, Shapiro-Wilk normality test, CTL p = 0.658, AD p = 0.787; Fig. 6i4), indicating enhanced phagocytic exhaustion in AD pathology. Notably, the proportion of PLIN2⁺PKM2⁺Iba1⁺ microglia was significantly higher in AD compared to CTL (p < 0.001; Shapiro-Wilk normality test, CTL p = 0.245, AD p = 0.518; Fig. 6i5), whereas no significant difference was observed in PLIN2⁺PKM2⁻Iba1⁺ proportions between groups (p = 0.986; Shapiro-Wilk normality test, CTL p = 0.845, AD p = 0.404; Fig. 6i6). These results clearly suggest that increased phagocytic exhaustion in AD brains specifically related to the glycolytic state of microglia.
Further analysis within defined periplaque regions (within 50 μm of p-Tau and Aβ aggregates) showed consistent patterns: AD brains exhibited significantly decreased proportions of active phagocytic (CD68⁺Iba1⁺) microglia and significantly increased proportions of phagocytically exhausted (PLIN2⁺Iba1⁺) microglia compared to CTL around both Aβ (Fig. 6k1 & 6k4) and p-Tau aggregates (Fig. 6j1 & 6j4; ps < 0.001, Shapiro-Wilk normality test p > 0.05). Notably, glycolytic (PKM2⁺Iba1+) microglia specifically showed a pronounced increase in phagocytic exhaustion (PLIN2⁺PKM2⁺Iba1⁺, ps < 0.001, Shapiro-Wilk normality test p > 0.05; Fig. 6j5 & 6k5) but no significant difference in active phagocytosis (CD68+PKM2⁺Iba1+) in AD versus CTL (ps > 0.05, Shapiro-Wilk normality test p > 0.05; Fig. 6j2 & 6k2). In contrast, non-glycolytic (PKM2⁻Iba1+) microglia showed significantly decreased active phagocytosis (CD68+PKM2–Iba1+) around pathological aggregates (ps < 0.001, Shapiro-Wilk normality test p ≥ 0.05; Fig. 6j3 & 6k3), but no significant different in phagocytic exhaustion (PLIN2+PKM2–Iba1+) in AD compared to CTL (ps > 0.001, Shapiro-Wilk normality test > 0.05; Fig. 6j6 & 6k6). These results reinforced the conclusion that impaired phagocytosis in AD pathology is broadly related to microglial changes rather than specifically confined to PKM2⁺Iba1+ cells.
Collectively, these results indicate significant overall impairment in microglial phagocytic function and increased phagocytic exhaustion in AD brains. Critically, glycolytic microglia (PKM2⁺Iba1+) are specifically associated with increased exhaustion but not with reduced active phagocytosis, suggesting that the glycolytic state of microglia relates specifically to phagocytic exhaustion rather than to active phagocytic capability.
Fig. 6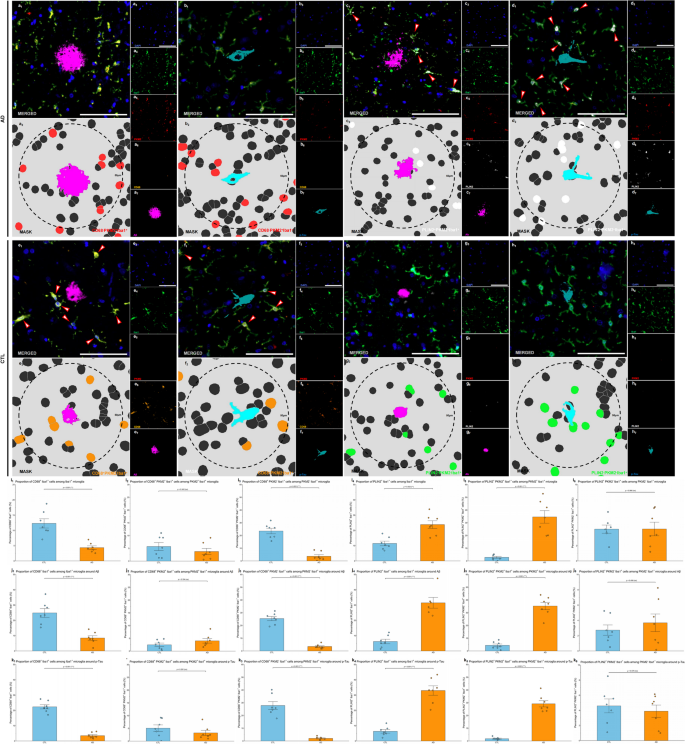
Glycolytic microglia show impaired phagocytic function pattern in AD patients. (a-h) Representative images from human HP‒EC sections showing phagocytic function pattern of PKM2+Iba1+ microglia around Aβ and p-Tau in the AD (a-d) and CTL (e-h) groups. Image a1–h1 depicts the merged mIHC image, with arrows highlighting PLIN2+PKM2+Iba1+ and CD68+PKM2–Iba1+ microglia. Image a2–h2 presents the corresponding mask, with a circle showing 50 μm to Aβ (magenta) and p-Tau (cyan) and highlighting CD68–PKM2+Iba1+ (red), CD68+PKM2–Iba1+ (orange), PLIN2+PKM2+Iba1+ (white), and PLIN2–PKM2–Iba1+ (green) cell masks. Rest images show the single-channel images derived from a1–h1, including DAPI (blue, a3–h3), Iba1 (green, a4–h4), PKM2 (red, a5–h5), CD68 (orange, a6 and b6, e6 and f6), PLIN2 (white, c6 and d6, g6 and h6), Aβ (magenta, a6 and c6, e6 and g6), and p-Tau (cyan, b6 and d6, f6 and h6). Scale bars = 50 μm. (i-k) Quantitive comparison of phagocytic function of microglia in the whole sections (i), around Aβ plaques (j), and around p-Tau aggregates (k) in AD vs. CTL brains. Image i1–k1 compared CD68+Iba1+ cells among Iba1+ microglia. Image i2–k2 compared CD68+PKM2+Iba1+ cells among PKM2+Iba1+ glycolytic microglia. Image i3–k3 compared CD68+PKM2–Iba1+ cells among PKM2–Iba1+ microglia. Image i4–k4 compared PLIN2+Iba1+ cells among Iba1+ microglia. Image i5–k5 compared PLIN2+PKM2+Iba1+ cells among PKM2+Iba1+ glycolytic microglia. Image i6–k6 compared PLIN2+PKM2–Iba1+ cells among PKM2–Iba1+ microglia. All the data are presented as the means ± SEMs, and unpaired t tests were performed (**p < 0.01, ***p < 0.001, and ns: no significant difference)