
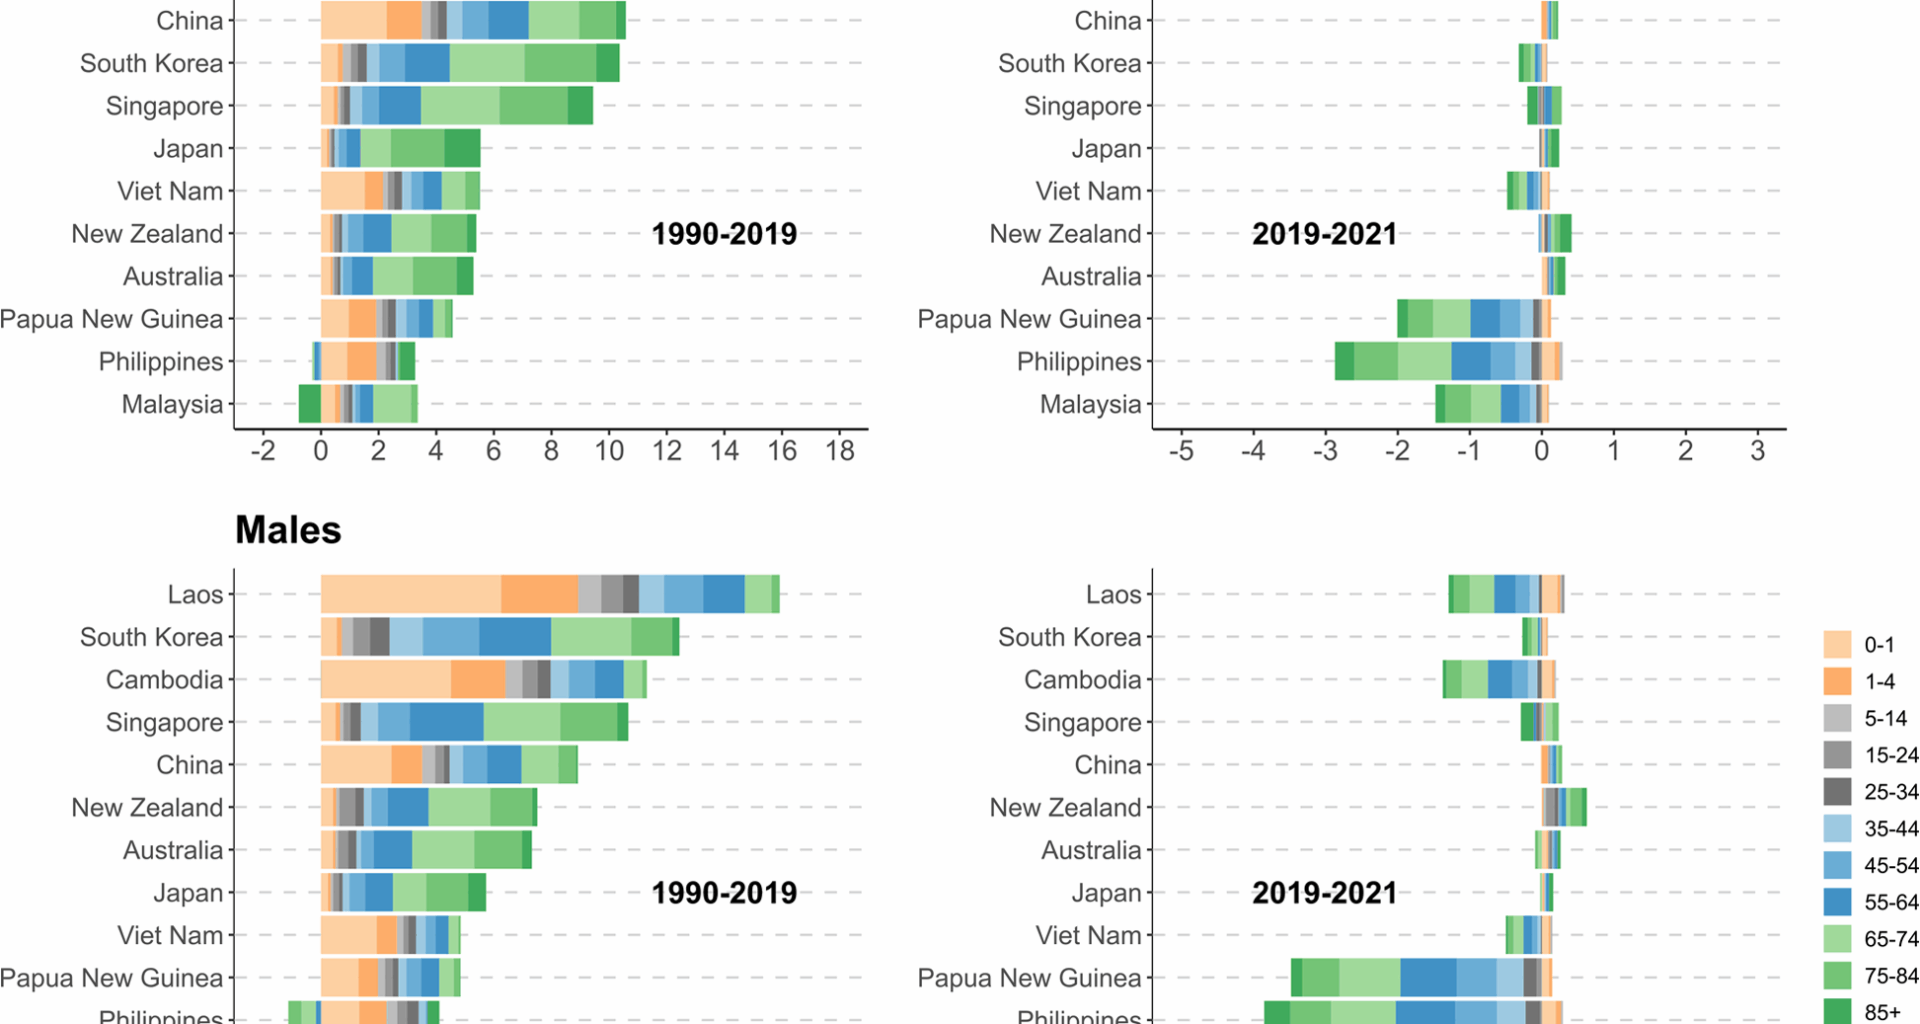
Country-specific trends in life expectancy
Between 1990 and 2019, life expectancy improved for all observed countries in the WPR (Table 1). Among lower-middle-income countries, Laos underwent the most substantial gains in life expectancy for both sexes (16.3 years among females and 15.8 years among males), followed by Cambodia (12.1 years and 11.2 years, respectively), while the Philippines experienced the smallest increases (2.9 years among females and 3 years among males). For upper-middle-income countries, China presented much greater increases in both females (10.6 years) and males (8.9 years) when compared with Malaysia (2.6 years and 2.9 years, respectively). Among high-income countries, the largest gains in life expectancy were observed for females (10.3 years) and males (12.4 years) in South Korea, followed by Singapore (9.4 years among females and 10.6 years among males).
Table 1 Life expectancy at birth in selected countries in the Western Pacific Region from 1990 to 2021
In 2019–2021, middle-income countries experienced different magnitude of declines in life expectancy, except China. The Philippines experienced the most substantial reductions for both sexes (−2.5 years for females and − 3.6 years for males), followed by Papua New Guinea (−1.8 years and − 3.2 years, respectively) and Malaysia (−1.4 years and − 2.4 years, respectively). Among high-income countries, life expectancy continued increasing in Australia, Japan, and New Zealand. However, life expectancy almost stagnated in Singapore and even declined slightly in South Korea among both sexes.
Overall, the variation in life expectancy between countries in the Region declined almost steadily since the 1990s for both females and males (Figure S1). However, after 2019, the variation in life expectancy between WPR countries increased markedly, surpassing even its 1990 level for males.
Age decomposition of changes in life expectancy
Figure 1 presents the age-specific contributions to changes in life expectancy for the observed countries over the study period. In 1990–2019, the increases in both female and male life expectancy among lower-middle-income countries were explained by reductions in mortality in most age groups, particularly among children under 5 years. In China, apart from under-5 age group, the declines in mortality among middle-aged adults and the elderly also played an important role in improving life expectancy for both sexes. In high-income countries, the reductions in mortality among middle-aged and older adults, and particularly the latter, were the primary drivers of gains in life expectancy. However, it is important to note that the old-age mortality increased in the Philippines (among males aged 65–84 years) and Malaysia (among females aged 85 + years), which negatively affected their life expectancy.
Between 2019 and 2021, despite the continued decline in infant mortality rate, adult and old-age mortality increased substantially, resulting in different magnitude of declines in both female and male life expectancy in lower-middle-income countries (e.g., Papua New Guinea and the Philippines) as well as upper-middle-income countries (e.g., Malaysia). In China and some high-income countries, for instance, New Zealand, the growth in life expectancy continued, which was largely attributable to consistent reductions in mortality among the elderly. In contrast, a reverse trend in old-age mortality was observed in South Korea, which was the major reason for its decline in life expectancy. In Singapore, as the negative impact of the rising mortality among people aged 85 + was offset by the declining mortality in other old age groups, its life expectancy did not have detectable change.
Fig. 1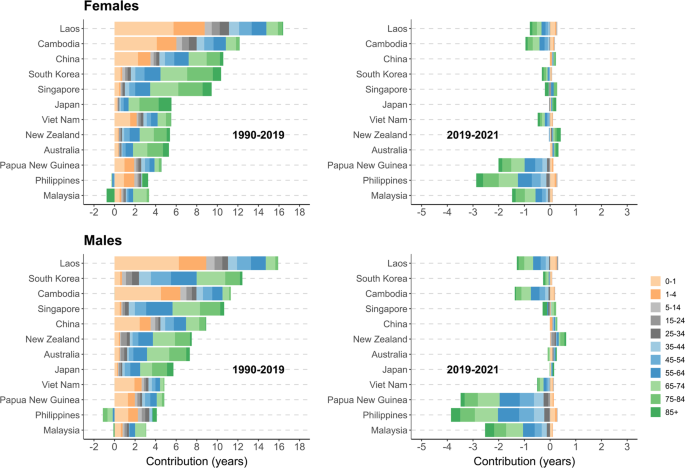
Contributions of different age groups to changes in life expectancy for observed countries in the Western Pacific Region, 1990–2021. Note. Countries are ordered by the magnitude of gains in life expectancy between 1990 and 2019, separately for females and males
Cause-of-death decomposition of changes in life expectancy
Between 1990 and 2019, in lower-middle-income countries, the observed increases in both female and male life expectancy were driven by the reductions in mortality from CMNN and cardiovascular diseases (Fig. 2). In China, in addition to aforementioned causes, the declines in mortality from chronic respiratory diseases and neoplasms also made important contributions to the gains in life expectancy among both sexes. In Malaysia, the increases in both female and male life expectancy were mainly due to the reductions in mortality from cardiovascular diseases. In observed high-income countries, the increases in life expectancy were largely attributable to reductions in mortality from cardiovascular diseases and neoplasms. Reductions in mortality from other causes, such as chronic respiratory diseases, respiratory infections and tuberculosis, and digestive diseases were also important for the increases in life expectancy in some high-income countries (e.g., South Korea). In addition, transport and unintentional injuries contributed positively to gains in life expectancy in the region, which could be more obviously seen among males.
Fig. 2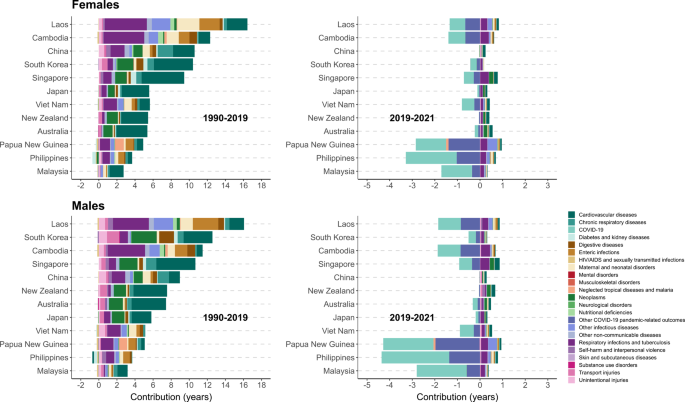
Contributions of major causes of death to changes in life expectancy for observed countries in the Western Pacific Region, 1990–2021. Note. Countries are ordered by the magnitude of gains in life expectancy between 1990 and 2019, separately for females and males
In 2019–2021, the substantial increases in mortality from COVID-19 and other related outcomes of the pandemic led to reductions in life expectancy among all observed lower-middle-income countries and Malaysia. This negative impact was more substantially seen in Papua New Guinea and the Philippines, particularly among males. In China and some high-income countries such as Japan and New Zealand, the negative impact of the pandemic was minor and was offset by the positive impact associated with the declines in mortality from other causes, for example, cardiovascular diseases. However, in Singapore and South Korea, the negative contributions of the rising mortality from the COVID-19 and the pandemic related diseases were much greater, which was the main reason for the stagnation and even decline in life expectancy.
Age-cause-specific decomposition of changes in life expectancy
Figure 3a-d illustrates the contributions of different age groups and major causes of death to changes in life expectancy, by sex over the observation period. From 1990 to 2019, in lower-middle-income countries such as Cambodia and Laos, the gains in life expectancy could be mainly explained by reductions in under-5, 5–24, 25–44 mortality from CMNN , as well as reductions in mortality from communicable diseases and cardiovascular diseases at 45–84 years. In China, in addition to the reductions in under-5 mortality from communicable diseases and maternal-neonatal disorders, the reductions in mortality from NCDs, including cardiovascular diseases, chronic respiratory diseases, and neoplasms in the 45–84 age groups also made substantial contributions to the gains in life expectancy. In Malaysia, the gain in life expectancy was mainly attributed to the decline in mortality from cardiovascular diseases in the 45–84 age groups, although this positive contribution was partly offset by the rising mortality from cardiovascular diseases and communicable diseases at advanced ages among females. In high-income countries, declines in middle and old-age mortality from cardiovascular diseases and neoplasms were mainly responsible for the improvement in life expectancy. Meanwhile, the reductions in old-age mortality from other causes, including chronic respiratory diseases, respiratory infections and tuberculosis, and digestive diseases also made positive contributions to life expectancy in Japan, Singapore, and South Korea to varying degrees. The declines in mortality from external causes among young people and adults were also important drivers of the increase in male life expectancy among several countries, including China and South Korea.
Fig. 3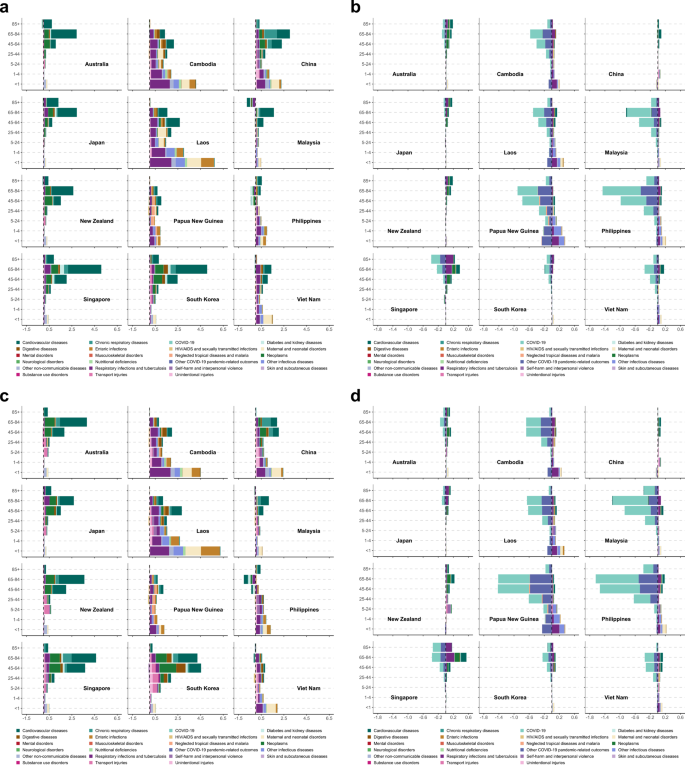
a. Contributions of different age groups and major causes of death to changes in life expectancy for observed countries in the Western Pacific Region, females, 1990-2019. Note. Countries were ordered alphabetically. b. Contributions of different age groups and major causes of death to changes in life expectancy for observed countries in the Western Pacific Region, females, 2019-2021. Note. Countries were ordered alphabetically. c. Contributions of different age groups and major causes of death to changes in life expectancy for observed countries in the Western Pacific Region, males, 1990-2019. Note. Countries were ordered alphabetically. d. Contributions of different age groups and major causes of death to changes in life expectancy for observed countries in the Western Pacific Region, males, 2019-2021. Note. Countries are ordered alphabetically.
Between 2019 and 2021, life expectancy declined notably in observed lower-middle-income countries (e.g., Papua New Guinea and the Philippines) and Malaysia. This was largely attributed to the increases in mortality from COVID-19 and other COVID-19 associated outcomes among adults and the elderly. In China and some high-income countries such as Japan and New Zealand, the impact of the COVID-19 was limited, and continuous declines in old-age mortality from respiratory infections and tuberculosis and NCDs (e.g., cardiovascular diseases) were mainly responsible for their continuous gains in life expectancy. In South Korea, the increases in adult- and old-age mortality from the COVID-19 and the pandemic related diseases were the main reasons for the decline in life expectancy over this period.
Cross-national differences in risk-attributable age-standardized mortality
Figure 4 shows the all-cause age-standardized mortality attributable to Level 1 risk factors among the observed WPR countries over the study period. Between 1990 and 2019, all-cause age-standardized mortality attributable to environmental and occupational risks declined substantially in lower-middle-income countries (e.g., Cambodia and Laos) and China, whereas those attributable to metabolic risks declined more conspicuously in high-income countries. The contribution of risk factors to age-standardized mortality rates varied substantially across different causes of death, as shown in Figures S2. For example, between 1990 and 2019, age-standardized mortality from CMNN attributable to unsafe WaSH and child and maternal malnutrition declined obviously in lower-middle-income countries. NCDs-associated age-standardized mortality attributable to risk factors, including air pollution and dietary risk declined in both middle-income (e.g., China and Laos) and high-income countries (e.g., South Korea and Singapore), whereas those related to other risks such as high systolic blood pressure, declined more conspicuously in high-income countries. During the subsequent period, however, no detectable changes have been found in risk-attributable age-standardized mortality.
Fig. 4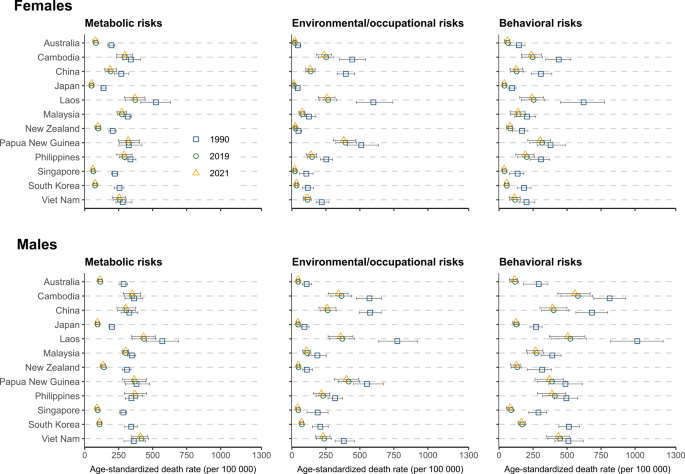
Age-standardized all-cause mortality rates attributable to Level 1 risk factors among selected Western Pacific Region countries for both sexes, 1990, 2019, and 2021