
Derivation of retinal endothelial cells from human induced pluripotent stem cells via the Norrin–Fz4 axis
To obtain RECs from hiPSCs, we first examined factors reported to be crucial in retinal vascular development. Norrin is identified as an essential and specific ligand that binds to Fz4 receptors on ECs to regulate retinal vascular development21. As a result of this pertinent role, vessel leakage was observed in the retinas of Norrin-knock-out mice22. It has also been reported that pericytes secrete vitronectin to induce and maintain REC barrier function during retinal vascular development23. Similarly, RepSox has been shown to enhance barrier function in human retinal microvascular ECs by inhibiting TGFβ–ALK5, and activating the REC-specific Notch and Wnt signalling pathways24. Based on this information, we incorporated these essential elements during EC differentiation and investigated their ability to generate retinal-specific ECs.
WTC-TJP1 hiPSCs were differentiated by mesodermal induction using Essential 6 medium supplemented with the glycogen synthase kinase 3 (GSK3) inhibitor CHIR99021 for 48 h (refs. 25,26). Given the role of ETV2 in endothelial development27, we used a previously established approach to differentiate the mesodermal cells into ECs by introducing chemically modified ETV2 messenger RNA through electroporation28 (Fig. 1a). Following electroporation, the cells were cultured in medium supplemented with VEGF and bFGF for the EC differentiation25,26,28 as well as with Norrin and vitronectin for the pre-iREC specification. To produce non-tissue-specific ECs as a control, referred to as iECs, electroporated cells were cultured in medium supplemented with only VEGF and bFGF25,26 (Supplementary Fig. 1a).
Fig. 1: Derivation of retinal endothelial cells from human induced pluripotent stem cells via the Norrin–Fz4 axis.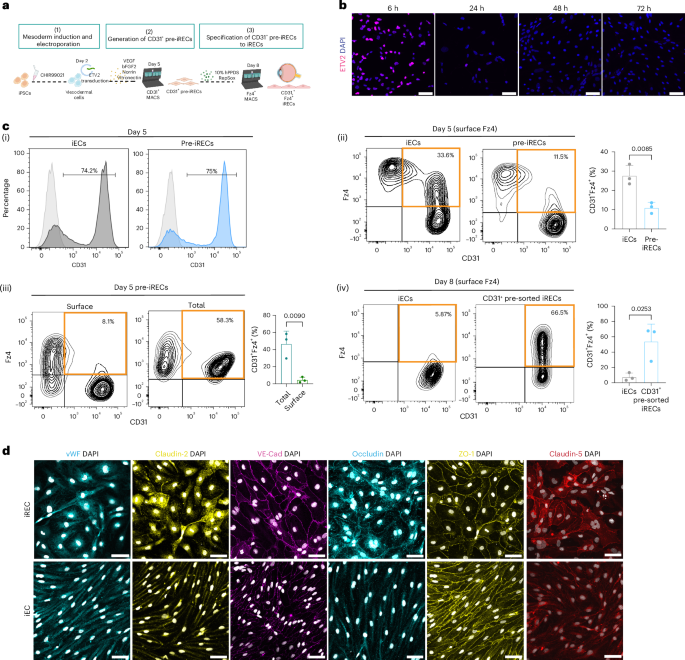
a, Illustration of iREC differentiation. MACS, magnetic-activated cell sorter. hPPDS, human platelet-poor derived serum. b, Time course immunofluorescence staining for ETV2 after electroporation. The nuclei stained with 4,6-diamidino-2-phenylindole (DAPI). c, Representative flow cytometry analysis of CD31 expression on iECs and pre-iRECs on day five (i), CD31 and Fz4 expression on iECs and pre-iRECs on day five (ii), total and surface CD31 and Fz4 expression on pre-iRECs on day five (iii), and CD31 and surface Fz4 expression on iECs and CD31+ pre-sorted iRECs on day eight (iv). (ii)–(iv) The percentage of CD31+Fz4+ cells, outlined in orange in the flow cytometry plots (left), and corresponding quantification in the different groups are shown (right). All flow cytometry experiments were performed using three independent differentiations (N = 3; n = 1). d, Representative immunofluorescence images of tight junction protein and endothelial cell markers (vWF; Claudin-2; VE-Cad, VE-Cadherin; Occludin; ZO-1, ZO-1–GFP; and Claudin-5) on double-sorted iRECs. The nuclei were stained with DAPI (white). b,d, Scale bars, 50 µm. All graphs represent the mean ± s.d. Two-tailed unpaired Student t-tests were used for statistical analysis. Significance was set at P ≤ 0.05. All immunofluorescence staining experiments were performed once to confirm protein expression. The observation of consistent cell morphology and protein expression in subsequent independent experiments supports the reproducibility of these results. Panel a created in BioRender: Lin, Y. and Esswein, P. https://biorender.com/4naev1o (2026).
The robust but transient activation of ETV2 after electroporation (Fig. 1b and Supplementary Fig. 1b) resulted in efficient endothelial fate. On day five approximately 74% of hiPSCs in both treatment groups expressed CD31 (Fig. 1c(i)). The endothelial cell junction marker ZO-1 emerged in parallel with the decrease in ETV2 expression in pre-iRECs and iECs (Supplementary Fig. 1c). Cytoplasmic and nuclear β-catenin expression was also observed in the pre-iREC group immediately following ETV2 transduction, indicating Wnt–β-catenin signalling activation. Within 48 h following the addition of Norrin and vitronectin to the culture, β-catenin localized to cell–cell junctions, providing further support for activation of the Wnt–β-catenin signalling pathway and its downstream junctional effects fundamental to iBRB development12,21,29 (Supplementary Fig. 1c). Although iECs possessed some cytoplasmic/nuclear β-catenin expression following ETV2 transduction, minimal junctional β-catenin expression was observed (Supplementary Fig. 1c). This demonstrates that Wnt–β-catenin signalling is induced by Norrin and vitronectin, emphasising their importance in deriving retinal-specific ECs.
We next examined the expression of Fz4 given that mouse, rat and human studies have shown its specificity in RECs24,30. However, despite high CD31 expression levels in both groups, we noticed that the addition of Norrin to the culture medium resulted in a decreased CD31+Fz4+ population in the pre-iRECs on day five (Fig. 1c(ii)). As it has been reported that Fz4 undergoes endocytosis following ligand–receptor binding31, we compared surface and total Fz4 expression via flow cytometry analysis. Intriguingly, the Fz4 receptor was endocytosed in approximately 50% of the pre-iRECs (Fig. 1c(iii)), which suggests activation of the Norrin–Fz4 signalling pathway. In contrast, there was no difference in the surface and total Fz4 expression of iECs (Supplementary Fig. 1d), indicating that Fz4 internalization is absent and thus specific to Norrin-treated iRECs.
To confirm the essential roles of Norrin and vitronectin in establishing ECs with a retinal-specific signature, we evaluated their impact during differentiation. As these factors were introduced on days 2–5 of differentiation, corresponding to the critical window for endothelial lineage commitment, gene expression was analysed on day five. The iRECs differentiated in the absence of Norrin and vitronectin had decreased gene expression of the retinal EC markers CLDN2 and FZD4as well as the retinal EC-associated genes CLDN5, CLDN10 and IGF2 compared with the controls. Their expression of CLDN23, a gene implicated in iBRB development and regulation, was also trending towards a decrease relative to the controls (Supplementary Fig. 1e). This underscores the essential contribution of these factors to retinal EC development and maturation.
After confirming the robustness and efficiency of the EC differentiation, we sorted CD31+ cells on day five. CD31+ pre-iRECs were then cultured in medium containing 10% human serum from platelet-poor plasma and RepSox for an additional three days (Fig. 1a). Control CD31+ iECs were cultured in medium supplemented with VEGF and TGF-β inhibitor, as previously reported25,26,32. Flow cytometry analysis was performed on day eight to determine whether Fz4 was still detectable on both EC types. We observed that approximately 66% of the CD31+ pre-sorted iRECs expressed surface Fz4, whereas a minimal proportion of the iECs expressed Fz4 (Fig. 1c(iv)). We further performed quantitative PCR with reverse transcription (RT-qPCR) and functional analyses to compare day-eight iECs and CD31+ pre-sorted iRECs. Although CD31+ pre-sorted iRECs expressed higher levels of TJP1 (coding for ZO-1) and OCLN (coding for Occludin; Supplementary Fig. 1f), the cell transendothelial electrical resistance (TEER) was comparable between these two groups (Supplementary Fig. 1g). As only 66% of the CD31+ pre-sorted iRECs expressed Fz4, we were concerned that a heterogeneous population of iRECs and non-specific iECs was present, impacting the results of the functional analyses and thus limiting the utility of this differentiation pathway.
We performed a second round of sorting on day eight to further enrich the REC phenotype and generate a pure REC population. CD31+ pre-sorted iRECs were sorted for Fz4 to obtain CD31+Fz4+ double-positive ECs (referred to as iRECs; Fig. 1a). Immunofluorescence analysis showed that the EC markers CD31, Ulex europaeus agglutinin I (UEA1), VE-Cadherin, Claudin-5 and vWF were detectable in both iECs and iRECs (Fig. 1d and Supplementary Fig. 2a). Junctional proteins that are commonly found in RECs—ZO-1, Occludin and Claudin-2 (refs. 5,33)—were expressed at high levels at the cell–cell junction of iRECs, whereas Occludin and Claudin-2 were virtually absent in iECs (Fig. 1d). We also examined the expression of EC and cell–cell junction markers in primary human RECs (HRECs; Supplementary Fig. 2a,b). HRECs express EC markers such as CD31, UEA1, vWF and VE-Cadherin but not Claudin-5. Cell–cell junction markers—including Occludin, Claudin-2 and ZO-1—are virtually undetectable in HRECs. This may be due to the tendency of primary cells to lose their phenotypic characteristics when removed from their original microenvironment. As a result, iRECs were compared and evaluated against iECs rather than HRECs. We also demonstrated that iRECs derived from the C1-2 hiPSC line34 possessed essential canonical EC and REC-specific markers after undergoing the same iREC differentiation protocol (Supplementary Fig. 2c), emphasising the robustness and utility of the approach. To confirm the EC phenotype of the iRECs, we investigated their ability to uptake Dil-acetylated low-density lipoprotein (LDL) and respond to tumour necrosis factor (TNF). By exposing the iRECs to Dil-acetylated LDL, we demonstrated their ability to actively uptake and internalize this molecule (Supplementary Fig. 2d). The iRECs also responded to TNF treatment by increasing their ICAM-1 expression relative to the controls (Supplementary Fig. 2e). This validated that iRECs possess characteristics of mature and functional ECs.
To confirm the barrier maturation role of RepSox and its importance to the derivation of retinal-specific ECs, we performed TEER and permeability assays on iRECs cultured with and without RepSox. The iRECs cultured without RepSox displayed decreased TEER values and thus impaired barrier functionality across the four days (Supplementary Fig. 3a(i)). We specifically found that the iRECs supplemented with RepSox contained increased barrier properties on days two, three and four (Supplementary Fig. 3a(ii)). Similarly, RepSox treatment decreased the permeability of iRECs compared with the group without RepSox (Supplementary Fig. 3b). These results confirm that RepSox enhances barrier maturation and is an essential component to the derivation of functional iRECs.
Finally, to determine the longevity of iRECs, we examined cellular senescence in passaged iRECs. Utilizing western blots, we observed the emergence of the cyclin-dependent kinase inhibitors p21 and p16 (indicative of senescence-dependent cell-cycle arrest) beginning at passage three (Supplementary Fig. 4a). To corroborate this, we compared the nuclear area of iRECs at passage one and two and found no significant difference (Supplementary Fig. 4b). These results suggest that iRECs possess high biological utility at early passages; therefore, all experiments were conducted using passage one and two cells.
After establishing the efficacy of the iREC differentiation protocol, we investigated its translation to alternative EC differentiation methods. To this end we supplemented the well-established small-molecule differentiation strategy26,32 with Norrin, vitronectin and RepSox. Although this approach generated ECs expressing canonical EC, junctional and functional retinal markers (Supplementary Fig. 5a), the efficiency and yield of CD31+ cells was significantly lower than the ETV2-based method (19.2% versus 73.9%; Supplementary Fig. 5b). The CD31+Fz4+ population was also reduced (21.8% versus 59.6%; Supplementary Fig. 5c). Although the modified small-molecule differentiation strategy generated iRECs, its low efficiency motivated us to harness the ETV2 electroporation protocol for all experiments to ensure robust and reproducible iREC production.
Together, these results confirm that we can generate RECs from hiPSCs by activating the Wnt–β-catenin molecular signalling pathway via the addition of Norrin and vitronectin. The maturation of iRECs is further enhanced by incorporating the TGFβ–ALK5 inhibitor and Notch and Wnt signalling activator (RepSox) into the differentiation scheme.
iRECs recapitulate functional and network features of healthy and diabetic retinopathy iBRBs
Next, we investigated whether iRECs possessed functional characteristics that are fundamental to RECs found in vivo—that is, high barrier functionality, transcellular transport and the ability to form vascular networks. We observed higher TEER in the iRECs relative to the iECs across the four days (Fig. 2a), indicating enhanced barrier properties. We specifically identified that the iRECs possess increased barrier properties compared with the iECs on days three and four (Supplementary Fig. 6a), suggesting a physiologically relevant maturation of iREC barrier integrity over time. This validates that the iRECs contain high barrier functionality consistent with the iBRB, indicating their biological fidelity and utility. In addition, an analysis of variance (ANOVA) revealed a significant statistical interaction between cell type and day (Supplementary Fig. 6a(ii)), confirming a difference in iREC barrier properties between day four and day one compared with iECs. This further demonstrates that the iRECs increase their barrier properties over time relative to the iECs. The iRECs also possessed decreased permeability compared with iECs (Supplementary Fig. 6b), corroborating their functional fidelity.
Fig. 2: iRECs exhibit functionality and network properties typical of both healthy and diabetic retinopathy iBRB.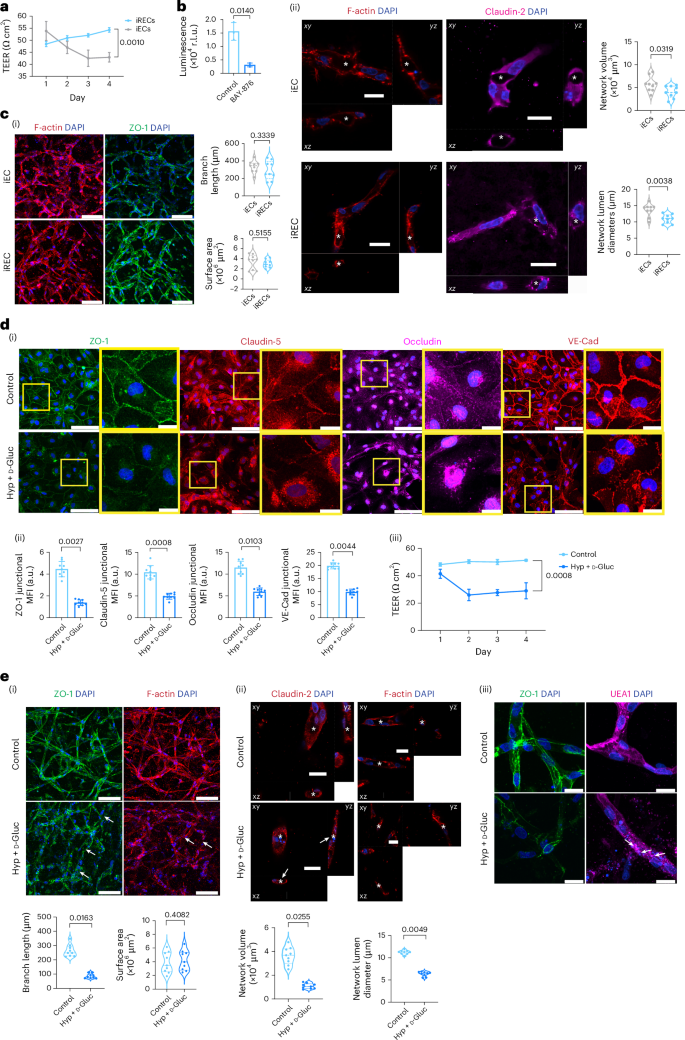
a, TEER measurements of iECs and iRECs. b, GLUT1 uptake assay for iRECs treated with or without GLUT1 inhibitor. c(i), Immunofluorescence images of 3D iEC and iREC vascular networks (left), and their branch lengths and surface areas (right). (ii) Cross-sectional views of 3D iEC and iREC vascular networks depicting their lumina (asterisks; left), and the vascular network volumes and lumen diameters (right). d, Immunofluorescence images of junctional protein markers (i), the corresponding mean fluorescence intensity at the cell–cell junctions (ii) and TEER measurements (iii) of iRECs in control or DR conditions (hypoxia + D-glucose). Magnified views are outlined in yellow. e(i), Immunofluorescence images of 3D iREC vascular networks with or without diabetic treatment (top), and their branch lengths and surface areas (bottom). (ii) Cross-sectional views of 3D iREC vascular networks with or without diabetic treatment (top), and their network volume and lumen diameter (bottom). (iii) Immunofluorescence images of 3D iREC vascular networks with or without diabetic treatment. Arrows point to examples of disrupted vasculature (disconnected lumens), lumina are labelled with asterisks and arrows highlight granular objects present within the UEA1 stain. c–e, Representative images are shown. Scale bars, 100 µm (c(i), main images in d(i), e(i)) and 20 µm (c(ii), magnified views in d(i), e(ii),(iii)). a,b,d(ii),(iii),e(i),(ii), N = 3, n = 3. All immunofluorescent staining experiments were performed with three independent biological replicates to accurately quantify the associated fluorescence expression and morphology, and ensure reproducibility. All graphs represent the mean ± s.d. For the TEER assays, we utilized a two-factor repeated measures ANOVA to compare cell types. Two-tailed unpaired Student t-tests were performed for all other statistical comparisons. Significance was set at P ≤ 0.05; r.l.u., relative light units; a.u., arbitrary units; Hyp + D-Gluc, hypoxia + D-glucose; MFI, mean fluorescence intensity; ZO-1, ZO-1–GFP.
As a consequence of the highly selective permeability of the iBRB, RECs utilize transcellular transport as the primary mechanism for delivering and removing molecules from the brain and retinal parenchyma5, making this a key functionality that RECs must possess. Glucose transporter 1 (GLUT1) and the p-glycoprotein (p-gp) efflux transporter play crucial roles in the retina. The GLUT1 transporter is the main facilitator of glucose transport, which may have considerable implications for DR35 and is critical to meeting the energy demand in the retina3,36, whereas the p-gp transporter effectively clears harmful substances, such as drugs, contributing to retinal health37. When treated with glucose, iRECs exhibited a fivefold higher baseline glucose uptake level (1.5 × 10⁴ versus 3 × 10³ relative light units, r.l.u.) than iECs (Fig. 2b and Supplementary Fig. 6c(i)). When the iRECs were treated with the highly selective GLUT1 inhibitor Bay-876, glucose uptake in iRECs was attenuated by 80%, whereas uptake by iECs was reduced by only 60% (Supplementary Fig. 6c(ii)). These results suggest that iRECs contain increased GLUT1 function, providing support for their retinal specificity and thus REC model efficacy. To evaluate p-gp activity, we treated iRECs with the p-gp inhibitor Tariquidar. In the presence of the inhibitor, the iRECs exhibited increased intracellular accumulation of the p-gp substrate rhodamine 123 as they were unable to bind and efflux the molecule, correlating to a higher fluorescent signal detected in the treated condition (Supplementary Fig. 6d(i)). In contrast, iECs did not increase their intracellular rhodamine 123 when exposed to Tariquidar, which resulted in a significant increase in iREC p-gp functionality and activity compared with iECs (Supplementary Fig. 6d(ii),(iii)). This suggests that iECs contain a dysfunctional, or unresponsive p-gp pump. As functional p-gp efflux pumps are primarily expressed by ECs within the central nervous system and tumour microenvironments37,38,39,40, p-gp efflux activity supports the retinal specificity of iRECs (Supplementary Fig. 6d(iii)). Together, these results demonstrate that the iRECs possess functional barrier and transporter activity.
The capability of ECs to form vascular networks with lumens is an essential aspect of their physiological properties and is thus a characteristic requirement for iRECs. In three-dimensional (3D) collagen type I hydrogels, iRECs robustly formed capillary-like structures. Although their vascular branch length and surface area were comparable to iECs, they had smaller average network volumes and narrower lumen diameters relative to iECs (Fig. 2c(i),(ii)), consistent with values reported in humans41,42. The iREC capillary-like networks also expressed key canonical endothelial cell and junctional protein markers. Specifically, the iREC networks contained heightened expression of membrane-bound ZO-1, Claudin-2, Claudin-5 and β-catenin protein relative to iEC networks, with expression differences apparent at cell–cell contacts (Supplementary Fig. 7a). This upregulation of junctional proteins validates the iBRB specificity and phenotype of iREC networks and corroborates their enhanced barrier properties. In contrast, the protein expression patterns of canonical EC markers—CD31, VE-Cadherin and UEA1—as well as F-actin were similar between the iREC and iEC networks (Supplementary Fig. 7b), validating the endothelial identity of iRECs. Cross-sectional imaging showed the presence of physiological lumina within iREC networks that were adhered together at cell–cell contacts via the Claudin-2 junctional protein (Fig 2c(ii)). Significantly lower Claudin-2 expression at junctions was observed for the iEC networks (Fig. 2c(ii) and Supplementary Fig. 7a). Together, these data confirm the accuracy, specificity and efficacy of the iREC differentiation and the robustness of our models, critical features that will enable accurate and translatable REC-focused research.
In proliferative DR, hypoxia and hyperglycaemia have been implicated as causative factors, inducing microvascular degeneration that coincides with decreased EC barrier function and disrupted cell–cell junctions5,14,15,43,44. To recapitulate microvascular changes in DR, we exposed iRECs and iECs to a high concentration of D-glucose (30 mM) in hypoxia (1% O2). We first utilized flow cytometry to assess cell viability under these conditions and observed comparable viability in the control and DR-treated iECs and iRECs (Supplementary Fig. 8a). This confirms that phenotypic and functional alterations across conditions are a consequence of DR rather than differences in cell survival. Following incubation for 24 h in DR conditions, the tight junction proteins ZO-1, Claudin-5 and Occludin as well as the adherens junction protein VE-Cadherin, displayed decreased localization at iREC cell–cell contacts (Fig. 2d(i),(ii)). Interestingly, Claudin-2 junctional expression did not seem to change, suggesting that Claudin-2 is not impacted in DR (Supplementary Fig. 8b). Similarly, iREC expression of the EC markers CD31 and UEA1 seemed to be consistent between culture conditions (Supplementary Fig. 8b). RT-qPCR analyses revealed no differences in the expression levels of CLDN5 (coding for Claudin-5), OCLN and TJP1 (Supplementary Fig. 8c). This observation emphasises that the initial response to diabetic conditions involves protein re-localization rather than alterations in gene expression. On the contrary, iECs exposed to a 24-h DR treatment displayed a decrease in Claudin-5 localization at cell–cell contacts but no differences in the levels of ZO-1 and VE-Cadherin protein expression between the DR and control conditions were noted (Supplementary Fig. 8d). This limited junctional response of iECs to DR stimuli highlights the importance of using retinal-specific ECs to accurately model DR clinical presentations.
To evaluate the influence of DR on barrier properties, the TEER of iRECs and iECs was examined following a 72-h exposure to DR conditions. We observed that the diabetic-treated iRECs contained significantly lower TEER levels compared with the control group (Fig. 2d(iii)). We specifically identified that the DR conditions decreased TEER on days two, three and four relative to the controls (Supplementary Fig. 8e). This demonstrates a sustained reduction in iREC barrier functionality, consistent with the clinical presentation of DR. Although iECs also displayed an overall decrease in TEER values under DR conditions, no significant differences were observed at individual time points (Supplementary Fig. 8f). Importantly, the magnitude of the TEER reduction across conditions was greater in iRECs than iECs (Supplementary Fig. 8g). These findings indicate that iRECs display a greater ability to respond to DR triggers and accurately recapitulate clinical features of DR relative to iECs, providing support for their use for modelling and studying DR instead of non-tissue-specific ECs.
Next, we investigated how iREC vascular networks respond to DR conditions. We found that although the retinal vascular networks exposed to DR conditions did not display a difference in vascular surface area, they had much smaller branch lengths, network volumes and lumen diameters (Fig. 2e(i),(ii)). The consistency in surface area across conditions may be due to the proliferative DR phenotype compensating for area, with an increase in smaller, pathological vasculature. ZO-1 and F-actin stains displayed disconnected networks and cross-sections depicted discontinued and aberrant lumina in cells subjected to diabetic conditions (Fig. 2e(i),(ii)). Furthermore, after DR treatment, ZO-1, CD31, VE-Cadherin, Claudin-5 and β-catenin junctional protein expression decreased at cell–cell contacts (Fig. 2e(ii) and Supplementary Fig. 9a), suggesting a loss in barrier functionality within the iREC networks. Corroborating our two-dimensional (2D) findings and previous in vivo results33, Claudin-2 protein expression remained unchanged (Supplementary Fig. 9a(ii),(iii)). As CD31 expression in the DR and control conditions seemed consistent in 2D (Supplementary Fig. 8b), its decrease in the hydrogels emphasises the value of 3D models for capturing disease-relevant vascular remodelling. Interestingly, under DR conditions, UEA1 granular objects appeared in the 3D vascular networks (Fig. 2e(iii)), suggesting glycocalyx degradation that has been previously reported in patients with diabetes45,46. In contrast, iEC networks exposed to DR conditions possessed branch lengths, surface areas and network volumes consistent with the control groups, and the lumen diameters marginally, but not significantly, decreased compared with the control networks (Supplementary Fig. 9b). Similarly, although a trend towards a decrease in CD31, VE-Cadherin, Claudin-5, β-catenin and ZO-1 protein expression was observed for these DR iEC networks, the reduction was not statistically significant (Supplementary Fig. 9c). These results highlight the increased sensitivity and responsiveness of iRECs to DR-associated stress compared with iECs, reflecting the retinal identity and functionality of the iRECs that enables them to properly model DR.
In summary, we demonstrate that iRECs possess the functional characteristics of RECs with biologically relevant responsiveness to changes in glucose and oxygen. As a result, they contain the properties to serve as a reliable and robust source for cell-based therapeutics and in vitro disease modelling platforms, and display the importance of utilizing tissue-specific cells for disease modelling.
Transcriptomic analysis of iRECs reveals their distinct recapitulation of the REC genotype
To elucidate the transcriptional profile of iRECs, we performed a bulk RNA-sequencing (RNA-Seq) analysis three days after Fz4 sorting (that is, CD31+Fz4+ cells). We used iECs (that is, CD31+ cells) to assess the tissue-specific traits of iRECs. Principal component analysis of differentially expressed genes showed that the iRECs and iECs cluster distinctly apart from each other as there was only transcriptional similarity across biological replicates within a phenotypic condition (Fig. 3a). This result was further confirmed by correlation analysis (Supplementary Fig. 10a) and a heat map of hierarchical clustering analysis of differentially expressed genes based on enriched Gene Ontology (GO) categories (Fig. 3b), indicating genetic differences between iRECs and iECs.
Fig. 3: Transcriptomic analysis of iRECs reveals their distinct recapitulation of the REC genotype.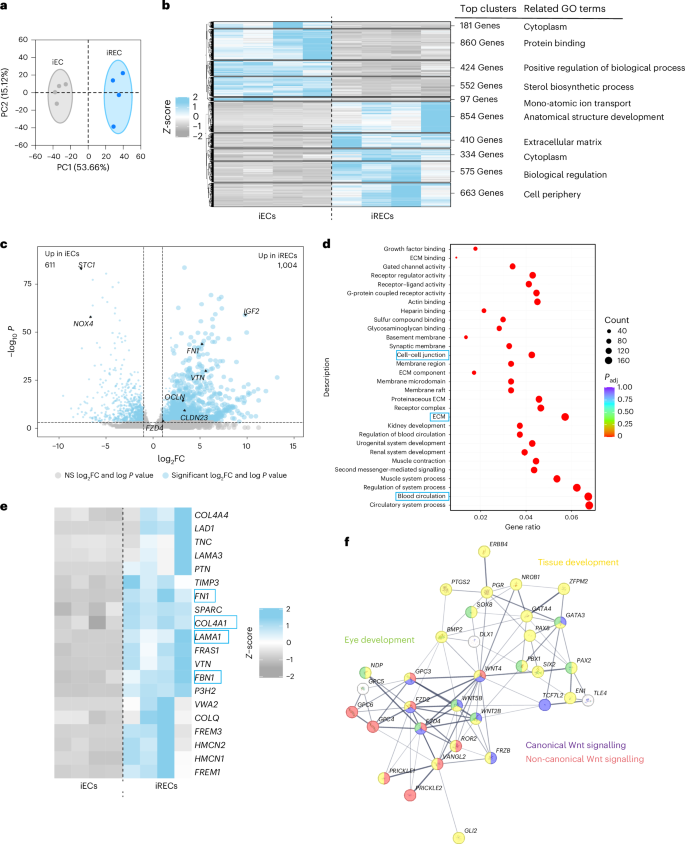
RNA-Seq data analyses of iECs and iRECs (four biological replicates; independent differentiation). a, Principal component (PC) analysis. b, Heat map analysis of differential gene expression (FC > 2). c, Differentially expressed genes (FC > 2). d, Gene Ontology analysis (total enrichment). e, Heat map analysis of basement membrane-related genes (FC > 2). f, Network analysis of Wnt signalling pathways involved in the generation of iRECs. d,e, The enriched GO pathways and genes represent critical components of REP development and barrier formation are highlighted in blue. P values were calculated using two-tailed unpaired Student t-tests (volcano plots) or a statistical model (GO analysis) and adjusted for multiple testing using the Benjamini–Hochberg false-discovery rate method. NS, not significant; FC, fold change; Padj, adjusted P.
Focusing on known gene differences, we confirmed that iECs and iRECs shared 11,238 genes, whereas 1,476 genes were distinctly expressed in iRECs (Supplementary Fig. 10b). Compared with iECs, 1,004 differentially expressed genes were significantly upregulated in iRECs, including those closely associated with REC function, such as FZD4 (log2(fold change, FC) = 1.15), IGF2 (log2FC = 9.8), CLDN10 (log2FC = 6.54), CLDN23 (log2FC = 3.32), VTN (log2FC = 5.71) and FN1 (log2FC = 5.29; Fig. 3c). To further understand the transcriptional difference between iECs and iRECs, we performed a detailed GO enrichment analysis (Fig. 3d). Significant enrichment of genes associated with extracellular matrix (ECM), blood circulation and cell–cell junction was found in iRECs compared with iECs, suggesting that the processes related to cell remodelling, cellular adhesion and endothelial cell function are prominently activated in iRECs compared with iECs.
From the enriched GO categories, we then selected the top 20 most differentially expressed genes contributing to the enhancement of iREC phenotypes to highlight in heat maps. We generated heat maps to examine differential gene expression associated with the basement membrane and cell–cell junctions (Fig. 3e and Supplementary Fig. 11a). Notably, basement membrane components—COL4A1 (coding for collagen IV), FN1 (coding for fibronectin), LAMA1 (coding for Laminin-1) and FBN1 (coding for Fibrillin-1)—were upregulated in iRECs. Among the cell–cell junction proteins, OCLN, CDH6 (coding for Cadherin-6) and CLDN23 (coding for Claudin-23) were highly expressed in iRECs compared with iECs. These genes are involved in REC development and barrier formation15,33,47,48,49, corroborating the genotypic characteristics and phenotypic integrity of the iRECs.
Given that the Wnt pathway is a key contributor to REC development and iBRB formation49,50, we investigated its role in the generation of iRECs. Dysregulation of Wnt signalling has been associated with retinal diseases such as familial exudative vitreoretinopathy and Norrie disease51. Therefore, Wnt activation is essential for REC and retinal health, and this characteristic must be exhibited by iRECs. We generated heat maps to highlight differential gene expression associated with the Wnt signalling pathways (Supplementary Fig. 11b). The major Wnt signalling pathway components FZD4 (coding for Fz4), LRP5 (coding for low-density lipoprotein receptor-replated protein 5) and APCDD1 (coding for APC down-regulated 1) were upregulated in iRECs compared with iECs.
To further evaluate the genomic fidelity of the iRECs, we benchmarked iRECs against published RNA-Seq data of HRECs52, focusing on all of the genes that were differentially expressed in iRECs relative to iECs. Similar expression patterns of basement membrane components (FN1 and FBN1), cell–cell junction genes (OCLN) and Wnt signalling-associated genes (WNT3) were observed for both iRECs and HRECs (Supplementary Fig. 12a). To investigate and validate this retinal specificity, RT-qPCR analyses were performed. Importantly, we found that gene expression of the retinal marker CLDN2 (coding for Claudin-2) and MDR1 (encoding the central nervous system-specific p-gp efflux pump)37,40,53,54 was consistent between HRECs and iRECs (Supplementary Fig. 12b). Together, iRECs contain a physiologically relevant retinal signature consistent with HRECs.
Network analyses revealed the involvement and increased expression of both canonical and non-canonical Wnt signalling pathways, including WNT4, WNT5B and WNT2B (WNT13), in iRECs compared with iECs (Fig. 3f). Notably, FZD4, LRP5 and NDP (coding for Norrin) have been implicated in REC differentiation and iBRB formation29. VANGL2 (coding for VANGL planar cell polarity protein 2) and TCF7L2 (coding for Transcription factor 7 like 2) control cell-fate decisions during REC development55,56. Wnt2b (Wnt13) interactions with both Wnt4 and Wnt5b are involved in vascular formation and vasculogenesis51,57. Although the direct relation of WNT2B (WNT13) with retinal cell differentiation is not well-studied, its involvement in the canonical Wnt pathway in modulating peripheral fate of the chick eye suggests it could indirectly influence EC development and iBRB formation in the retina58, verifying its activation in iRECs and thus their robustness.
Given that both brain ECs and RECs originate from the central nervous system, it is reasonable to speculate that they may share similar genotypes due to their analogous function. To elucidate this assumption, we conducted a comparative analysis of published RNA-Seq data of iPSC-derived brain ECs59 with our iRECs and iECs. Both correlation and principal component analyses showed that all cell types cluster distinctly from each other and are minimally correlated (Supplementary Fig. 13a,b). The number of distinctly expressed genes among iRECs, iECs and iPSC-derived brain ECs was also investigated (Supplementary Fig. 13c), revealing EC traits and tissue-specific differences between the groups.
In conclusion, these data highlight the distinct and biologically accurate transcriptome of iRECs, the signalling pivotal to the development of RECs and the iREC’s recapitulation of fundamental and developmental REC markers. This displays the biological fidelity of iRECs, the developmental insight they can provide and the utility they possess.
iRECs revascularize the ischaemic eye
To investigate the therapeutic potential of iRECs in treating DR, we used the OIR mouse model, the most widely used model for studying DR angiogenesis/neovascularization (NV) and the discovery and testing of therapeutics60,61. We have previously demonstrated that iECs derived using the small-molecule approach are able to reduce vaso-obliteration (VO) and NV within the retina of OIR mice32. To confirm that iECs derived using ETV2 electroporation also have this reparative impact, we intravitreally injected ETV2-derived iECs into one eye of the OIR mice and PBS into the contralateral eye as the vehicle control on postnatal day 12 (P12). We then investigated the VO and NV area on P17, as this is when they are at their peak in the OIR model62,63. The retina injected with iECs displayed a decrease in VO and NV compared with the PBS-injected retina (Supplementary Fig. 14a), aligning with our previously published work32. After confirming the therapeutic potential of ETV2-derived ECs, we sought to examine whether implantation of iRECs could revascularize the ischaemic eye and thus regenerate and repair the tissue. To do this, we performed iREC and PBS intravitreal injections64 on P12 and quantified the VO and NV area on P17. Both the VO and NV areas were significantly reduced in the treated eye compared with the contralateral eye injected with PBS (Fig. 4a,b), demonstrating the reparative and therapeutic impact of the iRECs.
Fig. 4: iRECs revascularize the ischaemic eye.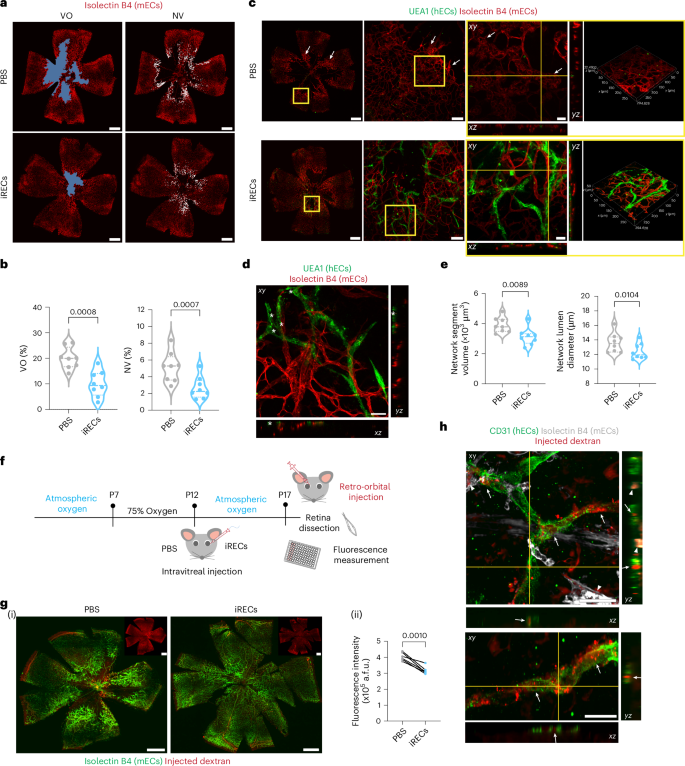
a, Representative immunofluorescence images of the retinal tissue of OIR mice at P17, five days after intravitreal injection of PBS or iRECs. The VO and NV areas are shown in blue and white, respectively. Scale bars, 500 µm. b, Percentage of VO and NV areas in mouse retinal tissue at P17 (n = 8). c, Representative localized immunofluorescence images of whole-mount retina (left), cross-sections of the retinal tissue (middle; magnified view of the yellow boxed regions) and 3D reconstructions (right) of vascular regions of OIR mice retina at P17 following PBS (top) or iREC (bottom) injections. Arrows depict pathological neovascular tufts and yellow crosshairs demonstrate the location of the xz and yz planes. Scale bars, 500 µm (left), 100 µm (middle). d, Representative cross-sectional immunofluorescence image of lumenized iREC vascular networks integrating with the retinal vasculature tissue of OIR mice on P17. Asterisks denote lumens of human–mouse hybrid vasculature. Scale bar, 50 µm. c,d, n = 8 independent biological replicates. e, Vascular network segment volume (left) and lumen diameter (right) of the PBS- and iREC-injected mice; n = 8 for all groups. f, Illustration of the in vivo permeability assay. g, Representative immunofluorescence images of mouse retina injected with rhodamine dextran (i), and the fluorescence intensity of 70 kDa rhodamine dextran extracted from the retinas of OIR mice (ii). One eye received iREC treatment and the contralateral eye received PBS treatment; n = 6 biologically independent mice. Scale bars, 500 µm. h, Representative cross-sectional images of iREC networks perfused by injected 70 kDa rhodamine dextran within OIR retinas (n = 2 independent biological replicates). All immunofluorescence morphology and perfusion staining experiments were performed with eight and two independent biological replicates, respectively, to confirm network morphology, integration and perfusability, and ensure reproducibility. Arrows depict examples of iREC networks and lumina perfused with rhodamine dextran, arrowheads denote examples of native mouse vasculature perfused with rhodamine dextran and yellow crosshairs demonstrate the location of the xz and yz planes. Scale bars, 20 µm. Two-tailed paired Student t-tests were used for statistical analysis. Significance was set at P ≤ 0.05; hECs, human endothelial cells; mECs, mouse endothelial cells; a.f.u., arbitrary fluorescence units.
Having established that iRECs are able to restore vascularization and rescue the ischaemic eye, we next investigated whether they actively participate in this process. To do this, we monitored cell integration with the host on P17 just before healthy native vascular structure regrowth in the OIR retina63,65. We observed that iRECs integrated with the host vasculature. Specifically, we noted that iRECs formed vascular networks in the hypoxic avascular regions of the mouse retina, whereas the control PBS-injected retina contained pathological vasculature with substantial VO and neovascular tufts (Fig. 4c). These networks were lumenized, consisting of human-only and human–mouse hybrid networks, indicating vasculogenesis of the iRECs and their integration with the host vasculature (Fig. 4c,d). The iEC-treated mice displayed similar trends, with the iEC-treated retinas containing iEC networks within their avascular regions and reduced dysfunctional vasculature relative to their PBS-injected retinal counterparts (Supplementary Fig. 14b). To explore the impact of these cellular interactions, we quantified the mouse vascular networks exposed to treatment and control. Although the branch lengths and surface areas did not differ (Supplementary Fig. 14c), the mouse vascular networks of the iREC group had smaller segment volumes and lumen diameters than their control counterparts (Fig. 4e). The smaller networks in the iREC-treatment condition align more closely with healthy murine retinal capillary values66,67, suggesting a decrease in NV and pathological alterations relative to the PBS group. Interestingly, the mouse vascular network segment volume, lumen diameter, branch length and surface area did not differ between the iEC- and PBS-injected retina (Supplementary Fig. 14d). Although iECs reduce the pathological VO and NV area, in contrast to iRECs they do not seem to contribute to restoring physiological network morphology. The capacity of the iRECs to rescue the injured retina and restore physiological vascular network morphology demonstrates the therapeutic benefit of using retinal-specific ECs.
To investigate the functional impact of the iRECs, we treated mice with retro-orbital injections of 70 kDa rhodamine dextran and analysed the retinal permeability on P17 (Fig. 4f), the peak time point for VO and NV62,68. The iREC-treated retinas had significantly reduced permeability compared with the PBS-injected controls (Fig. 4g and Supplementary Fig. 14e), emphasising their functional and reparative capacity. Comparatively, iECs reduced the permeability of the retinas relative to control retinas (Supplementary Fig. 14f), consistent with previously published iPSC-derived EC-based treatments. We also observed the perfusion of 70 kDa rhodamine dextran through CD31-expressing iREC networks alongside perfused mouse vessels and some dextran leakage (Fig. 4h and Supplementary Fig. 14e), confirming their capacity to form mature, perfusable vessels integrated with the host vasculature. This functional integration and perfusability are fundamental to supporting tissue regeneration and highlight the therapeutic potential of iRECs to re-establish iBRB integrity.
Overall, the vasculogenic, angiogenic, integrative and functional capabilities of the iRECs led to the restoration of the ischaemic eye, suggesting that they could be used as a strategy to repair the damaged retina. The iRECs are specifically poised to improve treatment efficacy due to their unique ability to restore physiological mouse network morphology, demonstrating the advantage of using iRECs for cell-based retinal intervention.
iPSC-derived iBRB-on-a-chip
Microphysiological systems (MPS), or organs-on-chips, are downsized, functional in vitro models that faithfully recapitulate human organs, enabling the study of tissue function in health and disease69,70,71,72,73,74,75,76. We thus sought to establish the capacity of iRECs to generate a functional iBRB MPS. We utilized standard polydimethylsiloxane-based one- and three-cell channel microfluidic devices70,77 to develop the MPS. To induce the formation of iREC vascular networks, iRECs encapsulated in a collagen I hydrogel were delivered into the cell-culture channels in the devices and cultured for 3–5 days (Fig. 5a). In the MPS, iRECs self-assembled into robust 3D networks enriched with canonical endothelial cell and membrane-bound adherens and tight junction proteins throughout the networks as well as at cell–cell contacts (Fig. 5b,c and Supplementary Fig. 15a), characteristic of the functional iBRB. These networks possessed vascular branch lengths and surface areas consistent with iEC networks (Supplementary Fig. 15b). Cross-sectional images showed the presence of lumina that recapitulate iBRB morphology and are adhered at cell contacts via the Claudin-2, ZO-1, Claudin-5 and β-catenin junctional proteins (Fig. 5d and Supplementary Fig. 15c(i)). Similarly, iECs formed lumenized vascular networks with adherens and tight junction proteins (Supplementary Fig. 15c(i),(ii)). Notably, iRECs generated networks with volumes and lumen diameters on the capillary scale (Supplementary Fig. 15c(iii)). Consistent with the 3D hydrogels, iREC networks possessed increased ZO-1, Claudin-2 and β-catenin junctional protein expression compared with iEC networks within the MPS (Supplementary Fig. 15d), indicating their barrier integrity and phenotypic accuracy. Functionally, iREC networks were perfusable with 70 kDa rhodamine dextran (Supplementary Fig. 15e) and possessed a significantly lower permeability compared with iEC networks (Fig. 5e). This demonstrates that the iRECs can generate a functional and physiologically accurate iBRB, displaying their biological fidelity and advantage over non-tissue-specific ECs for iBRB modelling.
Fig. 5: iPSC-derived iBRB-on-a-chip.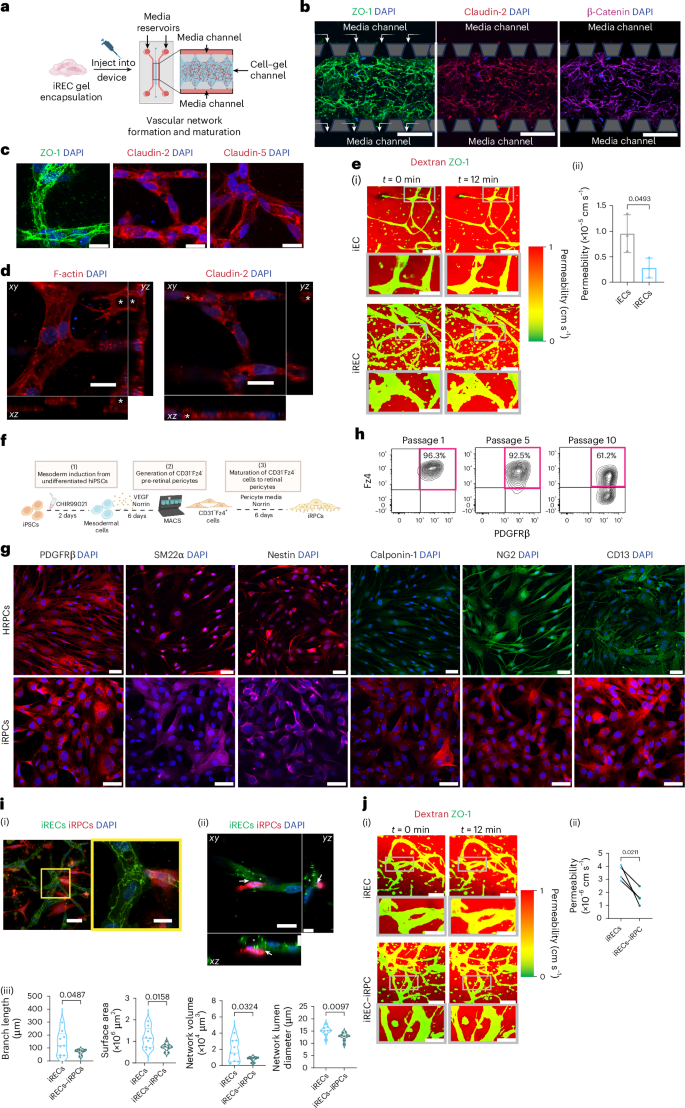
a, Illustration of the development of the iBRB-on-a-chip with iRECs. b, Representative immunofluorescence images of 3D iREC vascular networks within the MPS. Images are overlaid with markings of the channel posts and the location of the media channels. Arrows depict the interstitial flow of media across the cell-gel channel as a result of the induced medium pressure gradient. Scale bars, 500 µm. c, Representative immunofluorescence images of 3D iREC vascular networks. The immunofluorescent staining experiments were performed with three independent biological replicates to accurately quantify the associated fluorescence expression and ensure reproducibility. Scale bars, 20 µm. d, Cross-sectional images of 3D iREC vascular networks within the MPS showing lumenized vessels (asterisks) and expression of the tight junctional protein Claudin-2 at cell–cell contacts. Scale bars, 20 µm. e, Representative immunofluorescence images of the 3D iREC and iEC networks before (left) and after (right) 70 kDa rhodamine dextran injection (i), and the levels of 70 kDa rhodamine dextran permeability into the iEC and iREC networks over time (ii). N = 3 permeability assays performed on cells derived from independent differentiations; n = 1–3 locationally distinct image stacks taken per biological replicate. f, Illustration of iRPC differentiation. g, Representative immunofluorescence images of pericyte markers in HRPCs (top) and iRPCs (bottom). PDGFRβ is stained in red; SM22α and Nestin are stained in red/magenta; and Calponin-1, NG2 and CD13 are stained in green/red. The immunofluorescent staining experiment was performed once to confirm protein expression. Scale bars, 50 µm. h, Flow cytometry analysis of Fz4 and PDGFRβ in iRPCs at passages one (left), five (middle) and ten (right). The percentage of Fz4+PDGFRβ+ cells (magenta gates) are indicated. i, Representative immunofluorescence images of the iREC–iRPC co-cultured iBRB-on-chip displaying perivascular iRPCs surrounding and encapsulating iREC networks (i) and an iRPC interacting with and supporting an iREC network lumen (ii) as well as the 3D iREC vascular network branch lengths, surface areas, network volumes and lumen diameters of networks in the presence and absence of iRPCs (iii). (i) A magnified view of the yellow boxed region is provided. (ii) Asterisks denote lumen and arrows highlight iRPC–iREC interactions. Scale bars, 50 µm (main image in (i)), 20 µm (magnified view in (i) and xy plane in (ii)) and 10 µm (xz and yz planes in (ii)). j, Representative immunofluorescence images of the 3D iREC and iREC–iRPC networks before (left) and after (right) 70 kDa rhodamine dextran injection (i), and the levels of 70 kDa rhodamine dextran permeability into the iREC and iREC–iRPC networks (ii). N = 4 permeability assays performed on cells derived from independent differentiations; n = 2–3 locationally distinct image stacks taken per biological replicate. e(i),j(i), ZO-1–GFP denotes iREC and iEC networks, and their change in colour from green to yellow/red across time points signifies rhodamine dextran accumulation within the networks. Magnified views of the regions in the grey boxes are provided below the main images. Scale bars, 100 µm (main images) and 50 µm (magnified views). All graphs represent the mean ± s.d. Two-tailed unpaired Student t-tests were performed for all statistical comparisons with the exception of j(ii), where a two-tailed paired Student t-test was performed. Significance was set at P ≤ 0.05. The consistent cell morphology and protein expression observed across independent experiments demonstrate the reproducibility of these results. b–d,g,i, DAPI was used to stain the nuclei. Panels created in BioRender: a, Esswein, P. https://biorender.com/0dcy95a (2026); f, Lin, Y. and Esswein, P. https://biorender.com/3djupjg (2026).
Pericytes are critical for the development and maintenance of iBRB functionality, and their loss is implicated in iBRB breakdown in the context of disease9,11,21,23,78,79,80,81. We therefore sought to include pericytes in the iBRB MPS to increase the complexity and biological relevance of our model. To this end, we utilized an established pericyte differentiation protocol32,82 where pericytes are derived from iPSCs through a mesodermal lineage induction. As it has been suggested that Norrin–Fz4 signalling interactions are critical to iBRB development and retinal pericytes express Fz4 (refs. 21,22,29,83), we utilized Norrin supplementation during the differentiation to specifically develop WTC-TJP1 iPSC-derived retinal pericytes (iRPCs; Fig. 5f). To characterize the iRPCs and validate their phenotype, immunofluorescence assays and flow cytometry analysis were performed. Immunofluorescence analysis demonstrated that the iRPCs properly expressed the essential pericyte markers PDGFRβ, SM22α, Nestin, Calponin-1, NG2 and CD13 (Fig. 5g). Their expression is consistent with primary human RPCs (HRPCs) and non-tissue-specific iPSC-derived pericytes (iPCs; Supplementary Fig. 16a), corroborating the phenotypic integrity and biological accuracy of the iRPCs. To demonstrate the robustness and utility of this differentiation protocol, we successfully derived iRPCs expressing canonical pericyte markers from the C1-2 hiPSC line34 (Supplementary Fig. 16b). The iRPC population also expressed the iBRB marker Fz4 (ref. 21), in conjunction with PDGFRβ, through passage ten, suggesting the retinal specificity of the PCs. Specifically, >92% of the iRPC population co-expressed Fz4 and PDGFRβ after passage five, with a substantial proportion of the population (61.2%) still expressing Fz4 and PDGFRβ by passage ten (Fig. 5h). This validates the purity and longevity of the iRPCs and establishes the importance of the Norrin–Fz4 signalling axis to retinal pericyte development. At the transcriptomic level, iRPCs had similar expression of the pan-pericyte marker ANPEP (CD13) to HRPCs and iPCs, and the retinal-specific marker ATP13A5 to HRPCs. They also displayed increased expression of the RPC markers CD248 and ABCC9 compared with iPCs (Supplementary Fig. 16c). To investigate functionality, we performed a Transwell migration assay in the presence and absence of platelet-derived growth factor BB (PDGFBB), an EC secreted factor critical for iBRB development and thus a stimulus the iRPCs must respond to84. The HRPCs, iRPCs and iPCs all exhibited an increased migration to the basolateral side of the Transwell in the PDGFBB group compared with the control (Supplementary Fig. 16d). After confirming the robustness and phenotypic fidelity of the iRPCs, we developed an iBRB MPS with both retinal-specific ECs and pericytes. We observed physiological iREC–iRPC interactions within the iBRB MPS, namely the formation of luminal iREC structures supported and encapsulated by iRPCs (Fig. 5i(i),(ii) and Supplementary Fig. 16e,f). Importantly, these interactions contributed to a decrease in vascular network branch length, surface area, volume and lumen diameter (Fig. 5i(iii) and Supplementary Fig. 16f), recapitulating iBRB network morphology and the luminal size of human iBRB capillaries41,42,85,86,87. The iRPCs also increased the barrier properties of the iREC networks, decreasing their permeability to 70 kDa rhodamine dextran to a level consistent with in vivo permeability88 (Fig. 5j).
In summary, we showed that our iPSC-derived iBRB model contains high biological fidelity, recapitulating physiological endothelial–pericyte organization, cellular interactions and barrier properties. This demonstrates that iRECs and iRPCs can be utilized to generate a functional, perfusable and mature iBRB MPS to study eye development and disease progression, and thus advance therapeutics.