
ILS disassembly assay in nematode extractSample preparation
Total nematode extract was prepared from a C. elegans strain expressing endogenously 3×FLAG-tagged PRP19 (ref. 2).
Disassembly assays in the presence and absence of ATP were performed in technical triplicates. A total of 500 µl nematode extract was supplemented with either 5× splicing buffer with ATP (50 mM HEPES-KOH pH 7.9, 175 mM KCl, 10 mM ATP, 20 mM MgCl2, 100 mM creatine phosphate, 250 µg ml−1 creatine kinase and 15% PEG 8000) or 5× splicing buffer without ATP (50 mM HEPES-KOH pH 7.9, 175 mM KCl and 20 mM MgCl2). The supplemented extracts were incubated at 20 °C for 1 h with gentle agitation. Of magnetic anti-FLAG bead slurry (Sigma) equilibrated in detergent wash buffer (20 mM HEPES-KOH pH 7.9, 150 mM KCl, 1 mM TCEP, 2 mM MgCl2, 0.05% Igepal 630 and 10% glycerol), 20 µl was then added to each reaction. The samples were transferred to 4 °C and incubated with the beads for 2 h with gentle rotation. The beads were washed four times with 1 ml detergent wash buffer, transferred to fresh tubes and then washed an additional four times with detergent-free wash buffer (20 mM HEPES-KOH pH 7.9 and 150 mM KCl). The washed beads were resuspended in detergent-free wash buffer, transferred to fresh tubes and submitted to the Vienna BioCenter Mass Spectrometry Facility for on-bead tryptic digestion and liquid chromatography–tandem mass spectrometry (LC–MS/MS) analysis.
Assay analysis
The resulting raw MS data were processed for protein identification and label-free quantification. To identify the proteins that were depleted from the beads upon ATP treatment, protein abundances in the samples with and without ATP were compared. Proteins were considered significantly enriched based on statistical tests (moderated t-test in limma, P < 0.05) and an arbitrary log2 fold change cut-off of 1 (twofold enrichment over control on a linear scale). The data were visualized in GraphPad Prism 10.
Generation of human cell linesK562 cells stably overexpressing DHX35–EGFP or YJU2B–EGFP
N-terminally EGFP–3C-tagged DHX35 and YJU2B overexpression cell lines were generated using a lentivirus system. Lenti-X 293T cells (Takara) were polyethylenimine transfected with lentiviral carrier plasmids containing either pRRL-SFFV-EGFP-3C-DHX35 or pRRL-SFFV-YJU2B-3C-EGFP. These were transfected alongside viral helper plasmids pCMVR8.74 (Addgene #22036) and pCMV-VSV-G (Addgene #8454). After 2 days, supernatant containing the lentiviral particles was collected. Wild-type K562 cells (DSMZ) were infected at limiting dilutions and EGFP-expressing cells were isolated by fluorescence-activated cell sorting using a BD FACSAria III instrument (BD Biosciences). Integration and expression of the constructs were confirmed by in-gel EGFP fluorescence and immunoblotting for DHX35 (CAS HPA062700, Sigma; dilution 1:250) or YJU2B (CAS OAAB02156, Aviva SysBio; dilution 1:1,000). All cultures were routinely tested for mycoplasma contamination.
K562 cells inducibly overexpressing DHX35(K83A)–EGFP or DBR1–EGFP
To generate inducible cell lines, C-terminally 3C–EGFP-tagged DBR1 and N-terminally EGFP–3C-tagged mutant DHX35(K83A) constructs were cloned into a PiggyBac transposon donor plasmid containing a doxycycline-inducible TRE Tight promoter. Wild-type K562 cells (DSMZ) were electroporated with equal amounts of transposon donor and PiggyBac transposase plasmids using a Neon NxT Electroporation System (NEON1S, Thermo). Cells were selected using blasticidin (R21001, Invitrogen). Expression of the transgene was induced using 0.1 µg ml−1 doxycyclin (D9891, Sigma-Aldrich) for 18 h and EGFP+ cells were isolated using fluorescence-activated cell sorting. Expression of the constructs was confirmed by in-gel EGFP fluorescence and immunoblotting for DBR1 (CAS PA5-30616, Invitrogen; dilution 1:500) or DHX35 (CAS HPA062700, Sigma; dilution 1:250). All cultures were routinely tested for mycoplasma contamination.
HEK293T cells with endogenous DBR1–dTAG
HEK293T cells were endogenously tagged at the C terminus of DBR1 with GGGS3-FKBP12(F36V)-V5-IRES-lox5171-mScarlet3/mNeonGreen-lox5171, where FKBP12 is the protein that brings DBR1 to the cellular ubiquitination machinery in the presence of the dTAGV-1 compound, and lox5171 is a Cre recombinase target site. An sgRNA targeting the DBR1 C terminus was designed using CHOPCHOP61 and cloned into a modified plasmid #217659 (Addgene), in which the mCherry coding sequence was replaced with a puromycin resistance cassette. The sgRNA plasmid was co-transfected with two donor plasmids. The donor plasmids contained the repair template with the desired tag followed by either mScarlet3 or mNeonGreen and flanked by the DBR1 homology arms. Five days after transfection, cells co-expressing mScarlet3 and mNeonGreen, which indicated homozygous tagging, were sorted by flow cytometry and then allowed to recover for 4 days. The cells were then treated with homemade recombinant Cre recombinase for 2 h at 37 °C in serum-free medium to excise the coding sequences of the fluorescent protein markers from the DBR1 loci. After 3 days of recovery, mScarlet3/mNeonGreen double negative cells were single-cell sorted into medium supplemented with extra 25% of FCS. The selected clones were expanded and genotyped by Sanger sequencing. The homozygous clones were selected, and protein depletion upon addition of the dTAGV-1 compound was validated by western blot using an antibody to DBR1 (CAS 66951-1-IG, Proteintech; dilution 1:10,000).
To generate HEK293T DBR1–dTAG cell lines that also inducibly overexpress various DBR1 constructs (wild type, catalytic mutant (H85A) and deletion of peptide I residues 420–434 (Δpep1)), the coding sequences of DBR1 were cloned into the PiggyBac transposon donor plasmid under a doxycycline-inducible TRE Tight promoter. The DBR1 constructs were tagged on the C terminus with a P2A self-cleaving peptide followed by mScarlet. The DBR1-P2A–mScarlet expression cassettes were inserted into the HEK293T DBR1–dTAG cells by electroporation, and the successful clones were selected by fluorescence-activated cell sorting, as described above for the DHX35(K83A)–GFP and DBR1–GFP K562 overexpression cell lines. All cell lines were routinely tested for mycoplasma contamination.
HEK293T cells inducibly overexpressing TurboID-tagged DBR1, C19L1, YJU2B, LENG1 or EGFP
To generate stable inducible cell lines for proximity labelling experiments, HEK293 Flp-In T-REx parental cells at approximately 80–90% confluency were co-transfected with a pcDNA5/FRT/TO plasmid, which carried the coding sequence of DBR1, C19L1, YJU2B, LENG1 or nuclear localized EGFP fused on the 3′ end to the TurboID-V5 tag, and the pOG44 plasmid (Thermo Fisher Scientific) at a 1:5 mass ratio (donor:pOG44) using the JetOptimus transfection reagent (Polyplus-transfection). For a 24-well plate format, 350,000 cells were seeded per well onto the transfection complex. Twenty-four hours after transfection, cells were expanded into a six-well plate. Forty-eight hours later, selection was initiated. The cells were seeded to achieve 25–30% confluency and allowed to attach for approximately 2 h. The medium was then replaced with selection medium containing 100 µg ml−1 hygromycin B and 15 µg ml−1 blasticidin S HCl. The selection medium was refreshed every 3–4 days. The selection process was monitored using the parallel wild-type cell culture, and selection was continued until all wild-type cells had died (approximately 10–14 days), at which point the pooled colonies of resistant cells were expanded without antibiotics. Successful integration was confirmed by western blotting using an antibody to the V5 tag (CAS R960-25, Thermo Fisher Scientific, dilution 1:3,000). All cultures were routinely tested for mycoplasma contamination.
RPE-1 cells stably overexpressing LENG1–EGFP
cDNA corresponding to LENG1 was amplified from cDNA by PCR and inserted into a PGK-EGFP-N1-IRES-PURO plasmid, thereby tagging LENG1 at its C terminus with EGFP. The annealed double-stranded DNA fragment of NLS (GGTGGTCCTAAGAAGAAGAGAAAGGTT) was similarly cloned into PGK-EGFP-C1-IRES-PURO as a control.
The plasmids expressing the tagged proteins were transfected into RPE-1 cells62 using polyethylenimine reagent (Brunschwig Chemie) following the manufacturer’s instructions. Two days after transfections, antibiotic selection of cells was initiated by adding 1 μg ml−1 puromycin to the growth media. The selection medium was replaced every second day until the cells reached confluency. The expression of tagged proteins was verified by western blot using an antibody to GFP (CAS 11814460001, Roche, dilution 1:1,000) and fluorescence microscopy. All cultures were routinely tested for mycoplasma contamination.
Preparation of human nuclear extract
The nuclear extracts for cryo-EM, RNA sequencing and biochemical assays were prepared from the human K562 cells stably overexpressing EGFP-tagged DHX35 or YJU2B as previously described2,63. To prepare nuclear extract from the K562 cells overexpressing EGFP-tagged DHX35(K83A) or DBR1, expression of the tagged protein was first induced by addition of 0.1 µg ml−1 doxycycline. The cells were cultured for 48 h before collecting and preparing nuclear extract as previously described2,63.
Cryo-EM grid preparationPurification of DIS (DHX35-containing spliceosome)
Approximately 25 ml of the nuclear extract of K562 cells stably overexpressing DHX35–EGFP was applied to approximately 1.5 ml of GFP-Trap Agarose beads (Chromotek) equilibrated in wash buffer (20 mM HEPES-KOH pH 7.9, 100 mM KCl, 0.5 mM TCEP, 2 mM MgCl2, 0.05% v/v Igepal CA-630 and 8% v/v glycerol). The beads were incubated with the nuclear extract for approximately 3.5 h at 4 °C with gentle rotation. The beads were then washed five times in 10 ml wash buffer. The washed beads were incubated twice for approximately 1 h at 4 °C with gentle rotation in 0.5 ml elution buffer (20 mM HEPES-KOH pH 7.9, 100 mM KCl, 0.5 mM TCEP, 2 mM MgCl2, 3% w/v sucrose and 0.1 µg ml−1 3C protease). The eluted samples were then applied to a GraFix64 15–30% w/v sucrose gradient containing 0.05% glutaraldehyde in the heaviest fraction in a gradient buffer (20 mM HEPES-KOH pH 7.9, 100 mM KCl, 0.5 mM TCEP and 2 mM MgCl2). The gradient samples were spun in an SW60 Ti rotor (Beckman Coulter) at 22,000 rpm for 16 h at 4 °C. The gradients were fractionated manually, and each fraction was quenched with 45 mM lysine. The sedimentation coefficients were estimated using the CowSuite software, and the peak spliceosome fractions were further confirmed by SDS–PAGE. The peak spliceosome fractions were pooled and concentrated using Amicon Ultra 0.5-ml concentrators with 100-kDa molecular weight cut-off (Sigma). During concentrating, the sample was buffer exchanged to a cryo-EM buffer (20 mM HEPES-KOH pH 7.9, 0.5 mM TCEP, 100 mM KCl and 2 mM MgCl2) to remove sucrose and excess glutaraldehyde.
Purification of ILSAQR (YJU2B-containing spliceosome)
Approximately 25 ml of the nuclear extract of K562 cells stably overexpressing YJU2B–EGFP was incubated overnight with 2 µg ml−1 benzonase before proceeding to anti-GFP affinity purification and gradient ultracentrifugation as described above for DHX35-containing spliceosome.
Grid preparation
The purified spliceosome samples were incubated with a 2-nm continuous carbon film (prepared in-house) for either overnight (DIS), approximately 7 h (ILSAQR; dataset 1) or approximately 3 h (ILSAQR; dataset 2) in a homemade humidity chamber at 4 °C. The carbon film was picked up with a glow-discharged R3.5/1 holey carbon grid (Quantifoil). Of ice-cold cryo-EM buffer, 3 µl was applied to the grid before blotting at 4 °C and 80% humidity and plunging into liquid ethane using a Leica EM GP2 instrument.
Cryo-EM data collectionILSAQR or YJU2B -containing spliceosome
Two datasets of ILSAQR were collected using a Titan Krios G4 equipped with a Falcon 4i direct electron detector (Vienna BioCenter). Dataset 1 contained 26,091 movies, whereas dataset 2 consisted of 27,327 movies. The energy filter was set to a width of 10 eV. The C2 aperture was set to 50 µm, whereas the objective aperture was retracted. In both datasets, the movies were collected at a total dose of 40 e− Å−2 in EER format with a pixel size of 0.951 Å per pixel. The target defocus of both datasets ranged from −1.0 µm to −2.5 µm.
DIS or DHX35-containing spliceosome
A dataset of 12,277 micrographs was collected using a Titan Krios G4 equipped with a Falcon 4i direct electron detector (Vienna BioCenter). The energy filter was set to a width of 10 eV. The C2 aperture was set to 50 µm, whereas the objective aperture was retracted. The movies were collected at a total dose of 50 e− Å−2 in EER format with a pixel size of 0.951 Å per pixel. The target defocus ranged from −1.25 µm to −2.25 µm.
Cryo-EM data analysisPre-processing and particle cleaning of human ILSAQR
Pre-processing (gain correction, motion correction and contrast transfer function estimation) of both datasets of the ILSAQR was performed in cryoSPARC live65.
For dataset 1, 931,992 particles were picked on-the-fly using the Blob picker in cryoSPARC live with a minimum and maximum particle diameter set to 250 Å and 450 Å, respectively. The picked particles were extracted with a box size of 128 pixels at a binned pixel size of 4.01 Å per pixel. A 2D classification was performed to select the particles representing 2D class averages with clear internal features. The selected particles were subsequently used to generate three 3D ab initio models. Three rounds of heterogeneous refinement were performed using the ab initio models as references. Only the particles from the best class were carried over to the next round of refinement, resulting in the final subset of 232,423 particles. Particles in dataset 1 were also picked in Warp66 using a model trained on manually picked particles with an expected particle diameter of 350 Å. The 1,172,730 Warp-picked particles were processed the same as above, resulting in a subset of 294,689 particles. Upon removal of duplicate particles, the combined Blob-picked and Warp-picked particles were re-extracted with a box size of 448 pixels at a binned pixel size of 1.15 Å per pixel and further processed by reference-based motion correction in cryoSPARC. In the end, 310,532 particles were obtained from dataset 1.
For dataset 2, particles were picked in Warp66 using a model trained on manually picked particles with an expected particle diameter of 350 Å. The picked 1,068,365 particles were extracted with a box size of 128 pixels with a binned pixel size of 4.01 Å per pixel. The three ab initio models from dataset 1 were used for three rounds of heterogeneous refinement with only the best class being carried over to the next round of refinement. The selected particles were then re-extracted with a box size of 448 pixels at a binned pixel size of 1.15 Å per pixel and further processed by reference-based motion correction in cryoSPARC. In the end, 197,936 particles were obtained from dataset 2.
Obtaining maps of human ILSAQR
The particles from both datasets were combined, resulting in a complete set of 508,031 particles. A non-uniform refinement generated a consensus map of the ILSAQR (map 1) at a global resolution of 2.40 Å. By performing a local refinement with a mask around the core of the spliceosome, we obtained map 2 at a resolution of 2.34 Å. To further improve the resolution of specific spliceosome regions, we performed local refinements with masks around the zinc-finger domain of YJU2B (map 3 at a nominal resolution of 2.32 Å), the helical bundle of the NTR subunits PRP19–CDC5L–SPF27 (map 9 at a nominal resolution of 3.83 Å), the helical repeats of the NTC subunits SYF1–SYF2 (map 10 at a nominal resolution of 2.59 Å) and the U5 Sm ring (map 11 at a nominal resolution of 2.88 Å).
The GCFC domains and the coiled-coil interaction interface of TFIP11 and GCFC2 were poorly resolved in map 1, probably due to their flexibility and potentially their partial occupancy. To better resolve these termination factors in the ILSAQR, we performed two rounds of 3D classification with a mask around TFIP11–GCFC2 on the combined 508,031 particles. First, we performed a hard 3D classification in cryoSPARC. The 139,130 particles from the best 7 out of 50 classes were selected for a 3D classification in RELION5 with Blush regularization67 with a T value of 40. The resulting best class containing 6,794 particles was locally refined in cryoSPARC with a mask around TFIP11–GCFC2 to generate map 8 at a nominal resolution of 7.37 Å.
For certain spliceosomal regions, combining particles from two datasets did not result in significant improvements in density quality. Specifically, to produce ILSAQR maps 4–7, only the 310,532 particles from dataset 1 were used.
To improve the resolution of the termination factor C19L2, we performed a local refinement with a mask around C19L2, resulting in map 4 at a nominal resolution of 2.84 Å.
To better visualize AQR within ILSAQR, we performed a hard 3D classification on the particles from dataset 1 with a mask around AQR. Particles from 3D classes with the best-defined AQR density were used in a local refinement with a mask around AQR before proceeding to 3D variability analysis in cryoSPARC with the same mask. The 46,099 particles from the best cluster out of 10 were used for another local refinement with a mask around AQR, generating map 5 at a nominal resolution of 3.92 Å.
The region of ILSAQR containing the helical repeats of SYF1, the MPP domain of C19L1 and the interacting helix of YJU2B appeared to be flexible and, hence, poorly resolved in map 1. To better visualize this region, we performed 3D variability analysis of the 310,532 particles from dataset 1 after homogeneous refinement with a global mask. One out of 10 clusters with the best-defined region of interest containing 26,265 particles was selected and further locally refined with a mask around SYF1–C19L1–YJU2B. This produced map 6 at a nominal resolution of 6.32 Å.
To better resolve DHX15 that appeared to be flexibly tethered to the ILSAQR, we performed several 3D classification jobs varying the class similarity values with a mask around DHX15. The best classes from several classification jobs were combined, duplicate particles were removed and locally refined with a broad mask around DHX15 and the surrounding regions, and further 3D classified with the same broad mask. The 9,659 particles from the two best classes were further locally refined with a mask around DHX15, resulting in map 7 at a nominal resolution of 8.62 Å.
Pre-processing and particle cleaning of human DIS
Pre-processing (gain correction, motion correction and contrast transfer function estimation) of the DIS dataset was performed in cryoSPARC live65.
Particles were picked on-the-fly using the Blob picker in cryoSPARC live with a minimum and maximum particle diameter set to 250 Å and 350 Å, respectively. The picked particles were extracted with a box size of 256 pixels with a binned pixel size of 1.90 Å per pixel. A 2D classification was performed to select the particles representing 2D class averages with the best internal features. The selected particles were subsequently used to generate three ab initio 3D models. Three rounds of heterogeneous refinement were performed using the ab initio models as references. Only the particles from the best class were carried over to the next round of refinement, resulting in the final subset of 140,678 particles. DIS particles were also picked in Warp66 using a model trained on manually picked particles with an expected particle diameter of 350 Å. The 514,099 Warp-picked particles were processed the same as above, resulting in a subset of 130,283 particles. Upon removal of duplicate particles, the combined Blob-picked and Warp-picked particles were re-extracted with a box size of 448 px with a binned pixel size of 1.19 Å per pixel, resulting in the final dataset of 153,470 particles.
Obtaining maps of human DIS
We used all 153,470 particles to perform a non-uniform refinement and obtained the overall consensus map of the DIS (map 1) at a global resolution of 3.14 Å. Although the core of the DIS in map 1 could be visualized at high resolution, many peripheral spliceosome regions were poorly defined and required further 3D classifications and local refinements to obtain high-quality cryo-EM densities.
To improve the density of the intron–U6 snRNA duplex, we performed a 3D classification with all 153,470 particles with a mask around the RBM22–intron–U6 snRNA region. The best class from this classification was further refined using non-uniform refinement, resulting in map 2 at a nominal resolution of 4.67 Å.
To improve the density quality of the WD40 domain of PRP17, we performed a local refinement around this domain and obtained map 3 at a nominal resolution of 3.97 Å.
To improve the density quality of DHX35–GPATCH1, we imported all 153,470 particles to RELION5 and performed a 3D classification with Blush regularization67 with a mask around DHX35–GPATCH1 and a T value of 150. The best class from the 3D classification containing 63,636 particles was imported back into cryoSPARC. After homogeneous reconstruction, a local refinement with a mask around DHX35–GPATCH1 was performed, generating map 4 at a nominal resolution of 2.90 Å.
We performed a 3D classification on all 153,470 particles to assess the homogeneity of the dataset. Although we did not observe multiple distinct spliceosome complexes in the dataset, we identified 45,958 particles that yielded a DIS map with the highest quality peripheral densities. We performed a non-uniform refinement on these particles to obtain a more complete DIS map at a nominal resolution of 3.62 Å with better peripheral density quality than map 1. We used the same subset of particles to perform local refinements with masks around two NTC regions—the PRP19–CDC5L–SPF27 helical bundle and the RBM22–PPIL1–PLRG1 region—resulting in map 5 at a nominal resolution of 5.35 Å and in map 9 at a nominal resolution of 4.04 Å, respectively.
To better visualize AQR within the DIS, we performed a hard 3D classification with a mask around AQR, producing a class with the best AQR density with 15,913 particles. After homogeneous reconstruction, a local refinement with a mask around AQR was performed, generating map 6 at a nominal resolution of 7.34 Å.
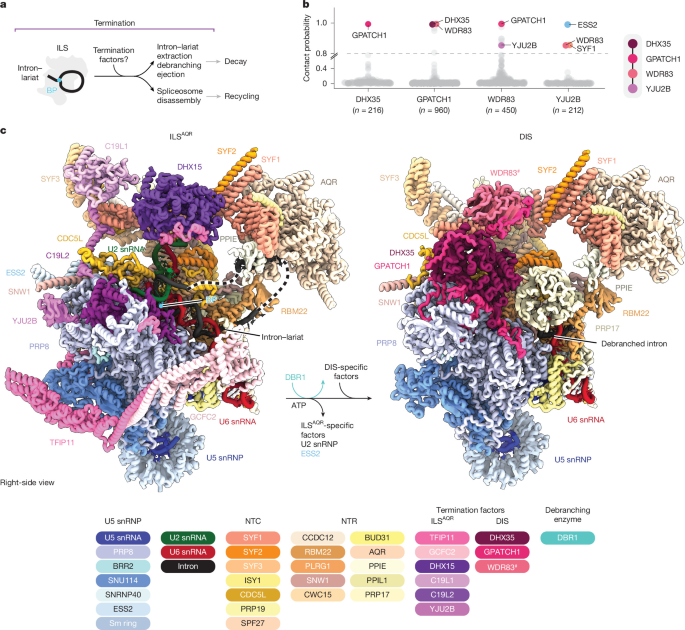
We consistently observed a low-resolution density near DHX35 that appeared to be shaped like a WD40 domain. Given our biochemical data and in silico protein interaction predictions (Fig. 1 and Extended Data Fig. 1), we assigned this density as the GPATCH1 interactor WDR83. To improve this cryo-EM density, we performed multiple rounds of 3D classification. Specifically, we performed five 3D classification jobs with variable values of class similarity with a mask around the putative WDR83 density in cryoSPARC. The best classes from all jobs were selected. After removing duplicate particles, the selected particles were used in two rounds of 3D classification in RELION5 with a mask around WDR83 at T values of 80 for the first round and of 40 during the second round. The best class containing 1,826 particles was reconstructed using homogeneous reconstruction in cryoSPARC, generating map 7 at a nominal resolution of 9.65 Å. Given the limited resolution of map 7, we could not explicitly assign the orientation of WDR83 in the DIS.
In maps 1 and 2, the helical repeats of the NTR subunits SYF1–SYF3 and the Sm ring of the U5 snRNP were not well resolved, probably due to the inherent flexibility of these spliceosomal regions. Therefore, we performed focus refinements with masks around SYF1–SYF3 and the U5 Sm ring, resulting in map 8 at a nominal resolution of 5.19 Å and map 10 at a nominal resolution of 3.35 Å, respectively.
Model building into cryo-EM mapsHuman ILSAQR
We generated the composite map of the human ILSAQR from ILSAQR maps 1–11 as previously described2.
To prepare a model of the human ILSAQR, we started from our previously published model of the human ILS″ (PDB 8RO2)2. First, we removed the following protein segments that were not observed in the cryo-EM density of the ILSAQR: SDE2, SYF1 residues 791–824, CDC5L residues 57–111 and 357–382. To model the zinc-finger domain of YJU2B (residues 43–118), we predicted its structure together with a Zn2+ ion using AlphaFold3 (ref. 36) and rigid body fitted the predicted model of this domain. To model the helical region of YJU2B (residues 163–233), we predicted the structures of the YJU2B–SYF1–SYF3–C19L1 and YJU2B–PRP8 complexes in AlphaFold3. Both models were rigid body fitted. We also added BRR2 residues 39–57 (as in PDB 8Q7X)9, PPIE RRM residues 1–80 (as in PDB 9FMD)2 by rigid body fitting. We also modelled additional ESS2 regions (residues 65–87, 178–189, 211–234 and 240–254) guided by AlphaFold3 predictions and ModelAngelo68. The RNA in the active site of AQR was modelled as an unknown RNA sequence. The position of DHX15–TFIP11 G-patch was adjusted by rigid body fitting into map 10. PAXBP1 was replaced with GCFC2 by first deleting the TFIP11–PAXBP1 dimer from the model and then fitting an AlphaFold3 prediction of the TFIP11–GCFC2 dimer into map 6. We truncated side chains for non-proline residues to their Cβ atoms in map regions where side-chain density was lacking.
We modelled the RNA in the active site based on the structure of the human ILS assembled on the MINX pre-mRNA (PDB 6ID1)3 but only assigned a sequence for a consensus 5′ SS and a BP adenosine, whereas all other nucleotides were modelled as uridine and truncated to their ribose moiety. The portion of the intron bound to AQR and PPIE was modelled based on AlphaFold3 predictions.
All models were manually adjusted using ISOLDE69 in ChimeraX. The final model was real-space refined against the composite map in Phenix70. We generated base-pairing and stacking restraints in Phenix to stabilize nucleic acid geometry. We further used the input model to generate reference model restraints. The non-bonded weight parameter was set to 1,000 and rotamers were fitted for side chains with poor density that were also outliers.
Human DIS
We generated the composite map of the human DIS from maps 1–10 as previously described2.
To prepare a model of the DIS, we started from our previously published model of the human ILS″ (PDB 8RO2)2. First, we deleted DHX15, TFIP11, PAXBP1, C19L1, C19L2, SDE2, ESS2 and U2 snRNA, which were not resolved in the cryo-EM density of the DIS. We also truncated U6 snRNA to residues 1–35 and the intron to 10 residues, six of which were base paired with U6 snRNA. Given that a mixture of introns is present in the endogenous DIS sample, no sequence was assigned to the intron.
To model DHX35 and GPATCH1, we predicted the structures of DHX35–GPATCH1, GPATCH1–PRP8 endonuclease domain and the GPATCH1–PRP8 finger-palm domain using AlphaFold2 Multimer37. The regions of GPATCH1 that were predicted with low confidence were truncated, and the predicted models were rigid body fitted into map 7. The segments of GPATCH1 towards its C terminus that were confidently predicted to interact with DHX35 but lacked experimental cryo-EM densities were also removed. The fitted models were adjusted using ISOLDE69 in ChimeraX. The segments of GPATCH1 that were not confidently predicted but were present in the cryo-EM density were manually built in ISOLDE.
The RNaseH domain of PRP8, which was relocated in the DIS compared with the ILS″, was rigid body fitted into the DIS map. BRR2 residues 39–57 (as in PDB 8Q7X)9 and the RRM domain of PPIE (residues 1–80; as in PDB 9FMD)2 were added by rigid body fitting followed by manual adjustments in ISOLDE.
We also modelled the WD40 domains of PRP17 and of WDR83 bound to GPATCH1. The orientation of the PRP17 WD40 was assigned based on its position relative to the PRP17 N-terminal domain that anchors the protein on the surface of BUD31. We rigid body fitted the predicted AlphaFold2 Multimer model of WDR83–GPATCH1 into map 9. Owing to the low local resolution of map 9, we could not unambiguously assign the orientation of WDR83–GPATCH1. The resolution of map 9 was also not sufficient to unambiguously determine whether WDR83 was bound by GPATCH1. However, our biochemical data (Extended Data Fig. 6d) and AlphaFold predictions (Fig. 1 and Extended Data Fig. 1) strongly indicate that WDR83 is anchored by GPATCH1 in the DIS. We truncated side chains for non-proline residues to their Cβ atoms in map regions where side-chain density was lacking.
The final model was real-space refined against the composite map in Phenix70 as described above for ILSAQR.
Revision of S. pombe B*D
To revise the structure of the defective fission yeast spliceosome B*D (PDB 9ESI)23, we first focused on identifying the protein chains that were originally modelled as ‘unknown’. We compared the published model to our models of the human ILSAQR and DIS. We noted that all but one of the unidentified chains were modelled in our new human spliceosome structures. We predicted the structures of the S. pombe proteins and their interactors in AlphaFold3 (ref. 36) and rigid body fitted them into the published map (EMD-19942)23. This allowed us to add CDC5L (S. pombe name Cdc5) residues 456–476, CCDC12 (Cwf18) residues 101–142 and GPATCH1 (C20H4.06c) residues 260–280.
We also identified an unassigned density on the surface of PPIL1 in the B*D spliceosome that was modelled as an N-terminal domain of SNW1 in our previously revised human P complex spliceosome (PDB 9FMD)2. We predicted the structure of S. pombe SNW1–PPIL1 (S. pombe names Prp45–Ppi1), rigid body fitted the model into the published map and further adjusted it manually using ISOLDE69. This allowed us to add SNW1 (Prp45) residues 42–83 to the model of the S. pombe B*D spliceosome.
To identify the unknown density on the surface of CWC22 (S. pombe name Cwf22), we examined the previously published spliceosome structures for proteins modelled in the same location, as well as searched the human predicted interactome database20 for CWC22 interactors. The S. pombe orthologues of the proteins that were identified as potential CWC22 interactors were then further tested for their predicted interaction with S. pombe CWC22 using AlphaFold3. This narrowed down the list of potential candidates to three proteins: CWC25 (S. pombe name Cwf25), SLU7 (Slu7) or LENG1 (SPCC5E4.10c). As described in the main text and in Extended Data Fig. 9a, in the published map, we observed a segment of four residues with unambiguous side-chain densities: P-Y/F-W followed by an amino acid with a side chain of at least two non-hydrogen atoms. Only the sequence of LENG1 matched the unambiguously resolved side-chain density (Extended Data Fig. 9a). The S. pombe CWC22–LENG1 prediction was rigid body fitted into the published map and then manually adjusted in ISOLDE, using a more confident prediction of the human proteins as a guide.
We also adjusted the RNA network of the B*D spliceosome. Specifically, we noticed implausible base-pairing geometry in the 5′ SS–U6 snRNA region, and adjusted the model based on an earlier S. pombe spliceosome structure (PDB 3JB9)71. Finally, we truncated intron nucleotides that were poorly resolved and outside of known consensus sequences to their ribose moiety.
We truncated side chains for non-proline residues to their Cβ atoms in map regions where side-chain density was lacking. The final model was real-space refined against the published map (EMD-19942)23 in Phenix70 as described above.
Endogenous DBR1 pulldown
Pulldowns with nuclear extracts from both induced and uninduced (negative control) K562 doxycycline-inducible DBR1–EGFP cells were performed in technical triplicates. Of nuclear extract, 1 ml was added to the GFP Trap beads slurry (Chromotek) equilibrated in wash buffer (20 mM HEPES-KOH pH 7.9, 50 mM, 0.5 mM TCEP, 2 mM MgCl2, 0.05% v/v Igepal CA-630 and 8% v/v glycerol). The beads were incubated for 3.5 h at 4 °C with gentle rotation. The supernatant was removed, and the beads were washed five times with 1 ml wash buffer. After removing residual buffer, bead-bound proteins were eluted by addition of 150 µl SDS loading dye. All three replicates of the pulldowns from extracts of both induced and control cells were run for 3 min at 180 V on a Novex Tris-glycine 4–12% 1.0 mm WedgeWell gel (Thermo Fisher Scientific) and submitted to the Vienna BioCenter Mass Spectrometry Facility for in-gel tryptic digestion and LC–MS/MS analysis. Protein abundances in both DBR1–GFP and control samples were compared, and the data were visualized in GraphPad Prism 10.
Endogenous LENG1 pulldown
Cell pellets were solubilized in EBC-1 (50 mM Tris pH 7.5, 150 mM NaCl, 0.5% NP-40, 2 mM MgCl2, with protease and phosphatase inhibitor cocktails (Roche)) supplemented with 500 U benzonase for 1 h at 4 °C on a rotator. The lysates were cleared from insoluble chromatin by centrifugation and were subjected to immunoprecipitation with GFP Trap beads (Chromotek) for 1.5 h at 4 °C under rotation. The beads were then washed five times with EBC-2 buffer (50 mM Tris pH 7.5, 150 mM NaCl, 0.5% NP-40 and 1 mM EDTA) and boiled in Laemmli buffer for 10 min at 95 °C.
After the pulldown, the GFP beads were washed three times with 50 mM ammonium bicarbonate, followed by overnight digestion using 0.5 μg trypsin at 37 °C under constant shaking. Digested peptides were separated from the beads using a 0.45-µm filter column (Merck) that was pre-washed with 50 mM ammonium bicarbonate. Trypsin activity was quenched by acidifying the sample with trifluoroacetic acid to a final concentration of 1%. Peptides were desalted and concentrated using in-house-assembled triple-disc C18 stage-tip columns (66883-U; 3 M) as previously described72. In brief, the columns were first washed with methanol, then with buffer B (80% acetonitrile and 0.1% formic acid in water), followed by buffer A (0.1% formic acid in water). The samples were loaded using vacuum centrifugation. Finally, peptides were eluted with 32% acetonitrile and 0.1% formic acid in water, lyophilized and dissolved in 0.1% formic acid in water. All solvents were LC–MS/MS grade.
Mass spectrometry data were acquired at the proteomics facility of the Andalusian Center for Molecular Biology and Regenerative Medicine (CABIMER) using a Vanquish Neo liquid chromatographer (Thermo Scientific) coupled to an Orbitrap Astral mass spectrometer. Mass spectrometry RAW data were analysed using DIA-NN (v2.3.2 Academia)73. Protein abundances in both LENG1–GFP and control samples were compared, and the data were visualized in GraphPad Prism 10.
Proximity labellingLarge-scale proximity labelling and affinity purification
For proteomic analysis, each stable HEK293 Flp-In T-REx cell line that can inducibly overexpress a TurboID-tagged protein of interest (DBR1, C19L1, YJU2B or LENG1) and a control cell line (nuclear EGFP–TurboID) were processed in biological triplicates. Three million cells per 10-cm dish were seeded. After 24 h, TurboID expression was induced with 100 ng ml−1 doxycycline for another 24 h. This was followed by biotin labelling with 500 µM d-biotin for 15 min. After labelling, the reaction was stopped by placing dishes on ice. The medium was removed, and the cells were washed once with PBS. The cells were then collected by scraping them off in 5 ml ice-cold PBS and transferred to a fresh tube. The cell pellet was washed for a total of four more times by centrifugation at 300g for 4 min at 4 °C before getting resuspended in 1 ml ice-cold PBS. The final pellets were flash-frozen in liquid nitrogen and stored at −80 °C.
The thawed cell pellets were lysed by addition of 120 µl ice-cold RIPA buffer with Halt protease inhibitor cocktail (Thermo Fisher Scientific), followed by vigorous vortexing and incubation on ice for 20 min. The lysates were clarified by centrifugation at 20,000g for 15 min at 4 °C. Protein concentration in the supernatant was determined using the Pierce BCA Protein Assay Kit (Thermo Fisher Scientific). Of total protein, 300 µg from each lysate was incubated for 3 h at 4 °C with 30 µl of the MagReSyn Streptavidin MS magnetic bead slurry (ReSyn Biosciences) equilibrated in ice-cold RIPA buffer. The beads were washed three times with RIPA buffer supplemented with a protease inhibitor cocktail (Thermo Fisher Scientific) with a 10-min rotation for each wash. This was followed by one wash in MS-grade PBS, during which the bead slurry was transferred to a fresh low-bind tube to minimize detergent carryover. Finally, five additional washes were performed with MS-grade PBS. After the final wash, all residual PBS was removed, and the dry bead pellets were flash-frozen in liquid nitrogen and stored at −80 °C.
MS and data analysis
The final washed bead pellets were submitted either to the Vienna BioCenter Mass Spectrometry Facility or to the Max Perutz Labs Mass Spectrometry Facility on dry ice for on-bead tryptic digestion and analysis by LC–MS/MS. The resulting raw data were processed for protein identification and label-free quantification. To identify high-confidence proximity partners, protein abundances in each bait-TurboID sample were statistically compared against those from the control samples (nuclear-localized EGFP–TurboID). Proteins were considered significantly enriched based on statistical tests (moderated t-test in limma, P < 0.05) and an arbitrary log2 fold-change cut-off of 0.75 (approximately 68% enrichment over control on a linear scale). Data visualization was performed in GraphPad Prism 10.
Purification of recombinant proteinsC19L1 MPP domain
The recombinant human C19L1 MPP domain (residues 1–278), which carried an N-terminal His10-MBP tag followed by a 3C protease cleavage site, was expressed in Escherichia coli BL21 DE3 in LB media at 18 °C overnight using a pOPINB+ plasmid.
The cell pellet was resuspended in lysis buffer (25 mM HEPES-NaOH pH 7.9, 500 mM NaCl and 5% glycerol) supplemented with cOmplete protease inhibitor tablets (Roche). The cells were lysed by sonication, and the lysate was cleared by centrifugation. The lysate was then applied to a 5-ml MBP Trap HP column (Cytiva) equilibrated in lysis buffer. The column was washed with lysis buffer before elution of the protein with a step gradient of 12 mM maltose. The eluate was diluted fivefold with buffer A (25 mM HEPES-NaOH and 5% glycerol) to reduce the salt concentration in the sample to 100 mM NaCl. The diluted sample was applied to a 5-ml HiTrap Q anion exchange column (Cytiva) equilibrated in buffer M (25 mM HEPES-NaOH, 100 mM NaCl and 5% glycerol). The column was washed with buffer M before elution of the protein over a linear gradient of 100–800 mM NaCl. The peak fractions were concentrated using a Sartorius centrifugal concentrator with a 50-kDa molecular weight cut-off (Sigma) and subsequently loaded onto a HiLoad Superdex 75 16/60 size-exclusion column (Cytiva) equilibrated in size-exclusion buffer (25 mM HEPES-NaOH pH 7.9, 250 mM NaCl, 1 mM dithiothreitol and 5% glycerol). The peak size-exclusion fractions were pooled, concentrated and flash-frozen in liquid nitrogen.
DHX35
Human DHX35 was cloned into a pGB10 plasmid with an N-terminal His10−3×FLAG tag followed by a 3C protease cleavage site. The plasmid was introduced into E. coli DH10EMBacY cells to generate bacmids74. The purified bacmid was transfected into Sf9 insect cells to produce a baculovirus that was then further amplified in Sf9 cell. The resultant virus was used to infect Hi5 insect cells at a volume ratio of 1:400. The cells were grown for approximately 72 h before collecting by centrifugation.
The cell pellet was resuspended in lysis buffer (25 mM HEPES pH 7.9, 500 mM NaCl, 5% glycerol and 20 mM imidazole) supplemented with cOmplete protease inhibitor tablets (Roche) and DNaseI (Sigma). The cells were broken open by sonication. The lysate was cleared by two rounds of centrifugation and subsequently applied to a 5-ml HisTrap column (Cytiva) equilibrated in lysis buffer. The column was washed with lysis buffer, and the protein was eluted over a linear gradient of 20–350 mM imidazole. The peak fractions containing DHX35 were pooled and diluted fivefold in buffer A (25 mM HEPES-NaOH and 5% glycerol) to reduce the salt concentration in the sample to 100 mM NaCl. The diluted sample was then loaded onto a 5-ml HiTrap Q anion exchange column (Cytiva) equilibrated in buffer M (25 mM HEPES-NaOH, 100 mM NaCl and 5% glycerol). The column was washed with buffer M before elution of the protein over a linear gradient of 0.1–1.4 M NaCl. The peak fractions were concentrated using a Sartorius centrifugal concentrator with a 50-kDa molecular weight cut-off (Sigma) and subsequently loaded onto a HiLoad Superdex 200 16/60 size-exclusion column (Cytiva) equilibrated in size-exclusion buffer (25 mM HEPES-NaOH pH 7.9, 250 mM NaCl, 1 mM dithiothreitol and 5% glycerol). The peak size-exclusion fractions were pooled, concentrated and flash-frozen in liquid nitrogen.
GPATCH1 G-patch domain
The recombinant human wild-type and mutant (M163K V171R L236E) versions of the GPATCH1 G-patch domain (residues 137–247), which carried an N-terminal MBP tag and a C-terminal His6 tag, were expressed in E. coli BL21 DE3 in LB media at 37 °C for 3 h using a pET plasmid.
Each cell pellet was resuspended in lysis buffer (25 mM HEPES-NaOH pH 7.9, 500 mM NaCl, 5% glycerol and 20 mM imidazole) supplemented with cOmplete protease inhibitor tablets (Roche). The cells were lysed by sonication, and the lysate was cleared by centrifugation. The lysate was then applied to a 5-ml HisTrap column (Cytiva) equilibrated in lysis buffer. The column was washed with lysis buffer before elution of the protein over a linear gradient of 20–350 mM imidazole. The eluate was diluted fivefold with buffer A (25 mM HEPES-NaOH and 5% glycerol) to reduce the salt concentration in the sample to 100 mM NaCl. The diluted sample was applied to a 5-ml HiTrap Q anion exchange column (Cytiva) equilibrated in buffer M (25 mM HEPES-NaOH, 100 mM NaCl and 5% glycerol). The column was washed with buffer M before elution of the protein over a linear gradient of 100–800 mM NaCl. The peak fractions were concentrated using a Vivaspin centrifugal concentrator with a 30-kDa molecular weight cut-off (Sigma) and subsequently loaded onto a HiLoad Superdex 200 16/60 size-exclusion column (Cytiva) equilibrated in size-exclusion buffer (25 mM HEPES-NaOH pH 7.9, 200 mM NaCl, 1 mM dithiothreitol and 5% glycerol). The peak size-exclusion fractions were pooled, concentrated and flash-frozen in liquid nitrogen.
WDR83–GPATCH1 complex
Human full-length WDR83 carrying an N-terminal His10-3×FLAG-3C tag and its binding region of human GPATCH1 (residues 560–651) were cloned into a pGB10 plasmid. The plasmid was then used to generate a baculovirus and to express the complex in Hi5 insect cells, as described above for DHX35.
The cell pellet was resuspended in lysis buffer (25 mM HEPES-NaOH pH 7.9, 300 mM NaCl, 1 mM TCEP, 5% glycerol and 20 mM imidazole) supplemented with cOmplete protease inhibitor tablets (Roche) and DNaseI (Sigma). The cells were broken open by sonication. The lysate was cleared by two rounds of centrifugation and subsequently applied to a 5-ml HisTrap column (Cytiva) equilibrated in lysis buffer. The column was washed with lysis buffer, and the protein was eluted over a linear gradient of 20–350 mM imidazole. The peak fractions containing WDR83–GPATCH1 were pooled and diluted fivefold in buffer A (25 mM HEPES-NaOH, 0.5 mM TCEP and 5% glycerol) to reduce the salt concentration in the sample to 100 mM NaCl. The diluted sample was then loaded onto a 5-ml HiTrap Q anion exchange column (Cytiva) equilibrated in buffer M (25 mM HEPES-NaOH, 100 mM NaCl, 0.5 mM TCEP and 5% glycerol). The column was washed with buffer M before elution of the protein over a linear gradient of 0.1–1.4 M NaCl. The peak fractions were concentrated using an Amicon centrifugal concentrator with a 30-kDa molecular weight cut-off (Sigma). Of the WDR83–GPATCH1 complex at 79 µM, 2 ml was subsequently loaded via a 5-ml loop onto a HiLoad Superdex 200 16/60 size-exclusion column (Cytiva) equilibrated in size-exclusion buffer (25 mM HEPES-NaOH pH 7.9, 200 mM NaCl, 0.5 mM TCEP and 5% glycerol). SDS–PAGE analyses of each chromatographic run showed that WDR83 and GPATCH1 co-purified throughout the procedure, indicating the formation of a stable protein complex. The peak size-exclusion fractions were pooled, concentrated and flash-frozen in liquid nitrogen.
DHX35(K83A)–GPATCH1 1–440 complex
Full-length human DHX35 carrying a K83A mutation and an N-terminal His10-3×FLAG tag, and the GPATCH1 construct encompassing the binding regions to both DHX35 and PRP8 (residues 1–440) were cloned into a pGB10 plasmid. The plasmid was then used to generate a baculovirus and express the complex in Hi5 insect cells.
The 3×FLAG–DHX35(K83A)–GPATCH1(1−440)–TwStrep complex was purified as described for the WDR83–GPATCH1 complex above, except for the size-exclusion step, in which the DHX35(K83A)–GPATCH1(1−440) complex was loaded onto a HiLoad Superdex 200 16/60 size-exclusion column (Cytiva) equilibrated in size-exclusion buffer (25 mM HEPES-NaOH pH 7.9, 250 mM NaCl, 0.5 mM TCEP and 5% glycerol).
Peptide synthesis
The peptides used in in vitro pulldown assays were synthesized at the Vienna BioCenter Peptide Synthesis facility as previously described2. In brief, the peptides were synthesized with an N-terminal fluorescein and a C-terminal biotin tag on a Liberty Blue peptide synthesizer (CEM) using Fmoc chemistry. The lyophilized peptides were dissolved in 25 mM HEPES-NaOH pH 7.9 to a concentration of 1 mg ml−1. The following peptides were synthesized: DBR1 peptide I (420–434) wild type: fluo-ALSSINPDEIMLDEE-biotin; DBR1 peptide I (420–434) scrambled: fluo-EEIEMISLADDLSNP-biotin; YJU2B wild type (134–178): fluo-EHEKKQKLETDAMFRLEHGEADRSTLKKALPTLSHIQEAQSAWKD-biotin; YJU2B(M146A L149K E150K) (134–178): fluo-EHEKKQKLETDAAFRKKHGEADRSTLKKALPTLSHIQEAQSAWKD-biotin.
Pulldowns with purified proteinsMBP–C19L1 MPP domain and DBR1 peptide I
Of MBP-tagged C19L1 MPP, 5 µM was mixed with 50 µM of either wild-type DBR1 peptide I or its scrambled version in the final reaction volume of 50 µl. Reactions containing either MBP–C19L1 MPP alone or the DBR1 peptides mixed with MBP as background binding controls were also prepared. The salt concentration in all reactions was adjusted to 100 mM NaCl. Of each sample, 5 µl was removed for SDS–PAGE analysis as input. The binding reactions were incubated for 40 min at 4 °C while rotating. Subsequently, the samples were added to 30 µl of amylose bead slurry (NEB) equilibrated in wash buffer (25 mM HEPES-NaOH pH 7.9, 100 mM NaCl, 1 mM TCEP, 0.1% v/v Igepal CA-630 and 5% v/v glycerol). The beads were incubated for 2 h rotating at 4 °C. The supernatant was removed, and the beads were washed five times with 500 µl wash buffer. Upon removal of residual buffer, 50 µl elution buffer (25 mM HEPES-NaOH pH 7.9, 50 mM NaCl, 0.5 mM TCEP, 5% v/v glycerol and 20 mM maltose) was added to each sample and incubated at 4 °C for 30 min while rotating. The eluates were collected, mixed with SDS loading dye and ran on a Novex Tris-Glycine 4–12% 1.0 mm WedgeWell gel (Thermo Fisher Scientific) for 20 min at 180 V. The DBR1 peptides were visualized by fluorescence signal at 488 nm on a ChemiDoc imager (Bio-Rad), whereas MBP–C19L1 MPP and MBP were stained afterwards with Coomassie blue (Vienna BioCenter Molecular Biology Service).
DHX35 and MBP–GPATCH1 G-patch domain
Of DHX35, 4 µM was mixed with 1 µM of either wild-type or mutant (M163K V171R L236E) GPATCH1 G-patch domain (residues 137–247) in the final reaction volume of 50 µl. Reactions containing individual proteins were also prepared as background binding controls. The salt concentration in all reactions was adjusted to 50 mM NaCl. All samples were incubated at 4 °C for 35 min while rotating. Of each sample, 5 µl was removed for SDS–PAGE analysis as input. Subsequently, each sample was added to 40 µl of amylose bead slurry (NEB) equilibrated in wash buffer (25 mM HEPES-NaOH pH 7.9, 50 mM NaCl, 0.5 mM TCEP, 0.03% v/v Igepal CA-630 and 5% v/v glycerol). The proteins were incubated with the beads for 1.5 h at 4 °C while rotating. The beads were then washed five times with 0.5 ml wash buffer. After removing residual wash buffer, 50 µl of wash buffer supplemented with 40 mM maltose was added to the beads and incubated for 1 h at 4 °C while rotating. The eluates were collected, mixed with SDS loading dye and ran on a Novex Tris-Glycine 4–12% 1.0 mm WedgeWell gel (Thermo Fisher Scientific) for 30 min at 180 V. The gel was stained with Coomassie blue (Vienna BioCenter Molecular Biology Service).
WDR83–GPATCH1 and biotin-tagged YJU2B peptide
Of either wild-type or mutant (M146A L149K E150K) YJU2B peptide (134–178), which was predicted to interact with WDR83, 80 µl was added at 25 µM to 80 µl StrepTactin Sepharose bead slurry (IBA) equilibrated in wash buffer (25 mM HEPES-NaOH pH 7.9, 50 mM NaCl, 1 mM TCEP, 5 mM MgCl2, 0.05% v/v Igepal CA-630 and 10% v/v glycerol). The beads were incubated with the peptides for 1 h at 4 °C while rotating and then washed four times with 0.4 ml of wash buffer. The washed beads containing the immobilized peptides were split into two samples and incubated either with or without 80 µl of the WDR83–GPATCH1(560–651) complex at 29 µM. The WDR83–GPATCH1(560–651) complex was also incubated with the beads lacking immobilised peptides as a background binding control. The salt concentration in all samples was adjusted to 50 mM NaCl and incubated at 4 °C for 2 h while rotating. The beads were then washed five times with 0.5 ml wash buffer. After removal of residual wash buffer, 80 µl of wash buffer supplemented with 50 mM biotin was added to each reaction and incubated for 1 h at 4 °C while rotating. The eluates were collected, mixed with SDS loading dye and ran on a Novex Tris-Glycine 4–12% 1.0 mm WedgeWell gel (Thermo Fisher Scientific) for 25 min at 180 V. The YJU2B peptides were visualized by fluorescence signal at 488 nm on a ChemiDoc imager (Bio-Rad). The gel was then stained with Coomassie blue (Vienna BioCenter Molecular Biology Service) to visualize WDR83. The band corresponding to GPATCH1 in a Coomassie-stained gel could not be unambiguously identified, because its band overlaps with the bands of the YJU2B peptides.
DBR1 depletion rescue experiment
HEK293T homozygous DBR1–dTAG-V5 cells containing the doxycycline-inducible mScarlet-tagged DBR1 constructs (wild type, catalytic mutant (H85A) and deletion of peptide I residues 420–434 (Δpep1)) as well as a control line lacking DBR1 overexpression were mixed 1:1 with wild-type HEK293T cells that constitutively expressed GFP. Cells were split into two wells: one well was treated with the 500 nM dTAGv-1 compound, whereas the other well was left untreated to serve as a control. Expression of the DBR1 constructs was induced using 1 µg ml−1 doxycycline. Cells were split at a ratio of 1:3 every day to prevent them from reaching confluency. The percentage of GFP+ cells was measured using an iQue Screener Plus high-throughput cytometer (Sartorius AG) immediately after mixing and again after 8 days. The average percentage of GFP− cells per line was calculated from technical triplicates across three biological replicates and served as a proxy for cell growth phenotype.
Relative expression levels of the inducible DBR1 constructs were measured as the mScarlet signal in each well after 1 day, when the GFP signal, and hence, cell viability, did not differ across conditions. The average mScarlet signal was then normalized to that of the wild-type DBR1 construct.
In vitro ILSAQR-to-DIS remodelling assay
Of nuclear extract prepared from K562 cells stably overexpressing EGFP-tagged YJU2B, 120 µl was incubated with the recombinant 3×FLAG–DHX35(K83A)–GPATCH1(1−440)–TwStrep complex at various final concentrations (0, 0.5 µM or 4.5 µM) either in the presence or absence of 5 mM ATP. The reactions were incubated at 37 °C for 40 min before being applied to 45 µl GFP Trap bead slurry (Chromotek) equilibrated in wash buffer (20 mM HEPES-KOH pH 7.9, 100 mM KCl, 0.5 mM TCEP, 2 mM MgCl2, 0.05% v/v Igepal CA-630 and 8% v/v glycerol) supplemented with 2 mg ml−1 BSA. The binding reactions were incubated for 1.5 h at 4 °C. The beads were then washed three times with wash buffer and twice with harsh wash buffer (20 mM HEPES-KOH pH 7.9, 200 mM KCl, 0.5 mM TCEP, 2 mM MgCl2, 0.1% v/v Igepal CA-630 and 8% v/v glycerol). The proteins immobilized on the beads were eluted in 60 µl detergent-free wash buffer (20 mM HEPES-KOH pH 7.9, 100 mM KCl, 0.5 mM TCEP, 2 mM MgCl2, 8% v/v glycerol) supplemented with 0.1 µg ml−1 3C protease for 1 h at 4 °C.
The eluates from all samples were then analysed by western blot using standard protocols with the antibodies to spliceosome proteins YJU2B (CAS OAAB02156, Aviva Systems Biology; dilution 1:100), PRP8 (CAS AB190347, Abcam; dilution 1:1,000), BRR2 (CAS AB241589, Abcam; dilution 1:1,000), AQR (CAS A302-546A, Bethyl Laboratories; dilution 1:1,000), TFIP11 (CAS PA5-49275, Invitrogen; dilution 1:1,000), C19L1 (CAS 31700-1-AP, Proteintech; dilution 1:5,000) and C19L2 (CAS 24872-1-AP, Proteintech, dilution 1:200). 3×FLAG–DHX35(K83A) and GPATCH1(1−440)–TwStrep were detected using antibodies to FLAG (CAS F3165, Sigma-Aldrich; dilution 1:500) and Strep (CAS 2-1509-001, iba; dilution 1:10,000) tags, respectively.
RNA sequencing assayExtraction of spliceosome-associated RNA
For RNA sequencing, endogenous human DIS was purified by anti-GFP affinity purification and gradient ultracentrifugation as described above for cryo-EM sample preparation, except that no glutaraldehyde was added to the gradient and that the pooled spliceosome-containing gradient fractions were not concentrated.
Endogenous human ILS″ for the deletion rate experiment and endogenous human ILSAQR for the read truncation experiment were purified from K562 cells stably overexpressing TFIP11–GFP or YJU2B–GFP, respectively, using anti-GFP affinity purification and gradient ultracentrifugation as described above and previously2, except that no glutaraldehyde was added to the gradient and the peak gradient fractions were not concentrated.
The pooled spliceosome fractions were incubated with 0.4 mg ml−1 proteinase K in 2 mM EDTA and 0.04% SDS for 1.5 h at 37 °C with gentle shaking. A 0.1 volume of 7.5 M ammonium acetate was added to the sample and mixed thoroughly. One volume of phenol-chloroform solution (ITW reagents) was added to the sample and briefly vortexed. The sample was spun down at 20,000g for 5 min. The top aqueous layer containing nucleic acids was transferred to a fresh tube, mixed with 2 volumes of isopropanol and 0.002 volumes of GlycoBlue co-precipitant (Thermo Fisher Scientific), and incubated overnight at −20 °C. The sample was then centrifuged at 20,000g for 5 min at 4 °C. The supernatant was removed, and the remaining pellet was washed in ice-cold 70% ethanol. The washed pellet was briefly air dried and resuspended in 10 µl nuclease-free water.
Preparation of short-read sequencing libraries (read truncation experiment)
For each sample, 3 µl of RNA was polyadenylated by incubating in a reaction containing 2 µl 5×SSIV reaction buffer (Invitrogen), 0.25 µl E. coli polyA polymerase (NEB), 0.25 µl RNasin (Promega), 0.25 µl 0.1 M dithiothreitol (Invitrogen) and 0.5 µl 0.5 mM ATP (Invitrogen) at 37 °C for 15 min. The samples were placed on ice, diluted with 9.25 µl water, then heated at 95 °C for 4 min to fragment the RNA. To anneal reverse transcription primers, 1 µl of 10 mM dNTPs and 1 µl of 10 µM dT(22)V-P7 primer were added, and the samples were heated to 65 °C for 5 min before cooling to 42 °C. To initiate reverse transcription, 2 µl of 5×SSIV reaction buffer (Invitrogen), 0.5 µl 0.1 M dithiothreitol (Invitrogen) and 0.5 µl SSIV enzyme (Invitrogen) were added to the samples, and the reactions were incubated at 42 °C for 20 min. The reactions were cooled to 37 °C and incubated with 2 µl exonuclease I (NEB) for 15 min to remove excess reverse transcription primers. To further remove excess RT primers, the samples were size selected using SPRI beads with a final PEG8000 concentration of 7.5% and a final isopropanol concentration of 22.5%. The samples were eluted from the beads, then RNA was hydrolysed by the addition of 1 µl 1 M NaOH and incubated at 95 °C for 10 min. The pH of the samples was then neutralized by the addition of 1 µl 1 M HCl and 10 µl 1 M HEPES pH 7.9. The cDNA was then purified using 2 volumes of SPRI beads and 3 volumes of isopropanol. The cDNA was eluted in 5.3 µl water, to which 1 µl DMSO and 2 µl 10 µM L01clip2.0 adapter was added. The mixture was heated to 75 °C for 2 min and then placed on ice. Adapter ligation was initiated by the addition of 2 µl 10× T4 RNA ligase reaction buffer (NEB), 0.2 µl 100 mM ATP (NEB), 9 µl 50% PEG 8000 (NEB) and 0.5 µl T4 RNA ligase 1 high concentration (NEB), and the reactions were incubated overnight at room temperature. The reaction was size selected using 20 µl SPRI beads and 13.33 µl isopropanol (final concentration of 25%). The resulting cDNA was amplified in a 50 µl quantitative PCR using Illumina-compatible i5/i7 indexed primer pairs and NEBNext Ultra II Q5 (NEB) according to the manufacturer instructions until the libraries appeared to amplify linearly. The resulting libraries were purified using 1.5 volumes of SPRI beads, then sequenced using a NovaSeqX 10B XP 2 × 150bp flow cell (Illumina) at the VBCF Next Generation Sequencing Facility.
Analysis of short-read sequencing data (read truncation experiment)
Complete reproduction of all data analysis from the raw sequencing data to the final plots can be performed by executing the Snakemake pipeline (https://github.com/rfara/spliceosome_disassembly). In brief, all read pairs were trimmed of adapter and polyA sequences using cutadapt (v4.9) and UMI sequences were extracted using UMI-tools (v1.1.5) pre-mapped against the full human rDNA repeat sequence and GENCODE (v44) basic snRNA sequences using bowtie2 (v2.5.4). Unmapped reads pairs were mapped using STAR (v2.7.11b) against the GRCh38 primary assembly and GENCODE (v44) basic annotation. Uniquely mapping reads were deduplicated using umitools (v1.1.5). Introns and exons were defined using MANE Select transcripts from GENCODE (v44). Branchpoint locations were obtained from publicly available CoLa-seq data75, and the highest scoring branchpoint per intron was used for analysis. Read pairs for which the 3′ end mapped to the 3′ SS were considered to be derived from excised introns.
Preparation of long-read sequencing libraries (deletion rate experiment)
Of RNA, 5.5 µl was poly-adenylated by addition of 7 µl of the poly-adenylation reaction mix (4 µl 5X SuperScript IV RT buffer (Invitrogen), 1 µl 10 mM ATP, 1 µl 100 mM dithiothreitol, 0.5 µl RNasin (Promega) and 0.5 µl E. coli polyA polymerase (NEB)) and incubation at 37 °C for 20 min. To begin primer annealing, 1 µl of 25 mM dNTPs and 1 µl of 10 µM barcoded reverse transcription primer were added to the reaction, and the reaction was heated to 65 °C for 3 min. The reaction was cooled to 42 °C, and reverse transcription was initiated by the addition of 5.5 µl of the pre-heated reverse transcription mix (4 µl 5 M betaine, 0.5 µl 40 µM template switching oligo, 0.5 µl 200 mM MgCl2 and 0.5 µl SuperScript IV (Invitrogen)). The reaction was incubated at 42 °C for 1 h, then purified using homemade SPRI beads at a ratio of 1.8X. Library amplification quantitative PCR was performed using PCR mix (NEBNext Ultra II Q5 Master Mix, 1X EvaGreen (Biotium) and 500 mM partial P5 and P7 primers) with a long extension time (98 °C for 10 s, 69 °C for 20 s and 72 °C for 3 min 30 s). Samples were removed when linear amplification was observed and subsequently purified with 1.5X SPRI beads. The resulting libraries were quantified using the Qubit HS DNA kit, and the distribution of fragment sizes was quantified using the Fragment Analyzer. The libraries were sequenced using a Nanopore R10.4.1 Flow Cell.
Analysis of long-read sequencing data (deletion rate experiment)
The raw Nanopore data were base called using Dorado (v0.9). The libraries were demultiplexed and trimmed of adapter sequences and polyA sequences using cutadapt (v5.0). The reads were then mapped sequentially with minimap2 (v2.29)76 to rRNA sequences, snRNA sequences, spliced transcriptomic sequences and the genome, with the unmapped reads from mapping to each reference being passed to the next mapping. All reference sequences were derived from the hg38 human genome and the GENCODE (v44) annotation.
Branchpoint locations were annotated by CoLa-seq75. Deletion positions within reads were identified, with the value of a deletion being divided by the length of the deletion, and metaprofiles of the deletions were calculated relative to these branchpoint positions by summing the deletions at every position and dividing by the number of input reads. For the proportion of spliced transcripts to intronic reads, the total number of transcriptomic mapping reads and intron mapping reads was used.
DIS release assaySample preparation
Of nuclear extract from K562 cells expressing either wild-type DHX35 or mutant DHX35(K83A), 3 ml was applied to 500 µl GFP Trap bead slurry (Chromotek) equilibrated in wash buffer (20 mM HEPES-KOH pH 7.9, 100 mM KCl, 0.5 mM TCEP, 2 mM MgCl2, 0.05% v/v Igepal CA-630 and 8% v/v glycerol). The beads were incubated for 3 h at 4 °C with gentle mixing. The beads were then washed five times with 3 ml wash buffer, transferred to fresh tubes and washed five more times with 1.5 ml detergent-free wash buffer (20 mM HEPES-KOH pH 7.9, 100 mM KCl, 0.5 mM TCEP, 2 mM MgCl2 and 8% glycerol). A small volume of both wild-type and mutant DHX35 bead samples was removed, incubated with 180 µl detergent-free wash buffer supplemented with 0.1 µg ml−1 3C protease overnight at 4 °C to elute the bound DIS complexes that represented an assay input. The rest of the beads of the wild-type and mutant DHX35 samples were both distributed across six fresh tubes each, resulting in three technical replicates per sample. After removing residual wash buffer, 120 µl detergent-free wash buffer was added to each tube and incubated for 15 min at 37 °C to allow temperature equilibration, which may cause nonspecific dissociation of various proteins from the beads. The supernatant was then removed and 120 µl detergent-free wash buffer supplemented with 20 mM MgCl2 and either 10 mM ATP or 10 mM ADP was added to three tubes each of both the wild-type and mutant DHX35 samples. The assays were incubated for 30 min at 37 °C shaking at 800 rpm. The samples were then spun down, and the supernatants containing the proteins released from the beads were collected, run for 3 min at 180 V on a Novex Tris-glycine 4–12% 1.0 mm WedgeWell gel (Thermo Fisher Scientific) and submitted to the Vienna BioCenter Mass Spectrometry Facility for in-gel tryptic digestion and LC–MS/MS analysis.
Release assay analysis
The resulting raw MS data were processed for protein identification and label-free quantification. We found that one replicate of the DHX35(K83A) ADP sample had not been injected correctly for LC–MS/MS, leaving two instead of three technical replicates for this condition. To identify the proteins that are released from the beads upon ATP treatment, protein abundances in each ATP sample were compared with protein abundances in the corresponding ADP samples. The samples of wild-type DHX35 and DHX35(K83A) were compared separately to account for potential differences in the starting protein amounts on the beads. Proteins were considered significantly enriched based on statistical tests (moderated t-test in limma, P < 0.05) and an arbitrary log2 fold-change cut-off of 1 (twofold enrichment over control on a linear scale). Data were visualized in GraphPad Prism 10.
Release assays were also analysed by western blot using standard protocols to validate that DHX35 that could not be detected by MS was not non-specifically released from the beads. Input samples as well as the released protein samples form a single replicate of wild-type DHX35 and DHX35(K83A) each were probed with the antibodies to the spliceosomal proteins DHX35 (CAS HPA062700, Sigma; dilution 1:250), WDR83 (CAS PA-60143, Invitrogen; diluted 1:500), BRR2 (CAS AB241589, Abcam; dilution 1:1,000), PRP19 (CAS AB228694, Abcam; dilution 1:1,000) and CWC15 (CAS 25293-1-AP, Proteintech; dilution 1:1,500). The primary antibodies were incubated with the milk-blocked membranes overnight at 4 °C. A horseradish peroxidase-coupled goat anti-rabbit secondary antibody (CAS 31466, Invitrogen; dilution 1:10,000) was applied to each membrane before developing with Pierce ECL reagent (Thermo Fisher Scientific).
Reporting summary
Further information on research design is available in the Nature Portfolio Reporting Summary linked to this article.