Knowledge graph construction
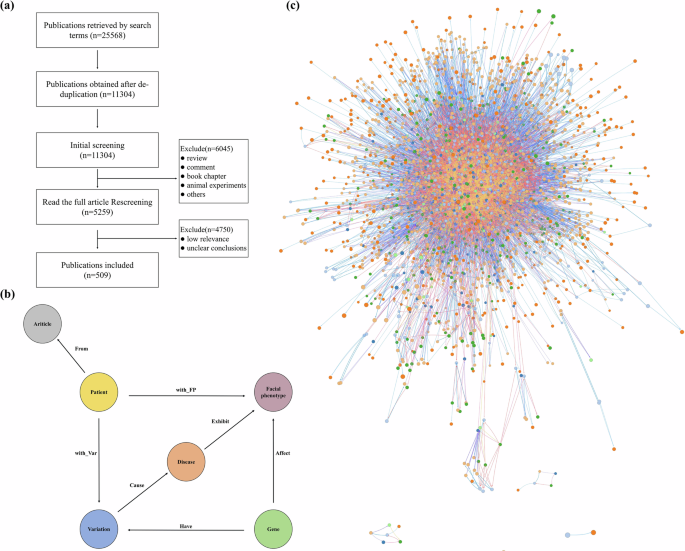
First, our research conducted a comprehensive search of the Pubmed database using search terms generated by HPO, and 509 relevant publications on facial phenotype-associated rare genetic diseases were selected after screening, the screening process is shown in Fig. 4a.
Fig. 4: The process of knowledge graph construction.
a The screening process. A total of 25,568 relevant publications were retrieved, and 509 publications remained after screening. b The structure of FPKG. The entities were categorized into five types, i.e., Facial phenotype, Gene, Disease, Patient, and Article. The relationships of these five entities were categorized into seven: Affect, Cause, From, Exhibit, Have, with_FP, with_Var. c Overview of FPKG using GraphXR. The knowledge graph includes 6,143 nodes and 19,282 relationships.
Second, Fig. 4b shows the structure of the FPKG. Based on this structure, we used tools such as PhenoTagger38, PubTator39, and Esearch40 to extract the entities, and then manually identified the relationships between them. After several manual reviews, the structured data was formatted and stored in the Neo4j graphical database.
Finally, Fig. 4c shows the visualization of the complete KG, which makes the understanding of content and relationships more intuitive.
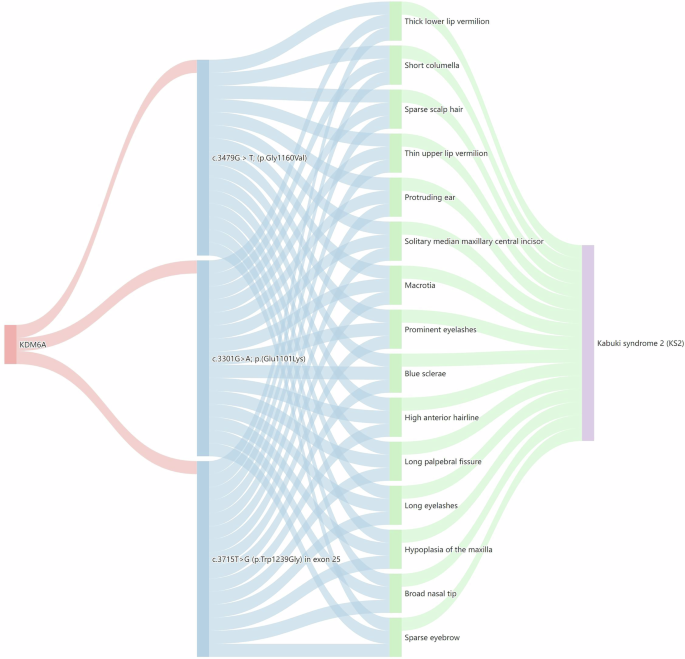
Table 6 shows the statistical information of FPKG, including six types of nodes and seven relationships. Fig. 5 shows the Sankey diagram analysis of KDM6A(URL), more results of the Sankey diagram analysis are shown in the Supplementary Figs. 1–4.
Fig. 5: Sankey diagram analysis of KDM6A.
The diagram is structured into four layers, starting with the KDM6A gene in the first layer, followed by variant details in the second layer. The third layer displays associated facial phenotypes, and the fourth layer details rare genetic diseases linked to these variants.
Table 6 Knowledge graph statistics, including 6 node types and 7 relationship typesRetrieval-augmented generation
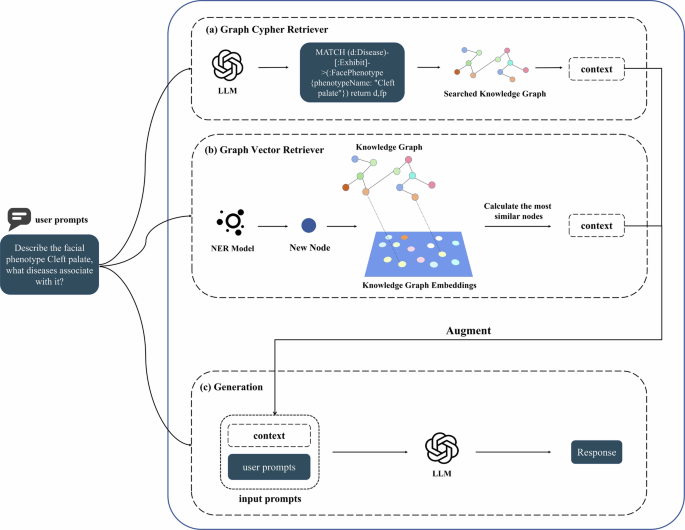
Graph Cypher Retriever: Upon receiving a user query, cypher queries are generated through an LLM to find relevant information in the KG. This queried knowledge is then entered into the LLM as contextual prompts along with user prompts to generate the final response. This approach utilizes the structured data in the KG to ensure the accuracy and relevance of the answer.
Graph Vector Retriever: Upon receiving a user query, firstly the well-trained Named Entity Recognition (NER) model identifies the entities in the query, which is then added as a node to the KG and the graph is embedded as vector representation, and finally the K nodes with the highest cosine similarity and their neighbors as a subgraph to construct context prompts, which are inputted into the LLM along with the user prompts to generate the final response.
In particular, Graph Cypher Retriever is able to accurately locate the most suitable context in the KG but its effectiveness depends on the ability of the LLM to generate cypher queries. Graph Vector Retriever, on the other hand, is able to identify and retrieve the most similar subgraph to the query as contexts, which makes it effective even when cypher generation is weak. Graph cypher retriever and graph vector retriever pipelines are shown in Fig. 6.
Fig. 6: The pipeline of two types of Graph RAG.
a Graph Cypher Retriever. A LLM generates cypher queries to retrieve relevant information from the KG as context. b Graph Vector Retriever. A well-trained NER model identifies entities in the query as nodes to be added to the KG and embedded as vector representations, and finally, the K nodes with the highest cosine similarity and their neighbors are used as subgraphs to build the context. c Generation. The retrieved context is entered into LLM along with the user prompt to get the final response.
NER Model: Named Entity Recognition (NER) has been widely used in the biomedical field. For example, BioBERT41 is capable of recognizing specific biomedical entities, while PhenoTagger38 excels in recognizing HPO concepts. However, there is no NER model that can comprehensively cover all the key information in this field, such as basic patient information (age, gender, race), genetic variation information (genes, mutations), and phenotypic information (facial phenotypes).
In view of this, we curated a comprehensive NER corpus, which contains information on the three types mentioned above. Considering the difficulty of reproducing the existing NER models, we chose to train on Bert-base. The NER corpus and model weights were published in our Github and huggingface, respectively, and subsequently applied to the graph vector retriever. The validation metrics of our NER model are shown in Supplementary Table 3.
Graph Embedding Algorithm: In graph vector retriever, we need to transform the KG into vector representation while ensuring that as much key information as possible is retained. To evaluate which graph embedding algorithms are able to preserve the most graph structure and feature information, we implemented a node classification task on FPKG, firstly, different graph embedding algorithms were used to transform the graph into vector representation with the types of nodes as labels, and random forest was used to predict the labels of the test set, to evaluate the F1 score of different algorithms.
In this way, we can quantify the efficacy of various embedding algorithms in preserving graph structure and feature information, and then select the optimal graph embedding algorithm to improve the overall retrieval accuracy. We evaluate several graph embedding algorithms as shown in Table 7, and GLEE42 performs the best.
Table 7 Graph embedding algorithms evaluationDatasets construction
To quantitatively evaluate LLMs’ performance in the domain of rare genetic diseases, we designed three benchmark datasets. The description, data source, data size, and coverage of the dataset used in the experiments are shown in Table 1.
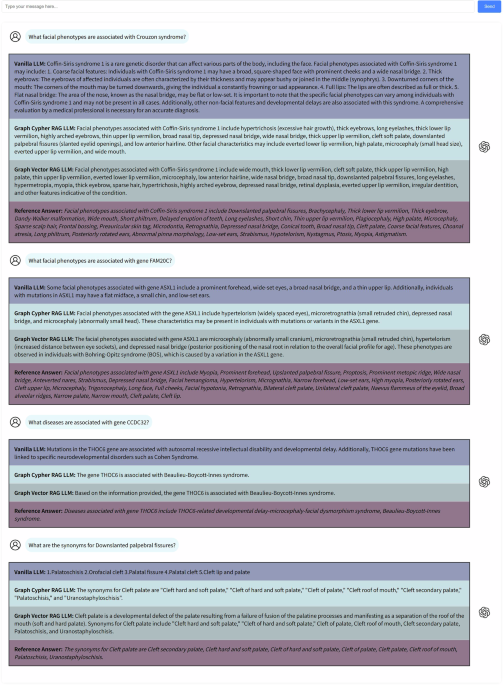
The Domain knowledge set comprises four tasks: (1) facial phenotype-disease association queries, (2) facial phenotype-gene association queries, (3) disease-gene association queries, and (4) facial phenotype synonym queries. Each task consists of 25 questions, each paired with a standardized reference answer formulated by researchers (J.S., B.S.) based on the HPO.
The Publication set and GMDB set comprises diagnostic test questions that include patient demographics (age, gender, ethnicity), genetic mutations, and facial phenotypes, requiring LLMs to generate precise diagnoses. Both sets contain two subsets featuring identical questions but presented in distinct formats (selective and non-selective), each consisting of 100 questions. Selective questions provide LLMs with predefined answer options, thereby facilitating the evaluation of their capacity to make informed selections based on the provided information. Conversely, non-selective questions require LLMs to autonomously generate responses by leveraging their intrinsic knowledge and reasoning capabilities, offering a more comprehensive assessment. When employed in combination, these two subsets provide a more thorough evaluation of the LLMs’ performance.
The Publication set consists of cases collected from the published research literature, while the GMDB set is sourced from the GestaltMatcher Database43 (GMDB), an expert-curated rare genetic disease database. In the selective questions, each question presented four options: one correct answer paired with three incorrect options randomly selected from a pool of 225 diseases (encompassing the full spectrum of diseases in FPKG). For the GMDB set, the incorrect options were randomly chosen from a larger pool of 581 diseases (encompassing the full spectrum of diseases in GMDB).
The three datasets are all publicly available on our GitHub repository (https://github.com/zhelishisongjie/Facial-Phenotype-RAG). An example of a diagnostic question is shown in Table 8, with patients from this research44.
Table 8 An example of diagnostic questionImplementation details
In this study, we made the relevant code, KG, corpus, and NER model publicly available with the aim of increasing the transparency of the study and providing the necessary detailed information, and these resources are available in our GitHub repository (https://github.com/zhelishisongjie/Facial-Phenotype-RAG).
The prompt templates used for Cypher generation, Vanilla LLMs, and RAG LLMs are provided in Supplementary Table 1. The temperature parameter was set to 0.1 for the domain knowledge QA, diagnostic tests, and consistency evaluation. The LLMs were all queried via API, and the introduction to LLMs is shown in Supplementary Table 2.
NER training: We train the model for 100 epochs with a batch size of 32 using the Adam optimizer at a learning rate of 5e-5, employing early stopping based on validation F1 score as our primary metric. Validation metrics include precision, recall, and F1-score. The validation performance of our NER model is shown in Supplementary Table 3.
Domain knowledge QA: The questions were designed to cover associations between facial phenotypes, genes, and diseases. The terms were selected from the HPO and manually constructed into questions. The reference answer formulated by researchers (J.S., B.S.) based on the HPO. The evaluation metrics include BertScore25 and coverage, where BertScore assesses the semantic similarity between the LLM answer and the reference answer, and coverage assesses how many of the points made in the LLM answer can be found in the reference answer, ensuring that the answer is not only relevant but also accurate. For example, the reference answer contains 23 phenotypes and the Vanilla LLM mentions 4 of them, resulting in a calculated coverage of 17.39%. In this section, the LLM we assessed is GPT-3.5-turbo.
Diagnostic Tests: For both the Publication set and GMDB set, we conducted five repeated queries for each question across all LLMs. Each response was manually evaluated for correctness. The final performance metric was derived by calculating the average accuracy across all five queries.
Consistency Evaluation: Based on the diagnostic test responses, we assessed the consistency of answers by querying each question five times and calculating the average consistency score. Consistency was defined as the proportion of the most frequent answer among the five responses to a given question. For example, if three out of five responses were identical, the consistency would be 60%. In this evaluation, only the specific disease identified by the LLM was considered; any additional explanatory content was excluded from the consistency analysis.
Temperature Analysis: We systematically evaluated temperature effects across a broad range (T = [0.0, 0.2, 0.4, 0.6, 0.8, 1.0]), conducting single queries per temperature point for each question. Diagnostic accuracy was then calculated for each LLM under different temperature conditions. In this experiment, we select GPT-3.5-turbo, GPT-4o, GPT-4-turbo for analysis. The RAG σ Reduction metric represents the average reduction in variability achieved by both Cypher-RAG and Vector-RAG implementations compared to Vanilla LLMs.

