
Mouse lines and animal care
Experiments were performed in accordance with the guidelines for animal care of the Institutional Animal Care and Use Committees (IACUC) of the University of North Carolina at Chapel Hill (animal protocol approval # 16-291) and the University of Pennsylvania (animal protocol approval # 807277). Mouse (Mus musculus) lines were maintained in the C57BL/6J background by regular backcrossing to the C57BL/6 J line (Jackson laboratory, stock number 000664). SKM-specific AnkB knockout (SKM-AnkB-KO) mice were generated by breeding homozygous floxed were crossed with heterozygous HSA-Cre mice to generate mice with SKM-specific targeting of GFP to the OMM for PLA evaluations. All studies were performed using 4-mo or 20-mo male mice housed at 22 ± 2 °C on 12-hr light/dark cycles and given food and water ad libitum. For high-fat diet (HFD) studies, mice were fed a rodent diet with 60 kcal% of fat (Research Diet, D12492) for 15 weeks starting a week after weaning.
Plasmids
AnkB-HA and AnkB-GFP were previously described29,33,54. mCherry-Drp1 (Addgene plasmid #49152) and GFP-Mff (Addgene plasmid #49153) were gifts from Dr. Gia Voeltz21. MiD51-GFP and MiD49-GFP were gifts from Dr. Henry Higgs95. The pCas9-2A-GFP-puro-gRNA plasmid was a generous gift from Dr. Dale Cowley. Plasmids were verified by full-length sequencing. To generate the AnkB220-GFP adenoviral plasmid, an AnkB220-GFP fragment was amplified by PCR from peGFPN3/AnkB-GFP27,29 with primers 5’-ctagcctcgaagatctatgatgaacgaagatgcagctcaga-3’ and 5’- tttggccccgcggccgcgcggccgctttact-3’. The PCR product was cloned into the pDUAL-CCM(+)-AdV shuttle (Vector Biolabs) linearized by BglII/NotI restriction digestion using In-Fusion® Snap Assembly Master Mix (Takara, 638947). All plasmids were verified by full-length sequencing.
Cell lines and cell culture
Muscle fibers were isolated from FDB muscle96. In brief, FDB muscle was digested in DMEM containing 0.2% collagenase (Sigma, 10103578001) for 2-hr with gentle agitation. Digested muscles were transferred to 35-mm culture dish containing 10% horse serum and triturated with a wide-bore Pasteur pipette to release individual myofibers. Fibers were seeded on Matrigel-coated (Corning, 358234) glass-bottom dishes (Cellvis, D35-20-1.5H) and cultured at 37 °C and 5% CO2 in fiber media (DMEM, 20% fetal bovine serum (FBS), 1% penicillin/streptomycin) for 24 hours. HEK 293 T/17 cells were obtained from ATCC (CRL-11268) and maintained in DMEM containing 10% FBS and 1% pen/strep at 37 °C with 5% CO2. The mouse C2C12 myoblast cell line was obtained from ATCC (CRL1772) and grown in DMEM containing 1% penicillin/streptomycin and 10% FBS. HEK 293 T/17 and C2C12 cells were authenticated by ATCC based on its short tandem repeat profile and have recurrently tested negative for mycoplasma contamination.
AnkB-KO C2C12 were generated using CRISPR-Ca9 editing. In brief, C2C12 were electroporated with 20 µg of pCas9-2A-GFP-puro-gRNA, either empty vector without gRNAs (control line), or containing gRNA sequences targeting exon 22 of mouse AnkB (Ank2) [mAnk2-E22-g1 (TCACCCCAGCCGCTTAGCAATCGCC); mAnk2-E22-g2 (CACCAACCTTCAGGGTGTCAACCA); mAnk2-E22-g3 (CACCCCTGAAGGTTGTGACTGAAG)]. GFP-expressing C2C12 cells were selected in culture media supplemented with puromycin (2 µg/mL) for two weeks. Cells passage numbers 5-8 were used for experimentation.
Protein extraction
Lysates from flash-frozen muscles or HEK 293 T/17 were prepared in homogenization buffer (25 mM Tris-HCl, 150 mM NaCl, 0.32 M sucrose, 1% Igepal (NP40) (v/v), 1% Triton X 100 (v/v), 0.5% CHAPS (wt/v), 5 mM EDTA, pH 7.4) supplemented with EDTA-free protease inhibitor cocktail (Sigma, cat# 4693159001). Total protein homogenates were centrifuged at 20,000 x g for 20 min at 4 °C and the soluble fraction collected for immunoprecipitation or western blot analysis.
Mitochondria isolation
Mitochondria were isolated from fresh GC muscle of 4-mo C57BL/6 J mice following a reported protocol97,97,. Briefly, muscle was minced in hypotonic isolation buffer (67 mM sucrose, 50 mM Tris/HCl, 50 mM KCl, 10 mM EDTA and 0.2% BSA, pH 7.4), digested in 0.05% trypsin for 30 min on ice, and homogenized with a Dounce homogenizer. Homogenates were cleared of nuclei and tissue debris by centrifugation at 700 g for 10 min at 4 °C, and mitochondria were purified by centrifugation at 8000 g at 4 °C for 10 min. The mitochondrial pellet was resuspended in 200 mM D-mannitol, 70 mM sucrose, 5 mM EDTA, and 10 mM Tris-HCl, pH 7.4, and further centrifuged at 8000 g at 4 °C for 10 min to remove residual BSA.
For respiration analysis, mitochondria were resuspended in MiRO5 respiration media (110 mM sucrose, 20 mM HEPES, 10 mM KH2PO4, 20 mM taurine, 60 mM K-lactobionate, 3 mM MgCl2•6H20, 0.5 mM EGTA, 1 g/L BSA (fraction V), pH 7.2). For western blot and BCA analysis, mitochondria were lysed in homogenization buffer (25 mM Tris-HCl, 150 mM NaCl, 0.32 M sucrose, 1% Igepal (NP40) (v/v), 1% Triton X 100 (v/v), 0.5% CHAPS (wt/v), 5 mM EDTA, pH 7.4) supplemented with EDTA-free protease inhibitor cocktail (Sigma, cat# 4693159001). Mitochondria lysates were further mixed with 5x SDS-PAGE buffer (5% SDS (wt/vol), 25% sucrose (wt/vol), 50 mM Tris pH 8, 5 mM EDTA, bromophenol blue) at 95 °C and sonicated to ensure complete solubilization. Samples were analyzed by western blot to evaluate purity and presence of ankyrin-B.
Immunoblots
Protein extracts were mixed at a 1:1 ratio with 5x SDS-PAGE buffer and heated for 15 min at 65 °C. Protein concentration was determined using a BCA assay (Thermo Fisher, 23225), and equal amounts of proteins were loaded onto acrylamide gels and resolved by SDS-PAGE. Immunoblots to evaluate SKM ankyrins were run using house-made 3.5-17.5% acrylamide gradient gels in Fairbanks Running Buffer (40 mM Tris pH 7.4, 20 mM sodium acetate, 2 mM EDTA, 0.2%SDS (wt/vol)). For all other immunoblots, samples were separated using 4-20% gels Novex™ Tris-Glycine Plus Midi Protein Gels (Thermo Fisher, WXP42020BOX) or 4–15% Criterion™ TGX™ Precast Midi Protein Gel (Bio-Rad, 5671084) using Tris-glycine running buffer (APEX, 18-238). Proteins were transferred overnight onto 0.45-μm nitrocellulose membranes (BioRad, 1620115) at 4 °C. Transfer efficiency and total protein content were determined by Ponceau-S stain (0.1% Ponceau wt/vol, 0.1% acetic acid), Revert 700 (LI-COR, 926-11011), or Revert 520 (LI-COR, 926-10011) total protein stain. Membranes were blocked in TBS containing 5% non-fat milk for one hour at RT and incubated overnight with primary antibodies diluted in antibody buffer (TBS, 5% BSA, 0.1% Tween-20). After three washes in TBST (TBS, 0.1% Tween-20), membranes were incubated with secondary antibodies diluted in antibody buffer for two hours at RT. Membranes were washed 3x for 10 min with TBST and 2x for 5 min in TBS. Protein-antibody complexes were detected using the Odyssey® M Imaging system (LI-COR) running LI-COR Acquisition Software version 1.1.0.61. Signal intensity in blots was quantified using the Empiria Studio Software version 2.2.0.141 and normalized to Ponceau S stain, Revert 700, or Revert 520 total protein stains.
Affinity-purified rabbit antibodies anti ankyrin-B, ankyrin-G, βII-spectrin, and GFP, used at a 1:1000 for western blot, were generated by Vann Bennett’s laboratory at Duke University and have been previously described27,28,29,30,32,33,54,59,60,61,. Other antibodies used for western blot analysis included rabbit anti-AnkR (Aviva Sys Bio, ARP42566-T100, 1:500), rabbit anti-dystrophin (Thermo Scientific, PA1-37587, 1:500), mouse anti-SERCA (Affinity Bioreagents, MA3-911, 1:1000), mouse anti-OPA1 (BD Transduction, 612606, 1:1000), mouse anti-p62 (Abnova, H00008878-M01, 1:500), and Abcam antibodies, mouse anti-total rodent OXPHOS antibody cocktail (ab110413, 1:1,000) and rabbit anti-GAPDH (ab9485, 1:1,000). We also used rabbit antibodies specific for total AMPK (2757), phospho-AMPKT172 (2535), total Raptor (2280), phospho-RaptorS792 (2083), HA epitope (3724), phospho-Drp1Ser616 (3455), phospho-Drp1Ser637 (4867), and total Drp1 (8570), as well as mouse anti-Lamin A/C (4777), and mouse anti-Parkin (4211S), all purchased from Cell Signaling Technology and used at a 1:1000 dilution. Commercial rabbit antibodies specific for COXIV (11242-I-AP), mCherry (26765-I-AP), MFF (17090-1-AP) and Fis1 (10956-1-AP) were obtained from Proteintech and used at 1:1000, except for CPT1B (22170-1-AP) which was used 1:500 dilution. Mouse anti-Na/K ATPase (48645), anti-MFN1 (166644), and anti-MFN2 (515647) antibodies were from Santa Cruz Biotechnology and used at 1:1000. Fluorescent signals in western blots were detected using IRDye® 680RD goat anti-mouse (926-68070) and IRDye® 800CW goat anti-rabbit (926-32211) from LiCOR at a 1:5000 dilution.
MFF and Drp1 oligomerization assessment
Oligomeric states of MFF and Drp11 were evaluated by western blot in total protein lysates prepared from GC and SOL diluted in SDS-PAGE buffer in the absence or presence of DTT (5 mg/mL).
Plasmid transfection and co-immunoprecipitation analysis
Transfections were conducted in triplicate in HEK 293 T/17 cells grown in 6-well culture plates using Lipofectamine RNAiMAX (Thermo Fisher, 13778075) or polyethylenimine (PEI). Interactions between AnkB with either Drp1 or MFF were evaluated in cells transfected with either control Dicer-Substrate Short Interfering RNAs (DsiRNA), IDT DNA, 51-01-08-22) or a cocktail of custom-ordered DsiRNA specific to human AnkB [ANK2: DsRNA1 (rGrArGrArArUrCrArCrArUrUrGrArUrGrUrUrGrUrArArAAT and rArUrUrUrUrArCrArArCrArUrCrArArUrGrUrGrArUrUrCrUrCrUrU), DsiRNA2 (rGrArUrArArGrArCrCrCrUrUrGrArArCrArArCrArArGrAAA and rUrUrUrCrUrUrGrUrUrGrUrUrCrArArGrGrGrUrCrUrUrArUrCrCrA, DsiRNA3 (rCrCrUrGrCrArUrGrUrGrGrCrGrUrUrUrArArArArArUrCAA and rUrUrGrArUrUrUrUrUrArArArCrGrCrCrArCrArUrGrCrArGrGrUrA)]; human Drp1 [DNM1L: DsiRNA1 (rCrArUrGrUrUrUrCrArCrArArGrArArGrArUrArArArCrGGA and rUrCrCrGrUrUrUrArUrCrUrUrCrUrUrGrUrGrArArArCrArUrGrGrA), DsiRNA2 (rGrArUrUrCrArUrArCrUrUrArArArCrCrUrGrArArArGrCAG and rCrUrGrCrUrUrUrCrArGrGrUrUrUrArArGrUrArUrGrArArUrCrArA), DsiRNA3 (rCrCrGrUrGrGrArUrGrArUrArArArArGrUrGrCrUrArCrUTT and rArArArGrUrArGrCrArCrUrUrUrUrArUrCrArUrCrCrArCrGrGrGrU)]; and human MFF [MFF: DsiRNA1 (rArCrUrCrArGrUrUrCrArUrGrCrGrUrGrArArCrArArUrUTA and rUrArArArUrUrGrUrUrCrArCrGrCrArUrGrArArCrUrGrArGrUrArA), DsiRNA2 (rGrArCrCrArGrCrArGrArUrCrUrUrGrArCrCrUrUrArUrUCA and rUrGrArArUrArArGrGrUrCrArArGrArUrCrUrGrCrUrGrGrUrCrUrU)]. 10 nM of each DsiRNA was mixed in Optimem together with 10 nM of TYE 563 DsiRNA transfection control (IDT DNA, 570381937). DsiRNA-lipofectamine RNAiMAX complexes were added to cells. 24-hours post-transfection of DsiRNA complexes, cells were co-transfected with either 2 μg of AnkB-GFP and 1 μg of mCherry-Drp1 plasmids; 2 μg of AnkB-3xHA and 1 μg of MFF-GFP plasmids; 1 μg of mCherry-Drp1 and 1 μg of MFF-GFP plasmids; or 1 μg of mCherry-Drp1 and 1 μg of MiD51-GFP plasmids using PEI. 48 hr after plasmid (72 hr post DsiRNA) transfections. HEK293T/17 cells were either directly collected for native IP or crosslinked with 2 mM DSP at RT for 30 min. The crosslinking reaction was quenched with 1 M Tris-HCl for 15 min at RT. Proteins were extracted in homogenization buffer and soluble fractions loaded to ChromoTek GFP-Trap® Magnetic Particles M-270 (gtd) (Proteintech). Beads were washed three times with TBS with 0.05 Triton-X100, and bound complexes were eluted in 5X SDS-PAGE buffer with DTT at 95 °C. Eluates were resolved by SDS-PAGE and Western blot.
Immunoprecipitation of AnkB complexes from SKM
Total protein lysates from GC and SOL muscle were incubated overnight at 4 °C with Protein A/G magnetic beads (Life Technologies, 88802) coupled to either rabbit anti-ankyrin-B-IgG (AnkB IP)27,28,29,30 or rabbit-IgG (control IP). Beads were sequentially washed with lysis (25 mM Tris-HCl, 300 mM NaCl, and 1 mM EDTA), TBS (10 mM Tris-HCl, 150 mM NaCl, 0.5 mM EDTA) containing 0.1% Triton-X 100, and TBS. Beads were rinsed with 50 mM ammonium bicarbonate and protein complexes eluted in 50 mM ammonium bicarbonate containing 0.1% Rapigest (Waters, 186001861).
LC-MS/MS interaction proteomics analysis
IP eluents were brought to 5% SDS, reduced for 15 min at 80 °C with 10 mM dithiolthreitol, and alkylated with 20 mM iodoacetamide for 30 min at RT. Samples were then supplemented with a final concentration of 1.2% phosphoric acid and 375 µL of S-Trap (Protifi) binding buffer (90% MeOH/100 mM TEAB). Proteins were trapped on the S-Trap micro cartridge, digested using 20 ng/µL sequencing grade trypsin (Promega) for 1 hour at 47 °C, and eluted using 50 mM TEAB, followed by 0.2% FA, and lastly using 50% ACN/0.2% FA. All samples were then lyophilized to dryness. Samples were resuspended in 40 μL of 1% TFA/2% acetonitrile with 12.5 fmol/µL of yeast ADH. Digested peptides were lyophilized to dryness and resuspended in 12 μL of 0.2% formic acid/2% acetonitrile. Each sample was subjected to chromatographic separation on a Waters NanoAquity UPLC equipped with a 1.7 µm HSS T3 C18 75 µm I.D. X 250 mm reversed-phase column (NanoFlow data). The mobile phase consisted of (A) 0.1% formic acid in water and (B) 0.1% formic acid in acetonitrile. 3 µL was injected and peptides were trapped for 3 min on a 5 µm Symmetry C18 180 µm I.D. X 20 mm column at 5 µl/min in 99.9% A. The analytical column was then switched in-line and a linear elution gradient of 5% B to 40% B was performed over 90 min at 400 nL/min. The analytical column was connected to a Fusion Lumos mass spectrometer (Thermo) through an electrospray interface operating in a data-dependent mode of acquisition. The instrument was set to acquire a precursor MS scan from m/z 375-1500 at R = 120,000 (target AGC 2e5, max IT 50 ms) with MS/MS spectra acquired in the ion trap (target AGC 1e4, max IT 100 ms). For all experiments, HCD energy settings were 30 v and a 20 s dynamic exclusion was employed for previously fragmented precursor ions.
Raw LC-MS/MS data files were processed in Proteome Discoverer (Thermo Scientific) and submitted to independent Mascot searches (Matrix Science) against a SwissProt Mouse protein database containing both forward (20260 entries) and reverse entries of each protein. Search tolerances were 5 ppm for precursor ions and 0.8 Da for-product ions using trypsin specificity with up to two missed cleavages. Carbamidomethylation (+57.0214 Da on C) was set as a fixed modification, whereas oxidation (+15.9949 Da on M) was considered a dynamic mass modification. All searched spectra were imported into Scaffold (v4.4, Proteome Software), and scoring thresholds were set to achieve a peptide false discovery rate of 1% using the PeptideProphet algorithm. Potential AnkB interactors were identified as hits showing at least a two-fold enrichment of normalized total spectral counts in AnkB-IP compared to control-IP eluates and a p-value < 0.05. Mitochondria interactors were identified using stringApp (https://apps.cytoscape.org/apps/stringapp) in Cytoscape (version 3.9.0).
RNA isolation and sequencing
Flash-frozen muscles were thawed on ice and lysed in QIAzol Lysis Reagent (Qiagen, 79306) using a bead homogenizer. RNA was isolated using the RNeasy Mini kit (Qiagen, 74106) with on-column DNAse digestion. RNA-sequencing was performed on a Novaseq 6000 platform by Novagene (Sacramento, CA). Differential expressed genes (DEG) were identified using DESeq2 based on a 1.15 log fold change and adjusted p-value > 0.05. Pathway analysis was performed in IPA (QIAGEN Inc., https://digitalinsights.qiagen.com/IPA) and data visualized using Cytoscape.
Quantitative PCR
cDNA synthesis from total RNA isolated from CG and SOL muscles was performed using the SuperScript® III First-Strand Synthesis System (Invitrogen). Quantitative PCR (qPCR) was performed with the QuantStudio 5 Real Time PCR Machine (ThermoFisher) using SYBR Green detection reagent. Transcript levels were normalized to Gapdh (forward 5’-TCAACGGGAAGCCCATCA-3’ and reverse 5’- CTCGTGGTTCACACCCATCA-3’). The following primers were used: Pgc1-α (forward 5’-GGAGCCGTGACCACTGACA-3’ and reverse 5’-GGAGCCGTGACCACTGACA-3’), ERR-α (forward 5’-GGAGGACGGCAGAAGTACAAA-3’ and reverse 5’-GCGACACCAGAGCGTTCAC-3’), NRF1 (forward 5’-TGGAGTCCAAGATGCTAATG-3’ and reverse 5’-AGAGCTCCATGCTACTGTTC -3’), NRF2 (forward 5’-TGAAGTTCGCATTTTGATGGC-3’ and reverse 5’-CTTTGGTCCTGGCATCTCTAC-3’), TFAM (forward 5’-CAAAGGATGATTCGGCTCAG-3’ and reverse 5’-AAGCTGAATATATGCCTGCTTTTC-3’), PPAR-α (forward 5’-AAGGCTATCCCAGGCTTTGC-3’ and reverse 5’-TTTAGAAGGCCAGGCCGATCTC-3’), PPAR-γ (forward 5’-AGGCCGAGAAGGAGAAGCTGTTG-5’ and reverse 5’-TGGCCACCTCTTTGCTCTGCTC-3’), PPAR-δ (forward 5’-GTATGCGCATGGGACTCAC-3’ and reverse 5’-GTCTGAGCGCAGATGGACT-3’), Opa1 (forward 5’-TCACCTCTGCGTTTATTTGAAGA-3’ and reverse 5’-GGGTAGAACGGGAGGAAAGG-3’), and Dnml1 (forward 5’-GGGCACTTAAATTGGGCTCC-3’ and reverse 5’-GGAGAAAAGGGAAGGCGATG-3’).
Mitochondrial to nuclear DNA ratio was determined by quantitative PCR in total DNA isolated from flash-frozen SKM using the QIAamp DNA minikit (Qiagen, 51304). Mitochondrial DNA was quantified using primers for mitochondria-encoded NADH dehydrogenase 1 (Nd1) (forward 5’-CTAGCAGAAACAAACCGGGC-3’ and reverse 5’-CCGGCTGCGTATTCTACGT-3’). Nuclear DNA was assessed using primers specific for nucleus-encoded hexokinase 2 (Hk2) (forward 5’-GCCAGCCTCTCCTGATTTTAGTGT-3’ and reverse 5’-GGGAACACAAAAGACCTCTTCTGG-3’).
Body composition and calorimetry analysis
Mouse weights were evaluated at 4-5 months or 20 months of age. Body composition was measured by magnetic resonance imaging. Mice were housed in individual indirect calorimetry cages (Phenomaster/Labmaster, TSE SYSTEMS, Chesterfield, MO) for continuous measurements of O2 consumption (VO2), CO2 production (VCO2), activity (total sum of X, Y, and Z beam break counts), and food and water consumption for 48 hours. Energy expenditure and respiratory exchange rate (RER (VCO2/VO2)) were also calculated using raw values or normalized to lean body mass as a covariate using an ANCOVA analysis.
Insulin and glucose tolerance tests
For a glucose tolerance test (GTT), glucose was administered at 2 g/kg body weight via intraperitoneal injection (IP) after either a four-hour or an overnight fast98,98,,99,99,. For an insulin tolerance test (ITT), recombinant insulin (Humulin-R, Eli Lilly) was administered at 1 U/kg body weight via IP after either a four-hour or a six-hour fast98,98,,99,99,. Blood glucose samples were taken from a tail clip at different post-injection timepoints, and glucose levels were measured using a handheld Accucheck glucometer.
Wire-hang and grip strength tests
For wire-hang assessments, an individual mouse was placed on a large metal cage lid. The lid was gently shaken to induce the mouse to grip onto the metal grid and then flipped over. The latency for the mouse to fall from the lid was recorded with a maximum time of 60 sec. The strength of paw grasp was evaluated using precision force gauges based on grasp of a metal grid by a mouse gently pulled by the tail. Digital force meters (Chatillon DFIS-10) were mounted on an acrylic platform (San Diego Instruments), with two different grids: a left-hand grid for the front paws, and a right-hand grid for all-four paws. Each grid was connected to a force transducer, which provided measures of peak force (N). Each mouse was given three trials, with at least one min of recovery between trials. Each trial measured front-paw measures from the left-hand grid immediately followed by evaluation of all-four-paw measures from the right-hand grid.
Voluntary running wheel
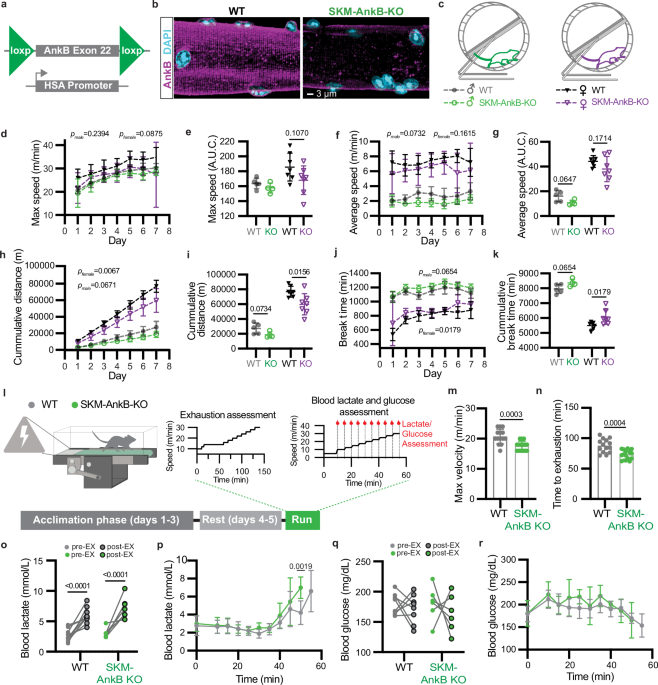
Mice were single-housed with free access to a running wheel connected to a computer to measure wheel speed and distance continually over a seven-day period. Maximal running wheel speed was calculated as the fastest wheel speed per day over the seven-day period. Average speed was estimated at the per-day average non-zero speed of each mouse. Break time was determined as the total zero-speed min per day.
Evaluations of exercise capacity and blood metabolites during endurance running
Mice ran on single-lane rodent treadmills equipped with individual shock grates to encourage running (Columbus Instruments). All experiments were done with the treadmill set at a 5% incline. Mice were first acclimated to the treadmill for three days by running at increasing speeds (0-14 m/min) for 15–17 min/day. Electric stimulation was employed on days 2–3 of acclimation. Mice rested for two days after acclimation before endurance running. To determine exhaustion time and maximum velocity during the endurance exercise test, mice ran at 10, 12, and 14 m/min for 10, 4, and 45 min respectively. This was followed by a 2 m/min increase in speed every 10 min until a mouse could no longer keep up with the speed of the treadmill, defined as the mouse failing to keep all four paws on the running belt for 15 seconds or longer. Once a mouse reached exhaustion, the shock stimulus was turned off. The exhaustion time, total running time, and maximum velocity achieved were recorded. Blood lactate and glucose levels were evaluated during exercise in mice running at a constant speed for four min, followed by a one-min rest to collect tail blood. The initial speed (5 m/min) was increased 2.5 m/min over a 60-min period, or until the time when blood lactate levels were at least 2-fold higher than pre-exercise baseline measurements. Blood lactate and glucose were respectively measured using a handheld Lactate Plus meter (Nova Biomedical) and an Accucheck glucometer.
High resolution respirometry
Mitochondria were isolated as described and resuspended in MiRO5 respiration media. Oxygen consumption was measured in mitochondria fractions isolated from SKM using the O2k Oxygraph high-resolution respirometer (Oroboros Inc.). Briefly, 80-100 µg of total mitochondria fraction proteins were transferred to an air-calibrated respirometer containing 2.2 ml of pre-warmed MiRO5 respiration medium. The following reagents were added sequentially to each chamber to determine the respiratory capacity of the electron transport chain (final concentrations listed): 2 mM malate, 10 mM pyruvate or 25 µM palmitoyl-carnitine, 2.5 mM ADP (adenosine diphosphate), 5 µM oligomycin, 2 µM FCCP, and 5 µM antimycin A. Oxygen consumption rate was normalized to total protein determined by a BCA assay (Thermo Fisher, 23225).
Evaluation of exercise-induced stress and mitophagy flux
To determine the activation of canonical stress pathways after exercise, mice were run to exhaustion using the moderate intensity endurance exercise test described above. Samples were collected immediately after exercise cessation for protein extraction and western blot analysis. To determine the recruitment of mitophagy effectors to mitochondria after acute exercise, mice were run to exhaustion using the same protocol. SKM was collected 3-hr post-exercise for mitochondrial isolation and western blot analysis.
Transmission electron microscopy
Mice were perfused with 2% PFA/2.5% glutaraldehyde in 0.1 M sodium cacodylate buffer (pH 7.4) at RT. GC and SOL were dissected into ~2 mm strips and stored in fixative at 4 °C. Specimens were rinsed in phosphate buffer, post-fixed for one hour in 1% osmium tetroxide in sodium phosphate buffer, rinsed in deionized water, dehydrated through ethanol series (30%, 50%, 75%, 100%, 100%, 10 min each), and incubated twice for 15 min with propylene oxide. Specimens were sequentially infiltrated for two hours with a 1:1 mixture of propylene oxide:Polybed 812 epoxy resin (1 A:2B formulation, Polysciences, Inc.) and a 1:2 mixture of propylene oxide: Polybed 812 epoxy resin, followed by overnight incubation in the resin. Tissue was embedded in fresh epoxy resin and allowed to polymerize for 24 hours at 60 °C. Semi-thin (1 µm) tissue sections were cut with a diamond knife and stained with 1% toluidine blue to isolate the region of interest. Ultrathin cross and longitudinal sections (70-80 nm) were mounted on 200 mesh copper grids and stained with 4% uranyl acetate for 12 min and Reynold’s lead citrate for 8 min. TEM images were acquired with a JEOL 1230 transmission electron microscope at the Microscopy Service Laboratory at UNC-Chapel Hill. Mitochondrial morphology was assessed using images acquired at 25000X by measuring cross-sectional area using Fiji (version 2.1.0/1.53c). The scale was set according to the scale bar of the original images. Mitochondrial periphery was determined by the presence of a double membrane. Adjacent mitochondria with indistinguishable membranes were treated as one mitochondrion.
Histological preparation and staining of SKM sections
Muscles were fixed by mouse transcardial perfusion with 4% PFA in PBS. GC and SOL were dissected and postfixed overnight in 4 % PFA/PBS at 4 °C, washed in PBS, cryoprotected in 30% sucrose in PBS at 4 °C, and embedded in Epredia Cryomatrix embedding resin (Epridia, 6769006). 10 µm frozen longitudinal and cross sections were cut using a CryoStar NX50 Cryostat (Fisher Scientific). Evaluations of muscle structure were conducted in cryosections permeabilized for 30 min in 1% Triton-X 100 in PBS, blocked overnight at 4 °C in blocking solution (4% BSA, 0.5% Tween 20, PBS), and incubated overnight at 4 °C with rabbit anti-dystrophin (Thermo Scientific, PA1-37587, 1:500) alone or together with sheep anti-AnkB (house made, 1:200)29. AnkG distribution was evaluated in longitudinal sections incubated with rabbit-anti AnkG (house-made, 1:200)29 and mouse anti-α-actinin (1:500, ThermoFisher, MA1-22863) antibodies overnight at 4 °C. Sections were washed with PBS and incubated for one hour at RT with secondary antibody and/or fluorescently conjugated wheat-germ agglutin (WGA) (Vector Labs, FL-1021) diluted at 1:300 in blocking solution. Sections were washed with PBS, incubated DAPI (1 µg/mL in PBS), and mounted in ProLong™ Gold Antifade Mountant (ThermoFisher, P36930). For fiber typing analysis, cryosections were boiled in 2 mM EDTA for 10 min at 95 °C, cooled to RT, and stained as above. Samples were incubated with 5 µg/mL of mouse antibodies specific for Myh7 (type I fibers, BA-D5), Myh2 (type IIa fibers, SC-71), and Myh4 (type IIb fibers, BF-F3), all purchased from the Developmental Studies Hybridoma Bank, together with rabbit anti-AnkB (1:100)27,28,29,30,32,33,52,53,54 or anti-dystrophin antibodies. Sections were then washed and incubated with donkey anti-rabbit IgG (H + L) Alexa Fluor™ Plus 405 (A48258), in combination with goat anti-mouse IgG isotype-specific antibodies anti-IgG2b-Alexa Fluor™ 568 (A-21144), anti-IgG1-Alexa Fluor™ 647 (A-21240), and anti-IgM- Alexa Fluor™ 488 (A-21042) from ThermoFisher. Z-stacks covering the entire section thickness and tile scans were acquired for all muscle sections using a ZEISS LSM 980 confocal microscope with a 20x (0.8 NA) objective lens. LSM-Plus processing and tile stitching was performed in Zen Blue (ZEISS, version 3.5.093.00006). Maximum Z-stack projections and calculations of minimum Ferret’s diameter, dystrophin membrane localization, and quantification of fiber typing and AnkB fluorescence were performed in Fiji.
Masson’s Trichrome staining and analysis of collagen deposition
SKM specimens were dissected, fixed overnight in 4% PFA in PBS at RT, dehydrated through a series of ethanol solutions and xylene, and embedded in paraffin. 5 µm thick paraffin crossections were mounted onto Fisherbrand adhesion slides, dried overnight at 58 °C, deparaffinized through a series of xylene and ethanol solutions, hydrated in PBS, and stained using a standard Masson’s Trichrome staining protocol. Images were acquired using a 20x objective on a Zeiss Axio Observer 7 inverted microscope. Analysis of collagen quantification was performed on RGB images after color deconvolution using Fiji (version 2.1.0/1.53c).
Staining and imaging of FDB fibers
Evaluations of mitochondria network morphology, MFF and Drp1 cellular distribution, and ryanodine receptor localization were conducted in isolated FDB fibers fixed for 15 min with 4% PFA and permeabilized for 30 min with 0.1% Triton-X 100 in PBS, both at RT. Samples were blocked with blocking buffer and incubated overnight at 4 °C with primary antibodies diluted in blocking buffer. Samples were washed and incubated for two hours at RT with fluorescently conjugated secondary antibodies diluted in blocking buffer, washed, and mounted in ProLong™ Gold Antifade Mountant. Primary antibodies included Protein Tech rabbit antibodies specific for COXIV (11242-I-AP, 1:50) and Tom20 (11802-1-AP, 1:20), chicken anti-GFP (Aves Lab, GFP-1020, 1:100) and Santa Cruz Biotechnology mouse antibodies against MFF (sc-398617, 1:50) and Drp1 (sc-271583, 1:50). We also used mouse antibodies against Tom20 (Abcam, ab56783, 1:20) and ryanodine receptor (Affinity Bioreagents, MA3-916, 1:100) and rabbit antibodies from Cell signaling Technology specific for pDrp1S616 (3455) and pDrp1S637 (4867) at a 1:50 dilution. The following secondary antibodies from ThermoFisher were used at 1:100 dilution: donkey anti-rabbit IgG (H + L) Alexa Fluor™ 568 (A10042), donkey anti-mouse IgG (H + L) Alexa Fluor™ 488 (A32766), donkey anti-mouse IgG (H + L) Alexa Fluor™ 568 (A10037), and goat anti-chicken IgY (H + L) Alexa Fluor™ 488 (A11039). Alexa Fluor® 488 AffiniPure™ goat anti-rabbit IgG (H + L) (Jackson ImmunoResearch, 111-545-144) was used at a 1:100 dilution.
To globally assess SR organization and SR-mitochondria association, cultured FDB fibers were loaded with 1 µM ER-tracker (ThermoFisher, E3425) and PKmito DEEP RED (Cytoskeleton, Inc., CY-SC055,1:1000) for one hour at 37 °C in fiber media. Fibers were washed and live imaging performed on a Zeiss LSM 980 confocal microscope equipped with Airyscan 2, a temperature- and CO2-controlled incubation chamber, and a 63X (1.4 NA) objective lens. Z-stack images, acquired in Airyscan mode, were processed using the Airyscan joint deconvolution function of Zen Blue. Colocalization analysis was performed using Arivis.
Evaluation of mitochondria morphology and rescue experiments in C2C12 cells
Control and AnkB220-KO C2C12 cells were transduced for 60 hr with Ad-GFP (Vector Biolabs, 1060) or Ad-AnkB220-GFP adenoviruses (1 × 10^10 PFU/ml), packed and purified by Vector Biolabs. Cells were incubated with 250 nM Mitotracker CMXRos (Invitrogen, M7512) for 15 min at 37 °C, washed with PBS, fixed for 15 min with 4% PFA, and imaged in PBS. Airyscan z-stack images covering the entire cell volume were acquired using a ZEISS LSM 980 confocal microscope with a 63x objective lens. Airyscan processing was performed in Zen Blue (ZEISS, version 3.5.093.00006). Analysis of the volume, sphericity, and surface area of mitochondria was performed in Arivis (Version 4.1.0) using the blob finder analysis tool. The fragmentation index was determined by calculating the number of discrete mitochondria divided by the sum of mitochondrial volume per cell.
Proximity ligation assay
FDB fibers were fixed for 15 min with 4% PFA, permeabilized for 30 min with 0.5% Triton-X 100 in PBS, blocked for two hours in blocking solution, all at RT, and incubated overnight at 4 °C with primary antibodies diluted in blocking solution. The following antibody combinations were used to detect proximity ligation signal: rabbit anti-AnkB (1:100) and mouse anti-βII-spectrin (BD Transduction, 612563,1:50); rabbit-AnkB and mouse anti-MFF (Santa Cruz Biotechnology, sc-398617, 1:50); rabbit anti-AnkB and mouse anti-Drp1 (Santa Cruz Biotechnology, 271583, 1:50). Fibers were also incubated with chicken anti-GFP (Aves Lab, GFP-1020,1:100) to amplify signal from endogenous GFP-labeling of mitochondria. Fibers stained only with rabbit anti-AnkB and chicken anti-GFP antibodies served as PLA negative controls. Nanoscale protein complexes were detected using a Duolink® In Situ Red (PLA) kit (Sigma, DUO92101) and PLA probes specific for mouse (Sigma, DUO92004) and rabbit (Sigma, DUO92002) antibodies. Samples were sequentially washed and incubated with goat anti-chicken IgY (H + L) Alexa Fluor™ (ThermoFisher, 488A11039) and DAPI (1 µg/ mL), and mounted in ProLong™ Gold Antifade Mountant. Fiber PLA and GFP signals were imaged on a ZEISS LSM 980 confocal microscope with Airyscan 2 using a 63x (1.4 NA) objective lens. Z-stack images acquired in Airyscan mode were processed in Zen Blue.
Measurements of mitochondrial ROS and membrane potential
Levels of reactive oxygen species (ROS) were measured in FDB fibers loaded with 500 nM MitoSOX Red Superoxide Indicator (ThermoFisher, M36008) and 1 µM MitoTracker Green-FM (ThermoFisher, M7514) for one hour at 37 °C and washed prior to imaging. Live imaging was performed on a Zeiss LSM 980 confocal microscope equipped with a temperature- and CO2-controlled incubation chamber and a 20X (0.8 NA) objective lens. Images were acquired at baseline and after a 10 min incubation with 5 µM Antimycin A. The ratio of MitoSOX/MitoTracker fluorescence in FDB fibers was quantified in Fiji from non-nuclear regions. Mitochondrial membrane potential was evaluated in cultured FDB fibers loaded with 30 nM tetramethylrhodamine ethyl ester (TMRE) dye (ThermoFisher, T669) and 1 µM Mito Tracker Green FM for 15 min at 37 °C and washed prior to imaging. Live imaging was performed as indicated. The ratio of TMRE/MitoTracker fluorescence in fibers was quantified in Fiji.
Calcium imaging
Baseline cytosolic calcium levels were measured in FDB fibers cultured in fiber media at 37 °C and 5% CO2 incubation and loaded for one hour with 2 µM of each Fluo-4-AM (ThermoFisher, F14201), the Fura-Red (ThermoFisher, F3020) ratiometric calcium indicator, and 0.04% Pluronic F-127. Following media replacement, fibers were further incubated for 30 min at 37 °C with 5% CO2 to allow for AM-ester cleavage. Unbound calcium was determined by measuring Fura Red excitation (488 nm) and emission (660 nm). Bound calcium was assessed by measuring Fluo-4 excitation (488 nm) and emission (506 nm). Fluorescence for each cell area was calculated using Fiji. Cytosolic calcium was expressed as the ratio of bound to unbound signal.
Baseline mitochondrial calcium levels were measured in FDB fibers cultured under the same conditions as above and loaded for one hour with 1 µM MitoTracker Green FM to label the total mitochondrial pool and 5 µM Rhod2-AM (ThermoFisher, R1244) to label calcium in the mitochondrial matrix. Following media replacement, fibers were incubated for 30 minutes at 37 °C with 5% CO2 to allow for AM-ester cleavage. Mitochondria were segmented based on MitoTacker Green signal using Fiji, and the average Rhod2-AM fluorescence signal per mitochondrial pixel was calculated.
Statistical analysis
GraphPad Prism (GraphPad Software, v.8.4.3) was used for statistical analysis, unless otherwise stated. Two groups of measurements were compared by unpaired, two-tailed Student’s t-test or multiple t-tests. Multiple groups were compared by one-way ANOVA followed by Tukey’s multiple comparisons tests. Two-way mixed effect model analysis was used to compare differences between timepoints of two or more groups for GTT, ITT, and exercise blood lactate and blood glucose measurements. Simple linear regression was used to correlate AnkB expression with fiber type fluorescence. Energy expenditure was analyzed using ANCOVA with lean body mass as a covariate using vassarstats.net.
Reporting summary
Further information on research design is available in the Nature Portfolio Reporting Summary linked to this article.