
Patient enrolment and baseline characteristics
A total of 783 subjects from three cohorts were included (Fig. S1) and the clinical characteristics at baseline were shown in Table 1. The mean ages, educations and gender ratios were significantly different among cohorts. Overall, the datasets from the three cohorts were significantly distinct, and the composition of the subjects significantly differed in demographic information, cognitive assessments and imaging CSVD burden. All the subjects in three cohorts were classified into CSVD without cognitive impairment (CSVD-nonCI) group and the CSVD-CI group. The clinical information of the training cohort was shown in Table S1. The CSVD-CI group (n = 226) had higher age, lower education levels and higher proportion of hypertension history (all P < 0.05) compared to CSVD-nonCI group. CSVD-CI patients also displayed significantly decreased cognitive domain scores than the normal cognition group (all P < 0.001). The detailed clinical information of patients with different cognitive statuses in another two validation datasets showed similar trends and was summarized in Table S2, 3.
Table 1 clinical characteristics of patients in three independent cohortsWMH radiomic features on T2-FLAIR
After WMH from T2-FLAIR was segmented (Fig. 1a), the RFs of WMH were extracted using Pyradiomics23 (Fig. 1b). On the original images of each WMH, 7 classes of RFs were extracted, including shape descriptors (14 features), first-order statistics (18 features), gray level co-occurrence matrix (glcm) (24 features), gray level dependence matrix (gldm) (14 features), gray level run length matrix (glrlm) (16 features), gray level size zone matrix (glszm) (16 features), and neighbouring gray tone difference matrix (ngtdm) (5 features). In total, there are 107 features per original image. (detailed RFs extracted from original images are listed in Table S4). At the same time, enabled 13 filters were applied to the original images, including wavelet, Laplacian of Gaussian (log), square, square root, logarithm, exponential, gradient, and local binary pattern filters23 (Fig. S2). For each filtered image, we extracted 6 above classes of RFs except for shape descriptors, which are independent of intensity values and can only be extracted from unfiltered images. In total, 85 classes and 1316 features were obtained per subject for developing the detection model (Fig. S2). Every RF is identified by a unique name, which consists of the applied filter, the feature class and the feature name.
Fig. 1: Study workflow.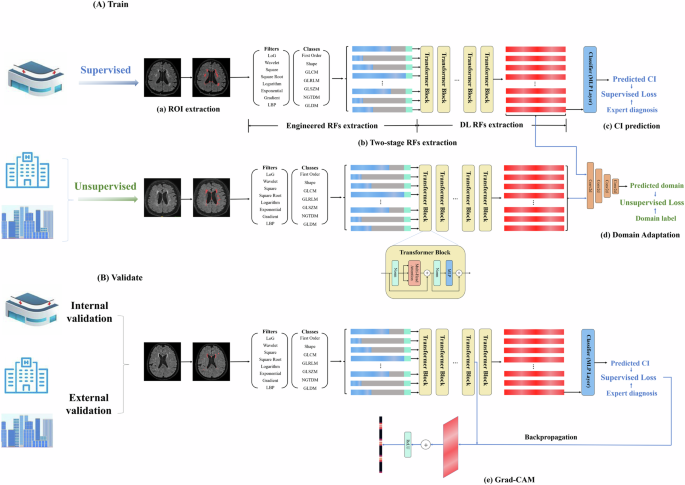
A The training process of the model. This deep learning training process includes two branches: supervised training using data with expert diagnosis results and unsupervised training using data from other centres without expert diagnosis results. a ROI extraction. LST toolbox was used to automatically segment WMH. Two senior neurologists corrected manually. b RFs extraction: Engineered RFs were extracted first, and then a transformer architecture was used to extract DL RFs. The blue bar represents the extracted engineered RFs. The grey bar represents the zero paddings. The green bar represents the positional embeddings. The red bar represents the DL RFs. c CI prediction: DL RFs were used to predict CI. d Domain adaptation. The domain discriminator was used to discriminate DL RFs from the source and the target domains, which enables the transformer models to learned to extract DL RFs that are both discriminative and invariant to the change of domains. B The external verification process of the model. Two independent cohorts from the Zheer and Xianlin communities were verified in the above model in a supervised manner. The output classification results were compared to expert annotations. e Grad-CAM. Grad-CAM uses the gradient information flowing into the Norm layer of the penultimate Transformer block to produce a heatmap highlighting the important RFs that correspond to the decision of the model. CI cognitive impairment, DL deep learning, Grad-CAM gradient-weighted class activation mapping, RFs radiomic features, ROI area of interest, WMH white matter hyperintensity. The figure was created using Microsoft PowerPoint.
The construction and the training of the Transformer-based model
WMH RFs on T2-FLAIR of each subject from the training cohort (n = 572, with corresponding expert diagnostic label of CSVD-CI or CSVD-nonCI) were used for deep learning using a hierarchical Transformer architecture (Fig. 1b). Five-fold cross-validation was performed during the training process. The number of images in each fold was detailed in Table S5. In all folds, the model could detect those with CSVD related CI with an area under the curve (AUC) of 0.841 ± 0.016 (Fig. 2A). The classification of CSVD-CI versus CSVD-nonCI achieved an accuracy of 0.798 ± 0.021, sensitivity of 0.793 ± 0.108, specificity of 0.800 ± 0.065, precision of 0.716 ± 0.055 and recall of 0.793 ± 0.108 (Table 2).
Fig. 2: Performance of the deep learning model for the detection of cognitive impairment in CSVD patients from three cohorts.
A ROC curves of five-fold cross-validation results for diagnosing cognitive impairment in CSVD patients from the training cohort. B The validation datasets of the training cohort were stratified into different subgroups, and there was no significant difference in the detection efficacy of the model between different age levels, different education levels, different genders, different severities of WMH or patients with and without CMBs (DeLong’s test, all P > 0.05). The AUC value for cognitive impairment was significantly higher in CSVD patients without LI than in CSVD patients with LI (DeLong’s test, P < 0.001). C ROC curve for detecting cognitive impairment in CSVD patients from the hospital-based external validation cohort. D ROC curve for detecting cognitive impairment in CSVD patients from the community cohort. **p < 0.001. AUC area under the curve, CMBs cerebral microbleeds, CSVD cerebral small vessel disease, edu education, LI lacunar infarction, ROC receiver operating characteristic, WMH white matter hyperintensity. Figure 2A, C and D were created using Python (v3.11); Fig. 2B was created using GraphPad Prism 8.
Table 2 Comparison of the performance between Transformer-based model and conventional machine learning models
Subgroup analysis showed that there was no significant difference in the AUC values of the model among different sexes, different age levels or different education levels (DeLong’s test, all P > 0.05). In addition, the model’s performance was not affected by WMH severity or the presence of cerebral microbleeds (CMBs). However, the presence of lacunar infarction (LI) significantly impacted model efficacy (AUC = 0.865 in CSVD patients without LI vs AUC = 0.674 in those with LI; DeLong’s test, P < 0.001) (Fig. 2B).
Furthermore, the correlation analysis between the output values and clinical indicators revealed that the classification outputs were positively correlated with age (P < 0.001, r = 0.403; Fig. S3A) and homocysteine quantification (P = 0.017, r = 0.214; Fig. S3C) but were negatively correlated with years of education (P < 0.001, r = −0.147; Fig. S3B). Interestingly, the correlations between classification outputs and cognitive domain function scores were all significant (all P values were <0.001; Fig. S3D–H).
Comparison with conventional machine learning models
We constructed three conventional machine learning models using the same training cohort. As shown in Table 2, the Transformer-based deep learning model achieved a higher AUC (0.841) than the Random Forest (AUC = 0.820), Support Vector Machine (SVM) (AUC = 0.770) and XGBoost (AUC = 0.813) models. Also, it outperformed these three conventional machine learning models in terms of accuracy, sensitivity, specificity, precision and recall.
External validation of the Transformer-based model with domain adaptation
To enhance the generalization capability of this Transformer-based model, the external cohorts were utilized in an unsupervised manner during the training process, ensuring that the feature extractor captured latent feature representations with a consistent distribution between the training cohorts and the external cohorts, just termed domain adaption. Using this strategy, two independent cohorts from another independent hospital and a community were verified. The results indicated that the former had a slightly better performance: the AUC was 0.859 (95% CI, 0.781–0.935) (Fig. 2C), the accuracy was 0.833 (95% CI, 0.743–0.902), the sensitivity was 0.938 (95% CI, 0.828–0.987), the specificity was 0.729 (95% CI, 0.582–0.847), the precision was 0.776 (95% CI, 0.684–0.847) and the recall was 0.938 (95% CI, 0.828–0.987). The latter also suggested that the model is valid. The AUC was 0.749 (95% CI, 0.657–0.841, Fig. 2D), accuracy was 0.714 (95% CI, 0.621–0.796), sensitivity was 0.683 (95% CI, 0.550–0.797), specificity was 0.750 (95% CI, 0.611–0.860), precision was 0.759 (95% CI, 0.656–0.839), and recall was 0.683 (95% CI, 0.550–0.797).
External validation performance without domain adaptation
To validate the value of domain adaptation, we conducted an ablation experiment excluding the unsupervised domain adaptation branch. Results demonstrated significantly lower AUC values in the model without domain adaptation compared to adapted model across both cohorts: Independent hospital cohort: 0.821 vs 0.859 (P = 0.026 by DeLong’s test); Community cohort: 0.668 vs 0.749 (P = 0.0002 by DeLong’s test). The detailed model performance was shown in Table S6.
Visualization and clinical interpretability of key radiomic featuresVisualization of key RFs class by Grad-CAM
The visualization of the model in two external validation datasets was generated by Grad-CAM heatmaps. As shown in Fig. 3A, B, the importance of 85 classes of RFs was normalized to 0 to 1, the heatmaps illustrated the contribution of each RFs class to the classification of patients predicted as CSVD-CI. The salient features highlighted by Grad-CAM were largely consistent across the datasets, suggesting robustness in the model’s learned feature importance and its generalization capability. Forty RFs categories contributed to the classification performance of the model (importance>0). The top ten most important feature classes were shown in Fig. 3C. The most important RF type was glszm features based on logarithm filtered images (logarithm_glszm) in both cohorts, and the mean importance was 0.996. The logarithm_glszm category contains 16 specific RFs. Next, we would conduct clinical correlation analyses of these features to enhance the interpretability of the model.
Fig. 3: Visualization of important radiomic features.
A, B Grad-CAM of engineered radiomics features in two independent external validation datasets. The heatmap shows the contribution of each RF class to the prediction. The abscissa of the heatmap showed the cases identified as CSVD-CI by this model in each dataset, and the ordinate showed 85 RFs classes. C Comparisons of the top 10 most important radiomics features classes identified in the two validation cohorts. D Comparisons of key radiomics features between groups of CSVD-CI and CSVD-nonCI showed that all RFs of logarithm_glszm were significantly different between the two groups (P all <0.001). **p < 0.001, ***p < 0.0001, ****p < 0.00001. CI cognitive impairment, RFs radiomic features, glszm grey-level size zone matrix, WMH white matter hyperintensity. Figure 3A–C were created using Python (v3.11); Fig. 3D was created using R (v4.2.2).
The logarithm_glszm features differed significantly between groups of CI and nonCI
We compared the difference in values of the key RFs between the CI group and the nonCI group and found that all RFs of logarithm_glszm were significantly different between the two groups (P all <0.001, Fig. 3D). Among which, the values of logarithm_glszm_ GreyLevelNonUniformity, logarithm_glszm_GrayLevelVariance, logarithm_glszm_HighGrayLevelZoneEmphasis, logarithm_glszm_LargeAreaEmphasis, logarithm_glszm_LargeAreaHighGrayLevelEmphasis, logarithm_glszm_SizeZoneNonUniformity, logarithm_glszm_SmallAreaHighGrayLevelEmphasis, logarithm_glszm_ZoneEntropy and logarithm_glszm_ZoneVariance in CSVD-CI group were larger than those in CSVD-nonCI group; while the values of logarithm_glszm_GrayLevelNonUniformityNormalized, logarithm_glszm_LargeAreaLowGrayLevelEmphasis, logarithm_glszm_LowGrayLevelZoneEmphasis, logarithm_glszm_SizeZoneNonUniformityNormalized, logarithm_glszm_SmallAreaEmphasis, logarithm_glszm_SmallAreaLowGrayLevelEmphasis and logarithm_glszm_ZonePercentage in CSVD-CI group were significantly smaller than those in CSVD-nonCI group.
The logarithm_glszm features of WMH mediated the relationship between age and cognitive domain scores
Next, the relationships between logarithm_glszm RFs and the cognitive scores of CSVD-CI patients were analyzed. The results showed that GreyLevelNonUniformity, LargeAreaEmphasis, LargeAreaHighGrayLevelEmphasis, SizeZoneNonUniformity, ZoneEntropy and ZoneVariance features based on logarithm transformed images were negatively correlated with all cognitive domain scores (P < 0.05); LowGrayLevelZoneEmphasis, SizeZoneNonUniformityNormalized, SmallAreaEmphasis, SmallAreaLowGrayLevelEmphasisa and ZonePercentage features based on logarithm transformed images were positively related to cognitive domain scores (P < 0.05) (Fig. 4A).
Fig. 4: Correlations between key radiomic features and cognitive domain scores.
A Heatmaps of correlations between the most important class of radiomic features and clinical cognitive scores. The blue circle represents the positive correlation, the red circle represents the negative correlation, the larger the diameter of the circle, the larger the absolute value of the correlation coefficient. B, C The mediation analyses suggested that the logarithm_glszm_ZoneEntropy feature of WMH mediated the effect of age on general cognitive function and language function. *p < 0.05, **p < 0.01, ***p < 0.001. RFs radiomic features, glszm grey-level size zone matrix, WMH white matter hyperintensity.Fig. 4A was created using R (v4.2.2); Fig. 4B, C were created using Microsoft PowerPoint.
Then, mediation analyses were performed to further elucidate the role of WMH RFs in age-related cognitive decline. Notably, the results suggested that logarithm_glszm_ZoneEntropy values slightly but significantly mediated the relationship between age and general cognition (indirect effect: −0.1035, 95% CI: [−0.1399, −0.0723], Fig. 4B) as well as the correlation between age and language function (indirect effect: −0.0721, 95% CI: [−0.1073, −0.0425], Fig. 4C).
The logarithm_glszm features were significantly related to other CSVD macro-and microstructural markers
We further investigated the biological annotations of key textural features in relation to macro- and microstructural damages. As shown in Table S7, all the RFs of logarithm_glszm were significantly related to the WMH volumes, numbers of LIs and numbers of CMBs.
WMH is myelin or axonal damage that can be detected by MRI/DTI, which provides detailed information on the microstructure and integrity of white matter fibre tracts. Among all subjects in the training dataset, DTI sequences were collected in 501 patients. As shown in Table S8 and S9, a total of 40 diffusion features were extracted, including fractional anisotropy (FA) and mean diffusivity (MD) metrics of 20 atlas-based tracts (detailed in Appendix E5). Feature selection was conducted among the above 40 diffusion features by the least absolute shrinkage and selection operator (LASSO) with 10-fold cross-validation. The selection of the lambda values was shown in Fig. 5A, B, and 12 important DTI metrics (i.e., those with non-zero weights, Fig. 5C) were selected as inputs to train an SVM classifier then. The SVM model achieved a mean AUC of 0.813 in five-fold cross-validation (Fig. 5D), which was slightly lower than the AUC of the Transformer-based model.
Fig. 5: DTI analyses.
A, B The hyperparameter (Lambda value) of LASSO regression was selected with the minimum MSE value (Lambda = 0.0115). C Twelve important DTI features were selected and their weight was listed. D The ROC curve of SVM model with five-fold cross-validation. E Heatmaps of correlations between the most important class of radiomic features and important DTI features. The blue circle represents the positive correlation, the red circle represents the negative correlation, the larger the diameter of the circle, the larger the absolute value of the correlation coefficient. The RF1 to RF16 refers to the 16 features of logarithm_glszm. *p < 0.05, **p < 0.01, ***p < 0.001. Abbreviations: DTI diffusion tensor imaging, LASSO Least Absolute Shrinkage and Selection Operator, MSE mean square error, ROC receiver operating characteristic, SVM support vector machine. Figure 5A–D were created using Python (v3.11); Fig. 5E was created using R (v4.2.2).
To further support the clinical interpretability of this model, we examined the correlations between selected DTI parameters and key RFs. Most logarithm_glszm features showed significant correlations with FA or MD values in CSVD patients (Fig. 5E), suggesting that texture features can partially reflect the microstructural feature of white matter lesions.
Besides, we collected plasma neurofilament light chain (NFL) from subjects of the community cohort, which may reflect axonal damage24 and compared the correlation between plasma NFL and key RFs. The results showed that the NFL was positively associated with the value of logarithm_glszm_ZoneEntropy (P = 0.002, r = 0.292), logarithm_glszm_SizeZoneNonUniformity (P = 0.030, r = 0.211), logarithm_glszm_LargeAreaHighGrayLevelEmphasis (P = 0.029, r = 0.213) and logarithm_glszm_GrayLevelNonUniformity (P = 0.043, r = 0.197) (Details were shown in Fig. S4).
The key texture feature was a potential predictor of future cognitive progress in the longitudinal CSVD cohort
Finally, we assessed the ability of key textural features to predict cognitive outcomes in a longitudinal cohort. When comparing the correlations between the annual rate of changes in cognitive assessment and RFs, we found that a significant correlation existed only in the CSVD-CI group (Fig. 6A–H). Besides, the significant correlations between annual rate of change in the Beijing version of the Montreal Cognitive Assessment (MoCA) score and logarithm_glszm_GrayLevelNonUniformity (P < 0.001, r = −0.419), logarithm_glszm_SizeZoneNonUniformity(P = 0.021, r = −0.282), logarithm_glszm_SizeZoneNonUniformityNormalized (P = 0.032, r = 0.263), logarithm_glszm_SmallAreaEmphasis(P = 0.039, r = 0.253) logarithm_glszm_ZonePercentage (P = 0.015, r = 0.297) remained when correcting potential covariates (age, sex, education and baseline cognitive state).
Fig. 6: Correlations between key radiomics features and the annual rate of changes in cognition in longitudinal analysis.
The red dots represent subjects in the CSVD-CI group and the blue triangles represent subjects in the CSVD-nonCI group. The annual rate of changes in the MoCA was significantly related to the values of logarithm_glszm_GrayLevelNonUniformity (A), logarithm_glszm_LargeAreaEmphasis(B), logarithm_glszm_SizeZoneNonUniformity (C), logarithm_glszm_SizeZoneNonUniformityNormalized(D), logarithm_glszm_SmallAreaEmphasis (E), logarithm_glszm_ZoneEntropy(F), logarithm_glszm_ZoneVariance (G) and logarithm_glszm_ZonePercentage(H) in the CSVD-CI group. CSVD-CI cerebral small vessel disease patients with cognitive impairment, CSVD-nonCI cerebral small vessel disease patients without cognitive impairment, MoCA Montreal Cognitive Assessment. Figure 6A–H were created using GraphPad Prism 8.
Then we investigated the independent predictors of future cognitive progress. Fifty-five patients experienced a decline in cognitive scores during follow-up. On univariate Cox regression, only logarithm_glszm_GrayLevelNonUniformity (P = 0.043, hazard ratio [HR], 1.272) was a significant predictor of cognitive decline. In the multivariate regression, the logarithm_glszm_GrayLevelNonUniformity retained significance (P = 0.004, HR = 1.466). While the traditional CSVD biomarkers, including WMH volumes did not have a significant predictive effect on the decline of cognitive scores during follow-up.