
Comprehensive library of chemical contaminants
To systematically assess the impact of chemical contaminants, we used a large library of 1,076 compounds that are likely to enter food and water (Extended Data Fig. 1a). The library includes 829 pesticides (mainly herbicides, insecticides and fungicides), along with compounds targeting other organisms, including spiders, nematodes, bacteria and rodents. It also contains 119 known pesticide metabolites formed by biotransformation29 and 75 pesticide-related compounds (precursors, breakdown products, chemical isomers or formulation products). In addition, the library contains 48 industrial chemicals, such as the widespread contaminants bisphenols and nitrosamines, and five mycotoxins found in mould-contaminated foods. Several compounds are considered to be persistent organic pollutants, such as PFASs and the insecticides dichlorodiphenyltrichloroethane (DDT, also known as clofenotane) and chlordecone. Overall, the library spans 291 out of 352 pesticide classes in the British Crop Production Council Pesticide Compendium and 87% of compounds reported in a study of pesticide discharge from rivers into oceans6. The library, together with extensive metadata (Supplementary Data 1), constitutes a resource for systematic investigation of the impact of chemical pollutants on biological systems.
Chemical contaminants from diverse classes inhibit the growth of gut bacteria
We performed the chemical–bacteria screen at 20 μM concentration for all compounds. This dose was chosen for consistency with previous xenobiotic screens25,30,31, thus enabling direct comparison. To contextualize this dose, we analysed xenobiotic plasma concentrations from a recent study13. In 305 of 592 samples, at least one xenobiotic was observed at a concentration of 10 μM or higher. Among the measured xenobiotics, spinosyn A, melamine, mepiquat, acrylamide and amitrole, all of which are present in our compound library, most frequently surpassed 2 μM in plasma (45, 40, 39, 34 and 33 samples, respectively). Pharmacokinetic studies suggest that colonic concentrations tend to be in the same range or higher than in the plasma25,32. The relevance of micromolar-range doses is further supported by the food regulatory limits of some chemicals33. Furthermore, chemicals such as the antiparasitic closantel have been found in dairy products at micromolar levels34,35.
Next, we assessed the impact of all 1,076 compounds in the library on the growth of 22 commensal gut bacterial strains belonging to 21 species (Fig. 1a,b). These strains were selected based on their abundance and prevalence in the healthy human gut microbiota, as well as phylogenetic and metabolic representation (Supplementary Data 2)36,37. All strains were grown anaerobically at 37 °C in mGAM broth, a rich medium designed to support the growth of a maximum number of strains. Bacterial growth was monitored for 24 h and quantified as the area under the growth curve (AUC). We defined growth inhibition hits as chemical–bacteria interactions featuring a growth decrease of >20% and a false-discovery-rate adjusted P value (Padj) < 0.05. Only hits identified in at least two out of three biological replicates are considered (Supplementary Data 3 and Extended Data Fig. 1b).
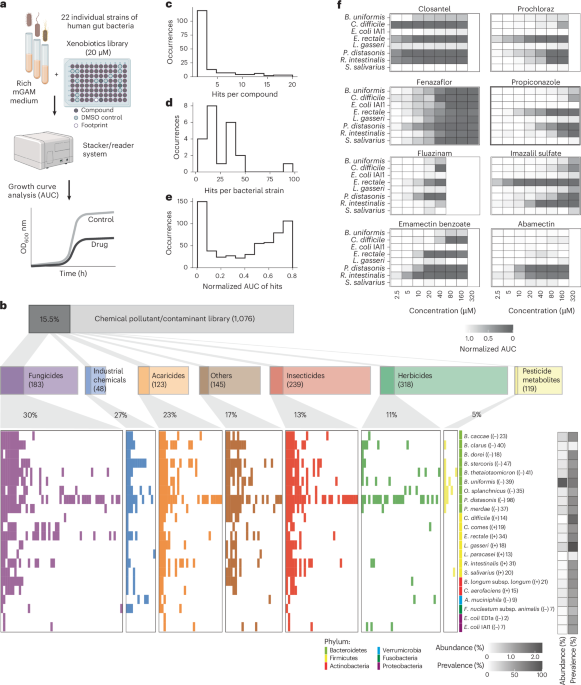
Fig. 1: Extensive impact of food contaminants on prevalent human gut bacteria.
a, Workflow of high-throughput screening to test the susceptibility of gut bacteria against industrial and agricultural chemicals. Monocultures were grown in mGAM medium with 20 μM of each compound (n = 3 experiments on independent days). Growth curves were recorded and the AUC relative to DMSO controls was used as a fitness proxy. b, High-throughput growth screening results for 22 gut bacterial strains. Significant pollutant chemical–strain interactions, where the growth of a specific strain was inhibited versus the DMSO control, are highlighted with a coloured bar (Padj < 0.05; >20% reduction in AUC; two out of three independent replicates significant). The data are grouped and coloured by compound class. ‘Others’ refers to compounds not assigned to any of the classes shown. Note that in rare cases a single compound can belong to more than one compound class. The phylum, abundance and prevalence of strains are displayed in coloured and greyscale bars, and the Gram stain and number of compounds that inhibit growth are shown in parentheses after each strain name. c–e, Distributions of the number of inhibitory bacterial interactions (hits) per compound (c) and bacterial strain (d), and the strength of growth inhibition, shown as mean normalized AUC values of hits(e). f, Independent validation screen. Eight bacteria were tested at up to eight concentrations (n = 3 independent experiments). The colours indicate mean rAUC values normalized to DMSO controls. Panel a created with BioRender.com.
Around one-sixth of the tested chemicals (168) were inhibitory against at least one bacterial strain (Fig. 1c). The most sensitive taxa were Bacteroidales, especially Parabacteroides distasonis, whereas Escherichia coli, Fusobacterium nucleatum subspecies animalis and Akkermansia muciniphila were the least sensitive species (Fig. 1b,d). The chemical categories featuring prevalent anti-gut-bacterial activity (at least one in five compounds) were fungicides, industrial chemicals and acaricides (Fig. 1b). Although most compounds were inhibitory against a few strains, indicating a narrow spectrum of activity, 24 chemicals showed broad toxicity, inhibiting more than one-third of the species tested (Extended Data Fig. 2b). Broad-spectrum inhibitory compounds include closantel (a livestock antiparasitic; 19 strains), tetrabromobisphenol A (TBBPA; a brominated flame retardant; 19 strains), chlordecone (an insecticide; 17 strains), bisphenol AF (BPAF; used in plastics; 12 strains), fluazinam (a fungicide; nine strains) and emamectin benzoate (an insecticide; 13 strains).
Around 150 chemical–bacteria interactions featured >90% growth reduction, uncovering strong anti-gut-bacterial activity for 33 compounds (Fig. 1e). To test whether the inhibitory activity was retained at lower concentrations, we tested 11 pesticides against eight bacteria across multiple concentrations (Fig. 1f and Supplementary Data 4). Independently purchased compounds were used to account for any errors associated with batch variations and large-scale library preparations. Most interactions from the main screen were also observed in this independent experiment (72%; 23 out of 32; Extended Data Fig. 1c,d), which is the expected range considering the physiological idiosyncrasies of non-model bacteria38. Many compounds show strong inhibitory effects at substantially lower concentrations than those tested in the main screen. For example, imazalil sulfate, closantel and prochloraz inhibit Eubacterium rectale, a prevalent species that produces the health-associated metabolite butyrate39, at a concentration as low as 2.5 µM. Together, our systematic assessment revealed hundreds of chemical–bacteria interactions, including contaminants with broad and potent anti-gut-bacterial activity.
Commonality of susceptibility to therapeutic drugs and chemical contaminants
The off-target activity of chemicals against gut bacteria has been reported for >1,000 human-targeted drugs and antibiotics by Maier et al.25,30. As in the case of therapeutic drugs, we observed a positive correlation between the number of compounds affecting a species and its relative abundance in human microbiomes (Spearman’s rank correlation (ρ) = 0.57; P = 0.005) (Fig. 2a), but none with prevalence (Fig. 2b). Thus, chemicals with broad- as well as narrow-spectrum activity are likely to influence microbiome composition due to their impact on abundant taxa. Strains sensitive to many chemical pollutants were also sensitive to many therapeutic drugs tested by Maier et al. (ρ = 0.63; P = 0.009) (Fig. 2c). Pollutant sensitivity correlated more strongly with human-targeted drugs (ρ = 0.66; P = 0.004) than with antibiotics (⍴ = 0.33; P = 0.19) (Fig. 2d), which is consistent with the broader-spectrum activity of antibiotics. The correlation between chemical pollutants in our screen and human-targeted drugs supports that gut bacteria interact with diverse chemicals via common and non-specific mechanisms25,28,40.
Fig. 2: Xenobiotic susceptibility in the microbial community context.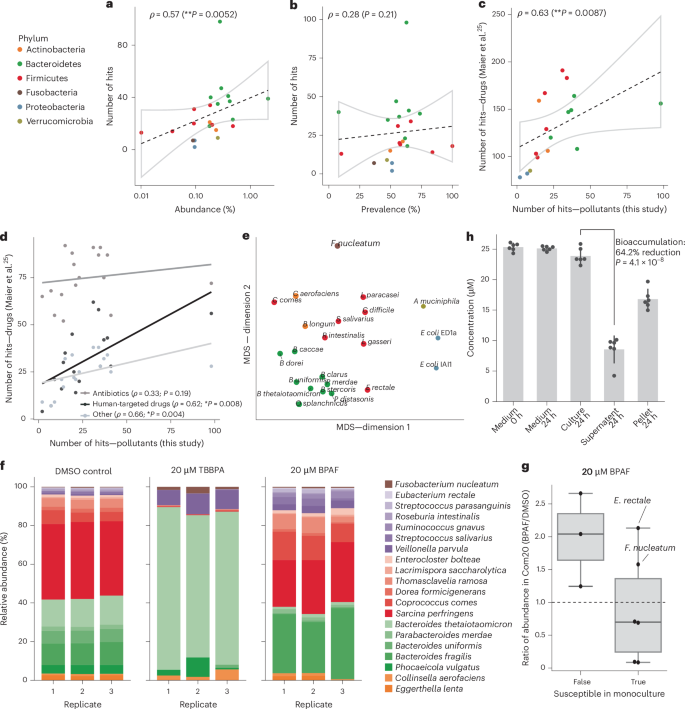
a,b, Correlation between average species abundance (a) or prevalence (b), observed in human cohort studies, and compound sensitivity across gut bacterial strains (n = 22 strains). The phyla are colour coded. The lines depict the best linear fit and the grey shapes indicate 95% confidence intervals. ρ is the Spearman’s rank correlation coefficient (two sided). c, Correlation between the number of pollutant compounds inhibiting a strain (this study) and the number of human-targeted drugs inhibiting the same strain in the study by Maier et al.25 (n = 17 strains). d, As in c, but stratified by drug type. e, Multi-dimensional scaling (MDS) of the strain sensitivity profiles of strains (phylum colour coded as in a). The distances were computed with binary inhibition classification using the Jaccard metric. MDS was performed with scikit-learn using default settings. f, Relative abundances of synthetic community Com20 species after exposure to BPAF and TBBPA, coloured by phylum (n = 3 biological replicates). The legend identifies individual species using colour intensity. g, Comparison of monoculture versus community susceptibility to BPAF. The data represent ratios of absolute abundance (16S sequencing read counts normalized to the community optical density) between cultures treated with BPAF and the DMSO control. The points are the average of three Com20 replicates, corresponding to species overlapping between monoculture and synthetic community experiments. Central lines, box limits and whiskers represent, median values, upper and lower quartiles, and 1.5× the interquartile range, respectively. h, LC–MS/MS measurements of BPAF in synthetic communities (Com20) show bioaccumulation (that is, depletion of BPAF in supernatant compared with whole culture) (n = 6 biological replicates; two-sided t-test). The data are presented as means ± s.d.
Chemical susceptibility profiles of bacterial species grouped clearly by evolutionary relatedness (that is, by phylum; Fig. 2e), with most compounds showing phylum-level differences in toxicity (Extended Data Fig. 2a). For example, some Firmicutes were uniquely sensitive to conazole fungicides, including the widely used imazalil and prochloraz. This indicates a shared genetic basis for toxicity and suggests that chemical susceptibility data could help to predict effects on related bacterial species for in silico toxicological assessments.
Chemicals alter the composition of synthetic gut bacterial communities
We next investigated how species-level chemical effects translate in bacterial communities using a synthetic community of 20 gut bacteria (Com20)38 (Methods and Supplementary Data 5). Com20 is a phylogenetically and functionally diverse community, spanning six phyla, 11 families and 17 genera, collectively encoding >60% of the metabolic pathways present in healthy human gut microbiomes. Members of the community grow together stably and reproducibly in mGAM38—the growth medium used in our screen. The Com20 was transferred twice in fresh growth medium before being challenged with BPAF or TBBPA, two broad-spectrum anti-gut-bacterial chemicals. In the case of TBBPA, the community was dominated by Bacteroides thetaiotaomicron, despite its susceptibility in monoculture. BPAF induced compositional changes concordant with monoculture effects (Fig. 2f), including decreased relative abundances of B. thetaiotaomicron, Bacteroides uniformis, Parabacteroides merdae and Roseburia intestinalis, and increased abundances of insensitive species (that is, Collinsella aerofaciens, Coprococcus comes and Streptococcus salivarius). Yet, F. nucleatum and E. rectale were protected against BPAF in the community (Fig. 2g).
Community-level effects, such as cross-protection, have been described in gut bacterial communities exposed to therapeutic drugs and could partly be attributed to compound bioaccumulation31,41. We hypothesized that cross-protection against BPAF in Com20 is due to bioaccumulation, as this has been observed in Bacteroidales monocultures42. We measured BPAF concentrations in whole culture, supernatant and pellets of Com20 cultures exposed to 20 µM BPAF using liquid chromatography–tandem mass spectrometry (LC–MS/MS). We detected a 64% reduction in BPAF in supernatant compared with whole culture and recovered BPAF in the pellet (Fig. 2h), indicating that most of BPAF in Com20 is sequestered within cells, explaining cross-protection of some community members.
Expanded coverage of the chemical landscape
Large-scale surveys of xenobiotic–bacteria interactions, combined with computational analyses, could enable in silico toxicity predictions43. However, accurate prediction requires sufficient data spanning the relevant chemical space. To assess this, we compared the extended-connectivity fingerprints (ECFPs) of our pollutant library with those of previously characterized pharmaceutical drugs25 and 250,000 random PubChem compounds.
Pollutants and pharmaceutical drugs were widely dispersed in uniform manifold approximation and projection (UMAP) space (Fig. 3a), indicating large chemical diversity for both groups. Notably, pollutants and drugs did not form clear clusters, and only six pollutants had a Tanimoto similarity to drugs of >0.75, highlighting limited molecular fingerprint overlap between the two libraries44,45 (Fig. 3b). This suggested that labels such as ‘pesticide’ or ‘pharmaceutical drugs’ do not capture the molecular basis of anti-gut-bacterial toxicity. To quantify how well pollutant and drug libraries jointly span the chemical space, we noted the Tanimoto similarity of each PubChem compound to its closest match in the libraries. This was significantly increased in the combined library (P < 2.2 × 10⁻¹⁶; Kolmogorov–Smirnov test; Extended Data Fig. 3a), indicating broader chemical-space coverage towards predicting the impact of novel compounds.
Fig. 3: Expanded chemical space of xenobiotic–bacterial growth interactions enables toxicity predictions.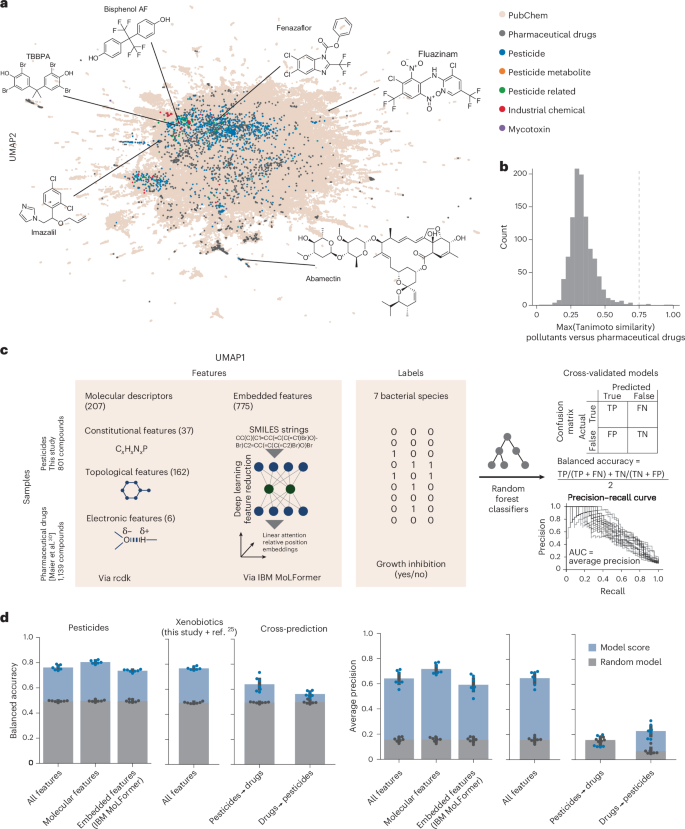
a, UMAP for ECFPs of pollutant library compounds from this study, previously screened pharmaceutical drugs25 and a random selection of 250,000 compounds from PubChem. b, Distribution of similarities between the closest-matching pollutants from this study and drugs used by Maier et al.25. The two compound sets are structurally diverse and distinct, as only very few (six) compounds from the library used in this study had a similarity to a drug from ref. 25 of >0.75 (dashed line). Compounds shared between the two studies (n = 32; mostly veterinary drugs) were excluded from this analysis. c, Machine learning workflow to predict species-specific xenobiotic toxicity from molecular descriptors and embedded features. Random forest classifier models were trained and evaluated using 20× cross-validation, using performance metrics appropriate for imbalanced datasets. d, Performance scores of models trained and tested on various feature and sample sets. Left, models trained on pesticides only (n = 801) using different feature sets (x axes). Middle, model trained on pesticides and pharmaceutical drugs from Maier et al.25 (n = 1,940). Right, models trained on pesticides (this study) cannot predict the toxicity of pharmaceutical drugs25 and vice versa. Each dot represents a species (mean of 20× cross-validation splits). Median random model performances are shown as overlayed bars. The error bars represent standard deviation and the dots represent performances obtained by randomly shuffling the labels. FN, false negative; FP, false positive; TN, true negative; TP, true positive.
Machine learning predicts antimicrobial effects
To probe the utility of increased chemical-space coverage, we employed machine learning for predicting the anti-gut-bacterial activity of chemicals. We used two datasets: pesticides from our pollutant screen and the drug screen by Maier et al. (Fig. 3c). For each compound, we obtained a comprehensive set of structural features, including molecular fingerprints (Chemistry Development Kit) and deep-learning-based feature embeddings from MoLFormer46. The latter is a deep learning model trained on 1.1 billion molecules to predict a wide range of chemical properties, such as substructures, from simplified molecular input line entry system (SMILES) strings. To avoid excessively imbalanced groups for machine learning modelling, we chose seven species that showed >20 hits in both pollutant and drug datasets. Random forest classifier models were trained and evaluated using cross-validation with stratified splits. Classifications were obtained by thresholding probability outputs at the hit frequency of the training dataset—a strategy suitable for imbalanced datasets47.
We evaluated models using two metrics appropriate for imbalanced datasets: balanced accuracy (the mean of sensitivity and specificity) and average precision (the area under the precision-recall curve)48. Models trained and tested on pesticides alone achieved good performance when predicting pesticide toxicity (average balanced accuracy = 0.77; average precision = 0.65; 20× cross-validation; Fig. 3d). Performance varied slightly between species, with the best results obtained for E. rectale (balanced accuracy = 0.8; average precision = 0.73) and the weakest predictions for B. thetaiotaomicron (balanced accuracy = 0.73; average precision = 0.52). Training models on only molecular descriptor features (that is, excluding MoLFormer embeddings) slightly improved the performance (balanced accuracy = 0.81; average precision = 0.72), indicating that this smaller feature set is sufficient for predictions. Analysis of feature importance (Extended Data Fig. 3) identified molecular features implicated in antibacterial activity. Although a model trained and tested on the combined pesticide–drug dataset showed similar performance, cross-predictions from one dataset to another showed poorer performance (approximate balanced accuracy = 0.7; average precision = 0.2). This indicates that pesticides and drugs are overall different in both chemical and activity space (Fig. 3a). The pesticide toxicity against gut bacteria thus could not have been predicted based on previously available data.
Conserved genetic response to pollutants with implications for antibiotic resistance
Given the high sensitivity of Bacteroidales to pollutant compounds (Fig. 2a and Extended Data Fig. 2a), we aimed to investigate mechanisms of interaction in species of this order. We used a pooled transposon mutant library of P. merdae49 to identify genes that modulate the impact of xenobiotics on bacterial fitness. The library encompasses barcoded transposon insertion mutants (Tn mutants) of >3,000 non-essential genes, enabling a genome-wide functional analysis. We conducted the competition assay against a panel of ten chemicals. TBBPA, BPAF, imazalil sulfate, fluazinam, closantel and emamectin benzoate were tested at concentrations of ≤20 μM, whereas glyphosate, propiconazole, perfluorooctanoic acid and perfluorononanoic acid (PFNA) were tested at ≥20 μM to ensure sufficient selective pressure (Methods). Cultures inoculated with the pooled library were grown to the early stationary phase, and Tn mutant selection was quantified using barcoded transposon sequencing (TnBarSeq) (Supplementary Data 6).
Gene hits were defined by an absolute log2[fold change] in mutant abundance of >0.25 and Padj < 0.05, relative to end-point vehicle dimethyl sulfoxide (DMSO) or media controls. The abundance changes were not attributed to global differences in cell doublings (Extended Data Fig. 4a)50. Among the compounds tested at ≤20 μM, TBBPA, BPAF and closantel exhibited the strongest effects in library selection, whereas 500 μM PFNA showed the most hits overall. In contrast, 20 μM PFNA, 20 μM perfluorooctanoic acid and 50 μM glyphosate did not show significant hits, consistent with the lack of effect on growth at those concentrations (Extended Data Fig. 4b).
Closantel, an anthelmintic, caused the strongest selection, with >90% of Tn mutants carrying insertions across over 20 different positions of the coding and promoter regions of the gene NQ542_01170 (Fig. 4a and Supplementary Data 7). This gene encodes a transcriptional regulator homologous to the efflux repressor acrR from B. uniformis and is co-located with tolC and RND-efflux genes, with conserved synteny51. Notably, acrR Tn mutants were also the top hit under TBBPA, a flame retardant, with >100-fold enrichment compared with the DMSO control, but were not enriched under any other pollutants (Fig. 4b,e).
Fig. 4: Chemical genetic screens in Bacteroidales reveal genes that modulate susceptibility and resistance to xenobiotics.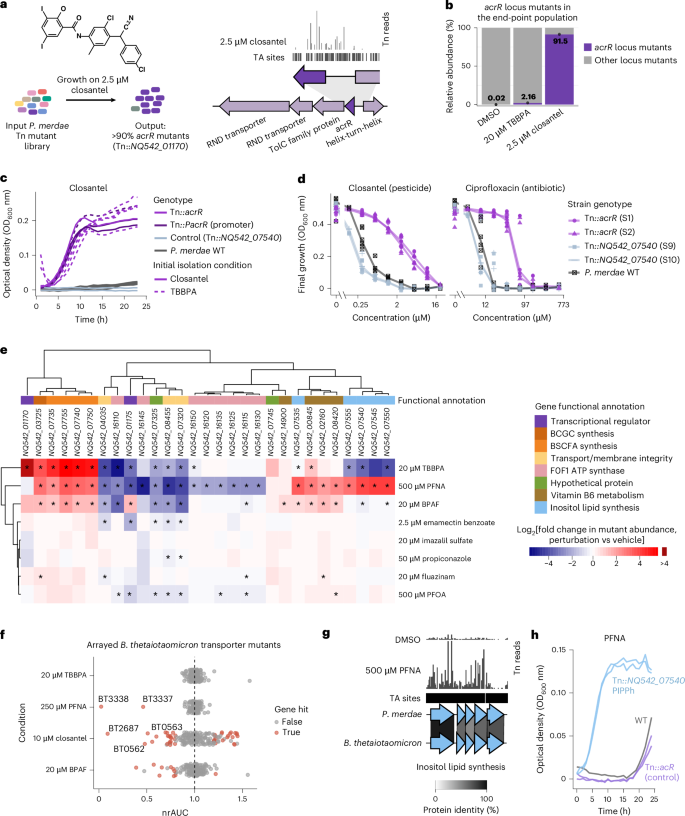
a, Overview of the closantel experiment and a representative plot of TnBarSeq insertion at the P. merdae acrR efflux regulator locus (NQ542_01170). The arrows show genes to scale, the black track shows the TA dinucleotide insertion sites and the vertical lines indicate insertion read counts. b, Relative abundances of acrR locus mutants under 2.5 μM closantel and 20 μM TBBPA, compared with the DMSO control. The bars represent mean values and data points are also shown (n = 2 for closantel and TBBPA; n = 3 for DMSO). c, Growth curves under 2 μM closantel of acrR coding and promoter region mutants (n = 7 independent insertions), the wild type (WT; n = 6) and a transposon insertion control (n = 2). The original isolation conditions of acrR mutants are shown as dashed (TBBPA) and solid lines (closantel). Results for the DMSO control are provided in Extended Data Fig. 5c. d, Dose–response curves under closantel and ciprofloxacin of acrR mutants and control strains. The points represent the OD600 value at 24 h, taken from three independent experiments with technical duplicates. The lines connect median OD600 values per genotype. The highest ciprofloxacin dose of 603.6 μM corresponds to 200 μg ml−1. e, Heatmap of the top TnBarSeq gene hits. The red and blue scale indicates the log2[fold change] in mutant abundance relative to that of the end-point control (red and blue represent enrichment and depletion, respectively). Statistical significance was assessed using TRANSIT resampling (permutation based, two sided and Benjamini–Hochberg adjusted). Values of Padj < 0.05 are marked with an asterisk. The functional categories are also colour coded. BCGC, branched α-galactosylceramide; BSCFA, branched short-chain fatty acids. f, Growth effects of xenobiotics on arrayed transporter mutants of B. thetaiotaomicron. The x axis shows the normalized relative area under the curve (nrAUC, the average rAUC of a mutant in xenobiotic perturbation, divided by the average rAUC in vehicle control), as described in the Methods (n = 185 mutants; two replicates). Hits are defined by an absolute effect on growth of >20% and P < 0.05. g, Representative plot of P. merdae TnBarSeq insertion in the inositol lipid biosynthesis gene cluster under 500 μM PFNA or DMSO control. Homology with B. thetaiotaomicron is shown using clinker. h, Growth curves of isolated P. merdae transposon mutants with mutation of a putative phosphatidylinositol phosphate phosphatase (PIPPh)-encoding gene (NQ542_07540), Results are shown for the wild type and transposon insertion control (Tn::acrR) under 250 μM PFNA. Curves for two independent insertion strains are shown, each with two replicates. Tn, transposon.
To further characterize acrR Tn mutant phenotypes, we isolated strains with transposon insertions at seven distinct positions within acrR coding and promoter regions after growth on closantel or TBBPA. All Tn::acrR isolates showed resistance to both chemicals, regardless of the compound they were isolated on (Fig. 4c and Extended Data Fig. 5c). When further evaluating two Tn::acrR strains, we observed an eightfold increase in the minimum inhibitory concentration (MIC) for closantel compared with the wild-type strain. Consistent with previous reports linking loss of acrR function to ciprofloxacin resistance in diverse bacteria52, we observed an up to 16-fold increase in the ciprofloxacin MIC for P. merdae Tn::acrR mutants compared with the wild type (Fig. 4d and Supplementary Data 8). Therefore, resistance to closantel and TBBPA can lead to cross-resistance to antibiotics such as ciprofloxacin.
The differential enrichment of acrR Tn mutants suggests a degree of specificity in the efflux of chemicals and/or that efflux alone is insufficient in tackling the other chemicals. However, some transporter Tn mutants showed broad pollutant sensitivity, indicating common pollutant tolerance mechanisms in P. merdae. For example, strains with insertions in genes of the fadL family of hydrophobic compound transporters (NQ542_07320 and NQ542_08455) were prevalent negative fitness hits across seven xenobiotics, whereas insertion mutants of the RND multidrug efflux locus NQ542_06240–50 were a significant hit across five chemicals (Extended Data Fig. 4c). Other common negative fitness hits were Tn mutants of the genes encoding components of the F0F1 ATP synthase complex (Fig. 4e), the loss of function of which has been associated with increased sensitivity to polymyxin antibiotics under anaerobic conditions53. This is consistent with bisphenol exposure leading to overexpression of F0F1 ATP synthase subunits in B. thetaiotaomicron23. The strains with Tn insertions in a gene encoding the putative lipid A phosphoethanolamine transferase of the eptA gene family (NQ542_04035) showed increased sensitivity in half of the tested xenobiotics. This enzyme class often mediates polymyxin resistance via modifications in membrane polarity54. Overall, genes implicated in efflux and membrane homeostasis modulated P. merdae survival following diverse xenobiotic challenges.
To assess whether the involvement of transporters in xenobiotic response is broadly conserved in the order Bacteroidales, we evaluated mutants of B. thetaiotaomicron, a member of a family distant to that of P. merdae55. We tested closantel, TBBPA, PFNA and BPAF on a curated subset of 185 transporter insertion mutants from the B. thetaiotaomicron arrayed transposon loss-of-function mutant library56. Growth was monitored over 24 h and we evaluated the response of each Tn insertion mutant by calculating the normalized relative AUC (nrAUC), comparing the xenobiotic treatment with the DMSO control (Extended Data Fig. 6a and Supplementary Data 9). The strongest growth reduction for closantel was observed at 2 and 10 μM for the Tn mutant of BT2687 encoding an RND-efflux pump (Fig. 4f and Extended Data Fig. 6b). This gene is part of an acrR-RND-tolC locus homologous to the P. merdae Tn::acrR closantel hit, suggesting a conserved efflux response (Extended Data Fig. 6c). Additional Tn mutants with conditional growth reduction on closantel included the co-localized genes BT0562 and BT0563, which encode multidrug ABC transporter genes. Loss-of-function Tn mutants of BT2687, BT0562 and BT0563 have previously been linked to increased susceptibility to antibiotics and biocides in B. thetaiotaomicron57. Exposure to 250 and 100 μM PFNA inhibited the Tn mutants with insertions at BT3337 and BT3338, which encode an RND-efflux pump needed for biofilm formation58, and tolerance to fusidic acid, chlorpromazine and thioridazine57 (Fig. 4f). The top homology and synteny matches for BT3337 and BT3338 in P. merdae are the RND-encoding loci NQ542_09525–35, which were a specific negative fitness hit for PFNA in the pooled screen (Extended Data Fig. 6d). As PFNA can be bioaccumulated by several Bacteroidales42, we assessed whether the phenotypes of Tn::BT3337 and Tn::BT3338 could be caused by increased compound uptake. Testing PFNA bioaccumulation across concentrations with LC–MS/MS showed no differences (Extended Data Fig. 6e,f and Supplementary Data 11), indicating other membrane-related mechanisms. Overall, the shared responses between P. merdae and B. thetaiotaomicron support conserved mechanisms of pollutant and antibiotic tolerance across Bacteroidales.
Chemical selection for the loss of beneficial metabolite pathways
P. merdae TnBarSeq insertion mutant gene hits showed enrichment in various Kyoto Encyclopedia of Genes and Genomes (KEGG) metabolic pathways for most (seven) of the compounds tested. TBBPA 20-μM selection showed a significant enrichment of Tn mutants mapping in the branched-chain amino acid (BCAA) degradation pathway (Extended Data Fig. 4d). The second top locus for positive selection under TBBPA was the porA catabolic gene cluster, containing four genes with Tn insertions with >30-fold enrichment (Extended Data Fig. 4e). This pathway is involved in the degradation of BCAAs into branched short-chain fatty acids59. Qiao et al.59 reported on a P. merdae porA mutant (with deletion of the NQ542_07740 gene, encoding pyruvate:ferredoxin oxidoreductase) with loss of its beneficial probiotic property of preventing atherosclerosis in mice. PorA is present in several gut bacteria and conserved across Gram-positive and -negative bacteria, including Clostridium sporogenes, where it contributes to immunomodulation60,61. The next top hit for positive selection under TBBPA was a gene encoding a putative BCAA aminotransferase (greater than tenfold enrichment; NQ542_03725). This gene encodes a close homologue of B. fragilis BF9343-3671 (74% identity; 100% coverage), whose knockout mutant stops producing immunomodulatory branched-chain α-galactosylceramide lipids, impacting colonic natural killer T cell regulation in monocolonized mice62. Besides TBBPA, NQ542_03725 mutants also show enrichment under 500 μM PFNA, 20 μM BPAF and 20 μM fluazinam, and the porA gene cluster is also selected under 500 μM PFNA and 20 μM BPAF (Fig. 4e). If these xenobiotics select for the loss of bacterial biosynthesis of BCAA-derived beneficial metabolites such as branched short-chain fatty acids and α-galactosylceramides in vivo, they could further impact human health via gut–heart or gut–immune axes.
Loss-of-function Tn insertion mutants of the secondary metabolism genes NQ542_07535–55 were positively selected under 500 μM PFNA challenge (~16-fold enrichment), but were negative fitness hits under 20 μM TBBPA (Fig. 4e). These genes were identified as being part of a putative inositol lipid biosynthetic gene cluster by homology to B. thetaiotaomicron genes (BT_1522–6) (Fig. 4g). This gene cluster is widespread in Bacteroidetes, and loss of inositol lipid production is associated with changes in the cell capsule and increased resistance to antimicrobial peptides63. To validate the phenotype, we isolated two P. merdae mutants (with transposon insertions at two locations of the gene NQ542_07540, which encodes putative phosphatidylinositol phosphate phosphatase) after enrichment in 500 μM PFNA. These strains showed increased resistance to PFNA and hypersensitivity to TBBPA at a range of concentrations, in agreement with pooled fitness (Fig. 4h and Extended Data Fig. 5d,e). To evaluate whether the increased resistance to PFNA was due to differences in compound uptake, we tested PFNA bioaccumulation, but no growth-independent differences were seen (Extended Data Fig. 5f), indicating the accumulation-independent function of inositol lipid metabolism in PFNA resistance. In summary, our genetic screen suggests that loss-of-function mutations affecting accessory metabolic pathways might be selected for under xenobiotic exposure, potentially altering the metabolic output of the gut microbiota.