
A quasi-experimental trial was conducted with 29 male athletes, including 19 adolescents with a mean age of 12.9 ± 0.6 years (10 Pre-PHV and nine Circum-PHV) and 10 adults with a mean age of 23.2 ± 2.1 years (Table 1), all of whom participated in intermittent sports (jiu-jitsu, soccer, volleyball, karate, and basketball), competing at regional (72%), national (17%), and international (11%) levels. Additionally, according to international guidelines for sports performance classification, the athletes in this study can be categorized as level 2 (Regional-level athlete; ~12–19% of the global population), level 3 (National–level athlete; ~0.014% of the global population), and level 4 (International-level athlete; ~0.0025% of the global population), respectively (on a scale ranging from 0 [sedentary] to 5 [Olympic-level athlete])22.
Table 1 Sample characterization.
Participants were spontaneously recruited from sports clubs in Natal city (Brazil). The inclusion criteria were: (i) participation in intermittent sports and regional, national, or international competitions for at least one year; and (ii) a physical activity level equal to or greater than 3.0 METs per week. The exclusion criteria were: presenting symptoms of upper respiratory tract infection, use of supplements that affect the immune system (e.g., vitamin C, glutamine, etc.), having diagnosed clinical diseases, or musculoskeletal injuries in the six months prior to the research. One adolescent participant was excluded due to cold symptoms during the assessments (Fig. 1). The study received approval from the Ethics Committee of the Federal University of Rio Grande do Norte (UFRN, Brazil) (#63337022.5.0000.5537) and is in compliance with the Declaration of Helsinki23. This experimental trial was registered a priori on the Open Science Framework Registries platform on 25/07/2024 under the DOI: https://doi.org/10.17605/OSF.IO/SCB2G. Fulfilling the criteria of the International Committee of Medical Journal Editors (ICMJE). All participants, and their guardians in the case of minors, were informed about the procedures and signed the informed consent or assent form, as applicable.
Fig. 1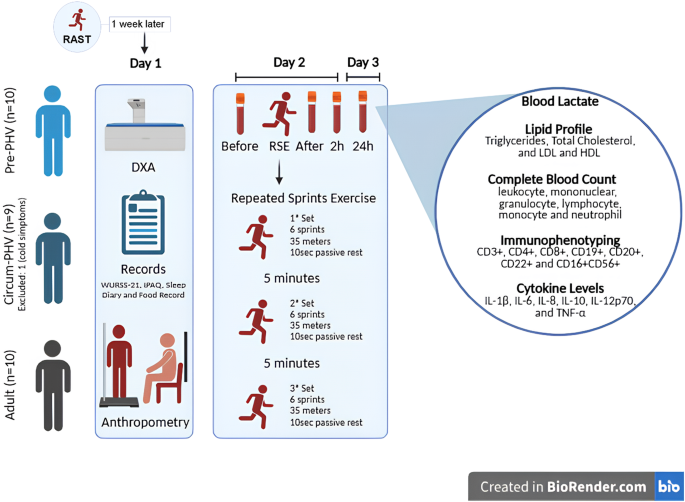
Procedures. RAST running-based anaerobic sprint test, PHV peak height velocity, n absolute number, RSE repeated sprint exercise, DXA dual-energy X-ray absorptiometry, WURSS-21 Wisconsin upper respiratory symptom survey-21, IPAQ international physical activity questionnaire. This figure was created in https://BioRender.com.
Sample size
The sample size was determined a priori through a pilot study involving 18 male subjects who were physically active, distributed into three groups: six adults, six Pre-PHV, and six Circum-PHV. The objective was to analyze the effect of RSE on total leukocytes in peripheral blood at different time points (Before, After, 2 h & 24 h post-RSE). Using G*Power® software (version 3.1, Düsseldorf, Germany)24, an α of 0.05, a β of 0.95, and an effect size of 1.46 were considered, derived from a partial Eta-squared (η²p) of 0.680 (time effect) identified in the pilot study. The employed analysis was the “F” statistic repeated measures ANOVA (with interaction between factors) for three groups and four repeated measures. Based on these parameters, a minimum sample size of nine subjects per group was indicated (F Critical (3.0): 5.14; Power: 0.968). To compensate for possible sample losses, one additional subject was included in each group (Fig. 1).
Procedures
Initially, participants underwent the Running-based Anaerobic Sprint Test (RAST), during which the best sprint time (in seconds) achieved by each individual was recorded and considered as their reference for maximal sprint performance. The RAST consisted of six 35-meter sprints, each separated by 10-sec of passive rest. One week later, participants underwent anthropometric assessments for sample characterization. Subsequently, after a 24-hour interval, blood samples were collected from all participants. Following blood collection, participants were taken to an official athletics track, where they completed a brief five-minute warm-up involving jumping and short walking bouts. Immediately after the warm-up, the repeated sprint exercise (RSE) protocol was initiated, consisting of three sets of six 35-meter sprints, with 10-sec of passive rest between sprints and five minutes of passive rest between sets. The intervals between sets were five minutes of passive rest. Additional blood collections were performed immediately after, 2 h, and 24 h post the RSE (Fig. 1).
During data collection, both participants and researchers were unaware of the maturation stage of the adolescents. Regarding the RSE protocol, an external collaborator applied the intervention, ensuring neutrality at this stage. Blood samples were collected by an external collaborator. During the hematological and flow cytometry analyses, the data were masked, preventing the evaluators from knowing to which participant the data belonged. For the statistical analyses, the data were also masked; thus, it was not known to which group or subjects the data belonged.
Anthropometry
The participants’ body mass was measured using a Filizola® digital scale with a capacity of 200 kg and a precision of 0.10 kg (São Paulo, Brazil). For this assessment, they were barefoot and wearing light clothing. Height was determined using a Sanny® stadiometer (precision of 0.1 mm) (São Paulo, Brazil). All measurements were performed by a single evaluator following the protocols of the International Society for the Advancement of Kinanthropometry (ISAK)25. The technical error of intra-observer anthropometric measurements was ≤ 1.0%26. To compose the maturation profile of the adolescent participants, the heights of their biological parents were also recorded. The body mass index (BMI) was calculated by dividing body weight in kilograms by height in meters squared (BMI = Weight (kg) / Height (m)²). Levels of fat-free mass were analyzed using dual-energy X-ray absorptiometry (DXA) with LUNAR® / GE PRODIGY – LNR 41.990 equipment (Washington, DC, USA), using the enCORE software, GE Healthcare®, version 15.0 (Madison, WI, USA). Specific algorithms for this population were employed for the adolescent participants27. During the assessments, the DXA equipment operated with the following configuration: whole body assessment, voltage (kV): 76.0, current (mA): 0.150, radiation dose (µGγ): 0.4 (very low, with no health risk). The basal metabolic rate was automatically estimated by the DXA equipment algorithms based on the body composition results.
Symptoms of upper respiratory tract infection
On the day of the RSE implementation, before the first blood sample collection, we assessed symptoms of upper respiratory tract infection (URTI) using the Wisconsin Upper Respiratory Symptom Survey-21 (WURSS-21)28,29. Only volunteers who did not present URTIS were retained as participants in the study. It is important to mention that this tool was previously used in a study with young athletes and validated for the hebiatric population30,31.
Physical activity level
The level of physical activity was assessed using the International Physical Activity Questionnaire in its web version32 (web-IPAQ; http://www.webipaq.com.br/), validated to analyze metabolic equivalents (METs) related to energy expenditure in physical activities. The questionnaire covers activities related to work, transportation, household tasks, and leisure/sports. The web-IPAQ automatically calculates METs for habitual energy expenditure, providing scores for each category and a total score. Based on the total METs, the web-IPAQ classifies the level of physical activity as low, moderate, or high. Participants completed the web-IPAQ in the presence of at least one researcher and one tutor (in the case of adolescents) to assist in interpreting the questions. All participants in this study were classified as having a high level of physical activity (> 3.0 METs), according to the classification of the web-IPAQ (Table 1).
Sleep pattern
The sleep pattern was assessed using a sleep diary33, in which participants recorded the time they went to bed, their perception of the time taken to fall asleep, the time of awakening, the total time in bed, and whether there were any interruptions during the night. Based on these records, we calculated sleep efficiency (considered good when > 85%)33. The records were made on the day of the RSE (referring to the previous night) and on the day after the RSE (referring to the day of the intervention) (Table 1).
Dietary pattern & lipid profile
During the study, participants were instructed to avoid stimulating foods, such as caffeine, taurine, and pepper. The dietary pattern was assessed using 24-hour dietary recall questionnaires (R-24 h)34,35. In addition, the baseline lipid profile was analyzed using blood samples collected on the day of the RSE (time point Before RSE). For more details on nutritional parameters and lipid profile, see Supplementary Material 1 (Table S1 and Fig. S1).
Biological maturation profile
We analyzed the BM profile through comparisons between adolescents (individuals in the maturation process) and adults (mature individuals). We also considered the percentage estimate of final height in adulthood, the estimate of peak height velocity (PHV), and the estimate of puberty scores. To calculate the percentage of final height, we utilized the mathematical model developed by Khamis and Roche19 applicable to children and adolescents of both sexes aged between four and 17.5 years:
\(\begin{gathered} Final{\text{ }}height{\text{ }}\left( {inches} \right){\text{ }}={\text{ }} – 2.87645\,+\,Height{\text{ }}\left( {inches} \right){\text{ }}\left( {1.11342} \right)\,+\,Weight{\text{ }}\left( {pounds} \right){\text{ }}( – \hfill \\ 0.013184)\,+\,Average{\text{ }}height{\text{ }}of{\text{ }}parents{\text{ }}\left( {inches} \right){\text{ }}\left( {0.32748} \right),{\text{ }}where:{\text{ }}\left( {inches} \right)\,=\,inches. \hfill \\ \end{gathered}\)
The stage of PHV was determined by the mathematical model proposed by Moore et al.20, for male individuals aged between eight and 18 years:
PHV = − 8.128741 + [0.0070346 × (Age [years] × Sitting height (cm)], where: (cm) = centimeters.
Based on the result of the mathematical model, PHV can be classified as: Pre-PHV (<-1), Circum-PHV (between − 1 and 1), and Post PHV (> 1)20. The puberty score was calculated using the mathematical model proposed by Almeida-Neto et al.36, for male subjects aged between six and 18 years:
Puberty (score) = -17.357 + (0.603 × Age (years)) + (0.127 × Sitting height (cm)), where: (cm) = centimeters.
Thus, the puberty scores determine the Tanner stages as follows: I ≤ − 1.815; II = − 1.816 to − 0.605; III = − 0.606 to 0.695; IV = 0.696–3.410 & V > 3.410. Stage I is prepubertal, stages II to IV are pubertal, and stage V is postpubertal36.
Repeated sprints exercise
For the prescription of the RSE protocol, we conducted the Running-based Anaerobic Sprint Test (RAST) one week prior to the intervention. The RAST consists of six 35-meter sprints interspersed with 10-sec of passive recovery37. The best sprint time (in seconds) achieved by each participant during the RAST was recorded and used as the individual reference for maximal sprint performance (Table 1). Consequently, the RSE protocol applied in the present study maintained a sprint distance and recovery structure similar to those of the RAST, ensuring consistency with the participants’ assessed sprint capacity. It is important to highlight that both the prior RAST test and the RSE protocol were conducted on the same athletics track and at similar times of day, in order to minimize potential environmental and circadian influences on performance outcomes.
In the 24 h prior to the RSE, participants were instructed to avoid intense physical activities. The RSE involved the performance of 18 high-intensity sprints on an official athletics track, with an average temperature of 27.1 ± 0.7 °C. The protocol was divided into three sets, each containing six sprints of 35 m, interspersed with 10-sec of passive rest. Between the sets, participants had a passive interval of five minutes, during which they remained seated in back-supported chairs, with their knees flexed at 90°. During the RSE, participants received verbal encouragement, and the rest time between each sprint was monitored by two timers. A third timer controlled the intervals between the blocks. All timers used digital stopwatches (Monalisa®, São Paulo, Brazil). Participants were instructed to run as fast as possible to ensure the high intensity of the exercise.
To confirm the high intensity of the protocol, the best and worst sprint performances recorded during the RSE were analyzed. These data, presented in Table 1, allow for comparison with the best performance obtained in the RAST protocol, which served as a reference for both the RSE prescription and the determination of the participants’ maximal sprint effort.
Rating of perceived exertion
The rating of perceived exertion (RPE) was used to assess the intensity of the RSE, according to the scale proposed by Borg38. The application of the scale was conducted at the end of the last sprint of the RSE. The scale, which is visual and monochromatic, presented values ranging from 6 to 20, where 6 corresponded to absolute rest and 20 to maximum effort. It is noteworthy that, 72 h prior to the RSE, participants underwent a prior familiarization with the RPE, and on the day of the RSE, they were familiarized again.
Blood collection
At each time point of the present study (Before, After, 2 h & 24 h post-RSE), 10 mL of peripheral blood was collected from the antecubital vein of the upper limbs using the vacuum method (Fig. 1). The blood was stored in tubes containing EDTA anticoagulants (BD-Vacutainer, EDTA-K2 5.4 mg Plus Plastic) and was sent for laboratory analyses.
Blood lactate
We analyzed the serum lactate levels from peripheral blood using the enzymatic method through a systematic integrated biochemical equipment (Dimension EXL 200 – Siemens®, São Paulo, Brazil). We used the appropriate kit for the equipment and followed the manufacturer’s recommendations (LA Flex®, reagent cartridge kit [DF16]).
Complete blood count
The total leukocyte count, total mononuclear count, total granulocyte count, lymphocyte count, monocyte count, and neutrophil count were performed using automated cell counting with a Cell-Dyn® (3,000, Unipath Corp., Mountain View, CA) device. The data were expressed in cells per liter (10^9\L) and percentage (%) based on total leukocytes. All cells were obtained from peripheral blood.
Immunophenotyping
To determine the lymphocyte profile, readings were performed using the Beckman Coulter®ฏ flow cytometer (Model DxFLEX, serial number BF01001, New York, USA), with an average of 20,000 cellular events per subject and time points (Before, After, 2 h & 24 h post-RSE). The final analysis included 60,000 randomized cellular events according to a rigorous data processing protocol (5,000 per subject and per time point). The data were processed using the FlowCore package available in the R programming software (Version: 4.3.0, R Foundation for Statistical Computing®ฏ, Vienna, Austria) for reading, doublet removing, quality control with the FlowAI package, and applying the “logicle” transformation for the cell events lecture (Parameters: w = 0.5; t = 1,000,000; and m = 4.5). Subsequently, compensation was applied according to the spillover notation during data acquisition, followed by intersection merging and immunophenotypic analysis. The analyses allowed for the assessment of the heterogeneity of lymphocyte populations within the groups and time points analyzed (Before, After, 2 h & 24 h post-RSE). For subsequent analyses, the data were also grouped according to the characteristics of lymphocyte populations (T-helper [CD3+ & CD4+], total B cells [CD19+, CD20+ & CD22+], and total cytotoxic cells [CD8+ & CD16 + 56+]). We also calculated the CD4+/CD8 + ratio. The data were generated in arbitrary units of fluorescence (A.U.F.) and as a percentage (%) based on total lymphocytes.
In Fig. 2a, the X axes show the monoclonal antibodies used as markers: CD3+, CD4+, and CD8 + for T lymphocytes; CD19+, CD20+, and CD22 + for B lymphocytes; and CD16 + 56 + for total NK cells. The corresponding gating strategy is represented in Supplementary Material 1 at Fig. S2a. These data reflect the immunophenotypic assessment of the 29 participants evaluated at different time points in the present study, stratified by stages of somatic biological maturation (Pre-PHV, Circum-PHV & Adult). In Fig. 2b, the histograms used for the acquisition of cellular events based on the evaluated parameters.
Fig. 2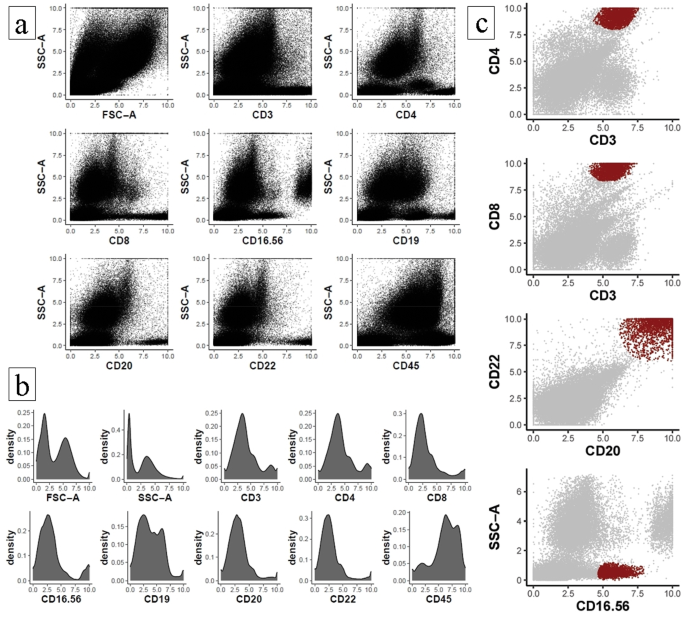
Graphical representation of dot-plot histograms obtained by flow cytometry of T helper, T cytotoxic, B cells and natural killer cell lymphocyte subpopulations. (a) Cellular heterogeneity based on cellular complexity (SSC-A) and lymphocyte parameters. (b) Histograms for individual assessment of cellular event acquisition. (c) Highlight of the final gated immune cell populations based on specific surface markers.
In Supplementary Material 1, the Fig. S2b presents the histograms with the corresponding gatings for each tube, followring a panel-based logic, including the monoclonal antibodies and SSC-A and FSC-A parameters. These plots offer an overview of the immunophenotypic distributions that complement the scatter plots in (Fig. 2a). Figure 2c represents the analyzed populations, including T helper lymphocytes (CD3+ × CD4+), cytotoxic T lymphocytes (CD3+ × CD8+), B lymphocytes (CD19 + with CD20+ × CD22+), and total NK cells, including NK-T cells (SSC-A × CD16-56+), according to the established gates. Furthermore, it is important to highlight that the NK cell population was identified using the CD16/56 antibody combination. However, CD16 expression was not considered in the gating strategy, as this marker is commonly associated with neutrophils. Instead, the focus was placed on cells exhibiting low SSC-A, a characteristic region for lymphocytes, with positive expression of CD56 within this gate, which classically defines NK cell populations.
Cytokine levels
We analyzed the concentrations of the following cytokines: interleukins (IL)-1β, IL-6, IL-8, IL-10, IL-12p70, and tumor necrosis factor α (TNF-α)39. For this purpose, we utilized peripheral blood samples through flow cytometry using a BD Biosciences® device (Model BD FACSCanto™ II Flow Cytometer, serial number V96100619, New York, USA) with the BD™ Cytometric Bead Array (CBA) Human Inflammatory Cytokines kit (São Paulo, Brazil); all procedures followed the recommendations provided by the kit manual40. After flow cytometry, the data were processed with the assistance of the FCAP Array™ software from BD Biosciences® (Version 3.0; New York, USA).
Statistics
The normality of the data was tested using the Shapiro-Wilk test, skewness and kurtosis (-1.96 /1.96), and by QQ-line plotting. Thus, the data were expressed as mean (±) and standard deviation. Subsequently, through a repeated measures ANOVA analysis, we conducted comparisons between the different time points of the present study (Before, After, 2 h, and 24 h post-RSE), considering the effect of BM as a condition (Pre-PHV, Circum-PHV, and Adult). The homoscedasticity assumption was tested using Levene’s test, independence by the χ2 test, and sphericity by the Greenhouse-Geisser test. No assumptions were violated. Point differences were indicated by Bonferroni post-hoc analysis. The effect size of the differences observed in the repeated measures models was determined using partial eta squared (η²p), with magnitude classified as follows41: small (< 0.01), medium (between 0.02 and 0.06) and large (> 0.14). For the pairwise comparisons conducted via Bonferroni post hoc test, the effect size was assessed using Cohen’s d, interpreted according to the following thresholds42: small (< 0.20), medium (≥ 0.20 and < 0.50), and large (≥ 0.50). All previously mentioned analyses were performed using the open-source software Jamovi® (Version 2.3.18, Sydney, Australia), considering significance at p < 0.05. Subsequently, we assessed the power of the ANOVA models employed in the present study; for this, the open-source software G*Power (version 3.1, Düsseldorf, Germany)24 was used in the configuration for “F” family tests for repeated measures, considering interactions among factors for post-hoc power calculations; we considered η2p values, with a standard value of 0.5 for correction between representation measures and a standard α of 0.05 for all power analyses. Thus, power was considered acceptable when ≥ 0.80024. Figure 2 of the present study was produced using the open source software R (Version 4.3.0, R Foundation for Statistical Computing®, Vienna, Austria), and the other figures were produced using the GraphPad Prism® software (Version 8.01 (244), California, USA).