
Animal use and care
Htra2 mutant mice (mnd2; strain no. 004608, background: C57BL/6J) were obtained from The Jackson Laboratory. Breeding was performed to generate homozygous mutants and corresponding controls. Both WT and heterozygous littermates were included in experiments, as heterozygotes are phenotypically normal. Pups were weaned and genotyped approximately 21 days postnatally. No sex-based bias was introduced in the study design. All animals were housed in a temperature-controlled facility maintained at 20–22 °C with 30–70% relative humidity under a 12-h light/dark cycle (lights on at 07:00). All animals had ad libitum access to standard chow diet (5053, PicoLab Rodent Diet 20) and water, with additional feed and hydrated gel packs added to cages of newly weaned pups. All animal procedures were approved by the Institutional Animal Care and Use Committee (IACUC) at UCSF/Gladstone Institutes.
In vivo hypoxia exposure and survival curves
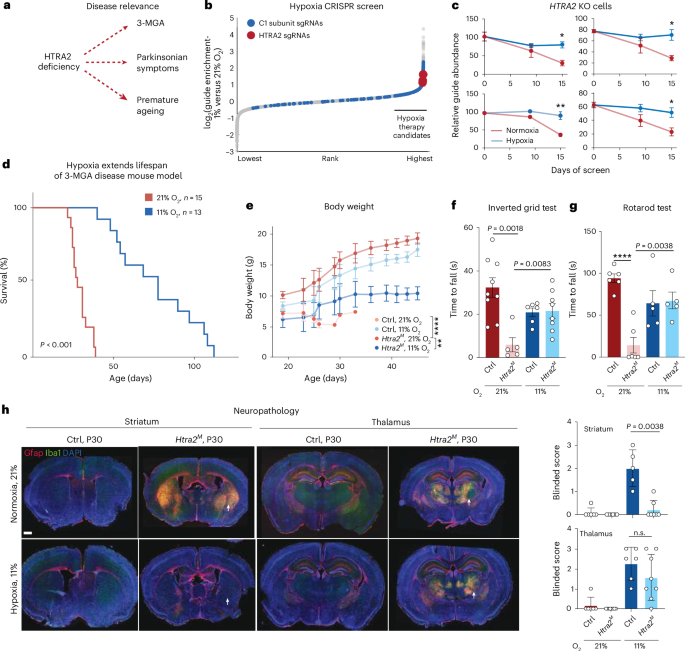
The hypoxia chamber setup is as previously described49. Mice were housed in 472 L acrylic boxes. Eleven per cent FiO2 was obtained by mixing a constant flow of nitrogen and air generated by splitting room air using a LABTEK 4CPx-P nitrogen generator. Soda lime was added to the chambers as a CO2 scavenger. The oxygen concentration was measured at the outlet port of the chamber with an O2 sensor (Vernier), which was calibrated monthly. Starting at postnatal day 11, pups were transferred to the appropriate oxygen condition along with their mother (they were not weaned until ~P21), and the number of pups was recorded three times per week. If any pup was found deceased, tissue from the carcass was collected for genotyping. Between P16 and P18, pups were ear tagged for identification and genotyped, with body weights recorded three times weekly. Monitoring continued until natural death, scheduled euthanasia, or euthanasia for tissue collection.
Brain immunofluorescence
Mice (~4 weeks old) were transcardially perfused with PBS and 4% PFA (10 ml each). Brains were post-fixed overnight in 4% PFA at 4 °C, washed in PBS, cryoprotected in 30% sucrose/PBS and frozen at −20 °C. Coronal sections (40 µm) were collected serially in cryoprotectant. Free-floating sections were permeabilized in 0.2% Triton X-100/PBS and blocked in 4% FBS (1 h, room temperature). Sections were incubated with primary antibodies overnight, followed by secondary antibodies (2 h to overnight, room temperature) and mounted on positively charged slides. The primary antibodies used were IBA1 (1:250, Genetex GTX100042, RRID:AB_1240434) and GFAP (1:1,000, Sigma MAB3402, RRID: AB_94844). Secondary antibodies used were donkey anti-mouse-594 (1:250, Invitrogen A32744, RRID: AB_2762826) and donkey-anti-rabbit-488 (1:250, Invitrogen A21206, RRID:AB_2535792). Imaging was performed using a Leica slide scanner, and lesion quantification across samples was conducted by blinded scoring.
Inverted grid test
A wire grid (1 cm × 1 cm, for example, cage lid) was securely positioned above soft bedding or foam padding to prevent injury from falls. Mice (~4 weeks old) were placed on the grid and gently inverted 180°, allowing the animal to hang upside down. The latency to fall was recorded. Three trials were performed per mouse with 5-min rest intervals. Trials in which the mouse jumped intentionally were excluded or repeated. The average hang time was calculated per mouse.
Rotarod test
Motor coordination and balance were assessed using an accelerating rotarod apparatus. Mice (~4 weeks old) were placed on a rotating rod that accelerated from 4 to 40 rpm (5 rpm per min) and latency to fall was recorded automatically. Each mouse performed three trials per session with at least 10 min between trials to minimize fatigue. The average latency to fall was used for statistical analysis.
Cell lines
K562 (CCL-243; RRID: CVCL 0004, ATCC authenticates cell line identity before distribution) and HEK293T (from UCSF Cell and Genome Engineering Core, validated by STR profiling, confirmed negative for mycoplasma contamination by PCR (ATCC, 30–1012K)) were used in this study. These were cultured in complete medium (DMEM; Gibco, 11995073) supplemented with 10% FBS (Corning, MT35015CV) and 1% penicillin–streptomycin–glutamine (Corning, MT30009CI). Cells were maintained by passaging before reaching a confluency of 1 × 10⁶ cells ml−1. To generate KO cells, sgRNAs were cloned into the lentiCRISPRv2 vector. Lentiviral particles were produced by co-transfecting HEK293T cells with the sgRNA-containing lentiCRISPRv2 plasmid together with the packaging plasmids psPAX2 and VSV-G using X-tremeGENE transfection reagent. Viral supernatants were collected and used to transduce target cells, which were subsequently selected with puromycin for 72 h to enrich for successfully transduced cells.
K562 proteomics sample preparation, mass spectrometry and data analysis
K562 cells (n = 2, control and n = 3, HTRA2 KO) were seeded at 1 × 10⁵ cells ml−1 in six-well plates and cultured under normoxic (21% O2) or hypoxic (1% O2) conditions. Cells were collected at day 3, washed with PBS and flash-frozen for TMT proteomics at the Sanford Burnham Proteomics Core. In brief, cells were lysed in 8 M urea/50 mM ammonium bicarbonate with Benzonase, proteins quantified by the BCA assay, then reduced, alkylated and digested with trypsin/Lys-C. Peptides were desalted, TMT10plex-labelled, pooled and fractionated by high-pH reversed-phase chromatography before nanoLC–MS/MS analysis on a nanoACQUITY–Orbitrap Fusion Lumos system (74-min gradient). Data were processed in MaxQuant (v1.5.5.1) against the human UniProt database (1% false discovery rate (FDR)), with carbamidomethylation as fixed and methionine oxidation/N-terminal acetylation as variable modifications. Reporter intensities were log2-transformed and locally estimated scatterplot smoothing normalized. Differential abundance analysis was performed using g:Profiler and R (v4.6.0).
HEK proteomics sample preparation, mass spectrometry and data analysis
HEK293T cells (n = 4 across control, CLPB, HTRA2 and HAX1 KO conditions) were lysed in modified RIPA buffer (10% SDS, 50 mM ammonium bicarbonate and Halt Protease Inhibitor) with Benzonase (15–20 min, room temperature), sonicated (10 cycles), and centrifuged at 20,000g for 15 min at 4 °C. Protein concentrations were determined by the BCA assay and lysates were sent for proteomics to UC Davis Proteomics Core. In brief, proteins were processed by S-Trap digestion (DTT reduction, iodoacetamide alkylation, trypsin 1:100) and analysed by nanoLC–DIA-PASEF on an Evosep One–timsTOF HT system (m/z 350–1,191). Data were searched in Spectronaut (DirectDIA) against the human UniProt database (1% FDR, ≤2 missed cleavages), with carbamidomethylation as fixed and methionine oxidation/N-terminal acetylation as variable modifications and normalized by local regression.
Striatum tissue proteomics
Striata were microdissected from frozen hemi-brains of ~4-week-old mice (n = 5 per group) sectioned coronally at 400–500 µm using a McIlwain Tissue Chopper after embedding in 0.6% low-melting-point agarose (Invitrogen, #15517-014). Sections were transferred into PBS with protease inhibitors (Roche, #05892953001), striata dissected under a microscope, and flash-frozen at –80 °C. Samples were prepared using the S-Trap Mini Kit (K002-MINIX-0010KT) and sent to UC Davis Proteomics Core. Briefly, proteins were quantified by BCA assay, processed by S-Trap digestion (DTT reduction, iodoacetamide alkylation, trypsin 1:100, 37 °C overnight), and eluted peptides analysed by nanoLC–PASEF on a nanoElute–timsTOF Pro system (30-min gradient). Data were searched in FragPipe (v19) against the mouse UniProt database (1% FDR, ≤2 missed cleavages), with carbamidomethylation as fixed and N-terminal acetylation, methionine oxidation and deamidation (N/Q) as variable modifications. Label-free quantification was performed using IonQuant with match-between-runs enabled.
SDS−PAGE westerns
Brain tissues previously stored at –80 °C were retrieved on dry ice and lysed in 100–200 µl of freshly prepared RIPA buffer (volume adjusted based on tissue size to achieve a near-transparent lysate). Homogenization was performed using a motorized homogenizer for 1 min (30 s on, 30 s off), followed by sonication for 5 min (30 s on, 30 s off). Lysates were then centrifuged and the supernatant was collected. Protein concentration was measured using 1 µl of lysate with the BCA assay.
For cell lysates, frozen cell pellets were resuspended in 100 µl RIPA buffer and incubated on ice for 15–30 min with intermittent mixing. Lysates were centrifuged at maximum speed for 15 min at 4 °C and the supernatant was transferred to fresh tubes for the BCA assay. Samples at equal concentrations were prepared in 1× Laemmli buffer and boiled at 95 °C for 5 min. Proteins were separated on 8–16 % gradient Bio-Rad SDS–PAGE gels and transferred onto PVDF membranes using a semi-dry transfer apparatus. For blocking buffer, 2% milk in TBST was used. The primary antibodies used were NDUFS1 (1:10,000, Abcam ab169540, RRID: AB_2687932), NDUFS4 (1:1,000, abcam ab139178, RRID: AB_2922810), NDUFV1 (1:1,000, Proteintech 11238-1-AP, RRID: AB_2149040), NDUFA9 (1:1,000, Thermo Fisher 459100, RRID: AB_10376187), NDUFB11 (1:1,000, Abcam ab183716, RRID: AB_2927481), HTRA2 (1:1,000, R&D AF1458-SP, RRID: AB_2280094), VDAC (1:1,000, Abcam ab14734 RRID: AB_443084), Actin (1:1,000, CST 4967S, RRID: AB_330288), OPA1 (1:1,000, BD 612606, RRID: AB_399888, Lot# 8135704) and IMMT (1:5,000, Proteintech, 10179-1-AP, RRID: AB_2127193). The secondary antibodies used were sheep anti-mouse HRP (1:5,000, Cytiva NA931, RRID: AB_772210) and donkey anti-rabbit HRP (1:5,000, Cytiva, NA934, RRID: AB_772206).
BN-PAGE westerns
Fifty million K562 cells were resuspended in mitochondrial isolation buffer (0.32 M sucrose, 1 mM EDTA, 10 mM Tris–HCl, pH 7.4) with 1× cOmplete protease inhibitor (Roche) on ice and homogenized with ten strokes of a glass dounce homogenizer. Lysates were centrifuged at 1,000g to pellet nuclei and the supernatant was re-centrifuged at 13,000g to enrich mitochondria. Pellets were stored at –80 °C until BN-PAGE processing. BN-PAGE was adapted from published protocols53. Mitochondria were resuspended at 10 µg µl−1 in native PAGE sample buffer and solubilized with 4 µg digitonin (Sigma) per microgram mitochondria for 10 min on ice, followed by centrifugation at 16,000g for 30 min at 4 °C. Supernatant was mixed with Coomassie Blue G loading buffer (1:3 volume) and supercomplexes resolved on native PAGE 3–12% Bis–Tris gradient gels (Thermo Fisher Scientific) using dark blue cathode buffer (150 V, 30 min), then light blue cathode buffer (300 V, 90 min). Proteins were transferred to methanol-activated PVDF membranes at 100 V for 60 min and blocked with 5% non-fat milk in TBST before immunoblotting.
C1 activity assay
Permeabilized-cell respirometry was performed on a Seahorse XFe96 Analyser at 37 °C. Control and HTRA2 KO K562 cells were seeded at 125,000 cells per well in Cell-Tak-coated (20 µg per well; Corning, 354240) XFe96 microplates and attached by centrifugation (500g, no brake/acceleration). Before the assay, the medium was replaced with MAS buffer (70 mM sucrose, 220 mM mannitol, 10 mM KH2PO4, 5 mM MgCl2, 2 mM HEPES and 1 mM EGTA, pH 7.2) containing 3 nM XF Plasma Membrane Permeabilizer (Agilent, 102504-100), 4 mM ADP (Thermo Fisher, J60672) and C1 substrates (10 mM pyruvate/1 mM malate or 10 mM glutamate/10 mM malate). C1-driven respiration was calculated by subtracting oxygen consumption resistant to piericidin A (Enzo, ALX-380-235-M002) and antimycin A (Sigma, A8674).
Sedimentation assay
For striatum tissue, mitochondria were isolated from dissected striata by homogenizing frozen hemi-brains in MHSE (210 mM mannitol–5 mM HEPES–70 mM sucrose–1 mM EGTA) buffer (30 strokes, chilled Dounce homogenizer). Homogenates were centrifuged at 600g (15 min, 4 °C) to remove debris, and mitochondria were pelleted at 12,000g (15 min, 4 °C), washed once in MHSE and resuspended in lysis buffer (30 mM Tris–HCl pH 7.4, 200 mM KCl, 0.5% Triton X-100, 5 mM EDTA, 0.5 mM PMSF and protease inhibitors). Protein concentration was determined and pellets were frozen. For sedimentation, mitochondria (400 µg) were lysed in chilled lysis buffer with protease inhibitors (1,400 rpm, 15 min, 4 °C).
For cell samples, cells were washed in DPBS, pelleted (300g, 5 min, 4 °C), and resuspended in hypotonic buffer (20 mM HEPES pH 7.4, 2 mM MgCl2, 10 mM KCl, 1 mM DTT and protease inhibitors) at 5× packed cell volume. After 5 min on ice, cells were homogenized through a 25 G needle (6 passes) and cleared twice at 1,000g (1 min, 4 °C). The supernatant was layered onto ice-cold 8% glycerol and centrifuged at 10,000g (1 min, 4 °C) to pellet mitochondria. Pellets were resuspended in RIPA with protease inhibitors and quantified by the BCA assay.
For the sedimentation assay, equal amounts of lysates were transferred into ultracentrifuge tubes, after balancing the weight with lysis buffer they were spun at 125,000g for 20 min at 4 °C. Post-centrifugation, supernatants were collected and precipitated with cold TCA. Both the supernatant and pellet fractions were resuspended in 3× Laemmli buffer for SDS–PAGE/western blot analysis as described above. The primary antibodies used were HTRA2 (1:1,000, Proteintech 15775-1-AP, RRID: AB_2122835, Lot# 00104148), CLPB (1:1,000, Proteintech, 15743-1-AP, RRID: AB_2847900, Lot# 00089384), HAX1 (1:1,000, Proteintech, 11266-1-AP, RRID: AB_2263720, Lot# 00023547), NDUFA13 (1:1,000, Proteintech, 10986-1-AP, RRID: AB_2150609) and TIMM50 (1:1,000, Proteintech, 22229-1-AP, RRID: AB_2879039, Lot# 00124369).
NAD+/NADH measurement
Intracellular NAD+ and NADH were measured using the NAD/NADH-Glo Assay (Promega, G9071) following the manufacturer’s instructions. Cells were plated at 4 × 10⁵ cells ml−1 in 6-well plates and treated with or without 500 nM rotenone for ~1.5–2 h before collection. Cells were lysed in 1% DTAB, and lysates were split for selective NAD+ (acid-treated, 0.4 N HCl) and NADH (base-treated) quantification. Samples were incubated at 60 °C for 15 min, neutralized, combined with detection reagent in white 96-well plates and luminescence recorded after 30–60 min. Values were background-subtracted and normalized to calculate NAD+, NADH and NAD+/NADH ratios.
NDI overexpression assay
Control (dummy), HTRA2 (HT) KO and NDUFS2 (S2) KO cells were retrovirally transduced to overexpress yeast Ndi1 (NADH dehydrogenase) or empty vector control. Cells were plated in complete DMEM (10% FBS + penicillin–streptomycin–glutamine) on day 0 in six-well plates and counted using a Beckman Coulter Counter, on day 3 to assess proliferation.
RNA-seq library preparation and analysis
Total RNA was isolated from ~4-week-old mouse striata and purified using the Direct-zol RNA MicroPrep Kit (Zymo Research, R2062) as described by the manufacturer. RNA-seq library preparation from 500 ng of total RNA was performed according to the manufacturer’s instructions of the QuantSeq 3′ mRNA-Seq V2 Library Prep Kit (Lexogen, 193.384). Final libraries were quantified using a QubitTM 1X dsDNA HS Assay Kit (Thermo Fisher Scientific, Q33231) and subjected to quality control before sequencing. Libraries were single-end sequenced on NovaSeq X Plus.
FASTQ files were processed to assess quality by determining general sequencing bias, clonality and adaptor sequence contamination. RNA-seq reads were aligned to the mm10 mouse reference genome using STAR (v2.7.10a)54. Gene expression levels were calculated using HOMER (v4.11)55 by counting all strand specific reads within exons. Only the most abundant transcripts, including multiple alternative variants, were selected for each gene, and the genes with a length smaller than 250 bp were removed. Transcripts per million (TPM) were used to evaluate the correlation among replicates. Differential gene expression was calculated using DESeq2 (v1.46.0)56 to assess both biological and technical variability between experiments.
IP and proteomics
HTRA2 and CLPB IPs (n = 3 biological replicates per condition, including IgG and no-antibody controls) were performed for proteomics. ~10 million (×3 for IP) cells were crosslinked with 0.2 mM DSP, quenched with 1 M Tris (pH 7.5) and lysed in 0.5% NP40 IP buffer with protease/phosphatase inhibitors. For HTRA2 IP, antibody (~2.5 μg per 1 mg protein) was pre-conjugated to 75 μl Protein G Dynabeads (Thermo Fisher, 10004D); for CLPB IP, antibody (~7 μg per 250 μg protein) was added directly to lysate overnight at 4 °C before bead capture (75 μl, 1–1.5 h, room temperature). Beads were washed in decreasing detergent concentrations (3× 0.05% NP40, 2× detergent-free). Input and flow-through samples were collected for western blotting to assess IP efficiency. Proteins were eluted via on-bead digestion using a urea-based reduction buffer, followed by alkylation with iodoacetamide, reduction with DTT and overnight digestion with trypsin at 37 °C. A second digestion step with a small amount of trypsin was performed the next morning. Peptides were recovered by combining eluates and wash fractions and samples were stored at –80 °C and sent for proteomic analysis to UC Davis Proteomics Core.
For mass spectrometry, peptides (0.6 µg) were separated on an UltiMate 3000 RSLC system using a PepSep C18 column (150 µm × 8 cm, 1.5 µm; 40 °C, 650 nl min−1, 60 min gradient) and analysed on an Orbitrap Exploris 480 in DIA mode (spray voltage 1.8 kV, capillary temperature 275 °C). Full MS scans were acquired at 120,000 resolution (m/z 350–1,400, AGC 300%, 45 ms), with 34 DIA isolation windows (21 Da, NCE 30%, AGC 1,000%). Data were processed in Spectronaut v20 (DirectDIA) as described above for HEK proteomics.
For westerns, beads were dissolved in 30 µl 2× sample buffer, boiled at 95 °C for 5 min with shaking, then briefly spun down and the supernatant collected on a DynaMag as the eluent. The primary antibodies used were HTRA2, CLPB (as described above for WB) and IgG (Proteintech, 30000-0-AP, RRID: AB_2819035).
Protein expression and purification
PARL-cleaved CLPB was purified as previously described33. N-terminal 6xHis-HTRA2 and C-terminal 6xHis-NDUFA13 were expressed in E. coli BL21 (DE3) RIL cells (induced with 1 mM IPTG, 15 °C, 16 h). Cells were lysed by high-pressure homogenization in HTRA2 binding buffer (50 mM HEPES–KOH pH 8.0, 750 mM NaCl, 10 mM MgCl2, 20% glycerol, 2 mM β-mercaptoethanol and 2 µM pepstatin A) or NDUFA13 binding buffer (8 M urea, 20 mM sodium phosphate pH 8.0, 100 mM NaCl and 1% glycerol). Clarified lysates were incubated with Ni–NTA resin (1 h, 4 °C), washed with 20 mM imidazole and eluted with 300 mM imidazole. Proteins were concentrated and purified by size-exclusion chromatography (HiLoad 16/600 Superdex 200) in HTRA2 storage buffer (50 mM HEPES–KOH pH 8.0, 300 mM NaCl, 10 mM MgCl2, 20% glycerol and 1 mM DTT) or NDUFA13 storage buffer (8 M urea, 20 mM sodium phosphate pH 8.0, 100 mM NaCl and 5% glycerol). Peak fractions were pooled, concentrated (10 kDa MWCO), aliquoted and stored at −80 °C. NDUFA13 was maintained in 8 M urea to keep it unfolded for downstream disaggregation assays.
Luciferase disaggregation and reactivation assay
Aggregates of firefly luciferase were prepared using the protocol described earlier33. Firefly luciferase aggregates were prepared by incubating luciferase (50 µM; Sigma, L9420) in luciferase reactivation buffer (LRB: 25 mM HEPES–KOH pH 8.0, 150 mM potassium acetate, 10 mM magnesium acetate and 10 mM DTT) with 8 M urea (Fisher, BP169-10) at 30 °C for 30 min, followed by 100-fold dilution into LRB, snap-freezing and storage at −80 °C. For disaggregation assays, CLPB (1 µM) or HTRA2 (1 µM) was incubated with 50 nM aggregated luciferase in LRB supplemented with an ATP regeneration system (5 mM ATP (Sigma, A2383), 1 mM creatine phosphate (Roche, 10621714001) and 0.25 µM creatine kinase (Roche, 10127566001) at 37 °C for 60 min. Luciferase activity was measured in 96-well optical plates on a Tecan Spark reader, and the remaining reactions were analysed by SDS–PAGE and western blotting for HTRA2-mediated degradation.
NDUFA13 aggregate cleavage assay
NDUFA13 aggregates were prepared by rapid 100-fold dilution of concentrated, unfolded protein into buffer (25 mM HEPES–KOH pH 8.0, 150 mM potassium acetate, 10 mM magnesium acetate and 10 mM DTT), as previously described33. Aggregate formation was confirmed by centrifugation (21,130g, 20 min, 4 °C), with 93.3% ± 3.3% of NDUFA13 recovered in the pellet by western blot.
For cleavage assays, CLPB (1 µM), HTRA2 (1 µM) or both were incubated with aggregated NDUFA13 in reaction buffer with an ATP regeneration system (5 mM ATP, 1 mM creatine phosphate and 0.25 µM creatine kinase) at 37 °C for 60 min. Reactions were quenched with 1× Laemmli buffer (95 °C, 5 min) and analysed by SDS–PAGE and western blotting.
Western blotting and detection
Protein samples were resolved by SDS–PAGE (Bio-Rad Criterion gels) until molecular weight standards (50–75 kDa range) were clearly separated. Proteins were transferred to PVDF membranes using 1× transfer buffer containing 20% methanol at 100 V for 1 h at 4 °C. Membranes were blocked in 5% (w/v) skimmed milk in 1× TBS for 1 h at room temperature, followed by incubation with primary antibodies overnight at 4 °C. Primary antibodies included anti-luciferase (1:1,000, Santa Cruz, sc-74548, Lot# K1922) and anti-NDUFA13 (1:1,000, Proteintech, 10986-1-AP, Lot# 17984). Membranes were washed three times with TBST (1× TBS, 0.2% Tween-20) and incubated with a secondary antibody (1:10,000; LI-COR, 926-68071, 926-68070) for 1 h at room temperature. After additional washes, blots were visualized using a LI-COR Odyssey Fc imaging system.
Cryo-electron microscopy/electron tomography of isolated mitochondria
WT (n = 2; P23 female, P25 male) and Htra2 mutant (n = 2; P19, P27 males, near end stage) mice were sacrificed and their brains isolated (excluding olfactory bulb) at 4 °C. Tissue was minced in mitochondrial isolation buffer (50 mM Tris–HCl, 250 mM sucrose, 1 mM EDTA, 1% BSA, pH 7.4), Dounce homogenized (30 strokes) and centrifuged at 600g (10 min). Supernatants were pooled and mitochondria pelleted at 12,000g (15 min), resuspended in buffer with 200 nM MitoTracker Green and kept on ice before vitrification31,57.
Glow-discharged gold 100-mesh grids were loaded with 5 µl sample, sandwiched between hexadecene-coated planchettes and vitrified by high-pressure freezing (CryoCapCell). Lamellae (~100–180 nm) were prepared on a Helios 5 Hydra plasma focused ion beam scanning electron microscope using the Waffle method58. Cryo-electron tomography data were collected on a 300 kV Titan Krios G4 with tilt series from −60° to +60° (3° increments, 64,000×, 1.96 Å per pixel, ~123 e⁻ Å−2). Tilt series were CTF-corrected, aligned and reconstructed in Warp (v2.0.0dev36)/AreTomo (v1.4.0); single images were processed in cryoSPARC (v4.7.0). Mitochondrial dimensions were measured in Fiji (v2.14.0/1.54 f) from 15,000× SearchMaps.
Statistics and reproducibility
Sample sizes were based on related prior datasets2. Sample sizes were greater than three, except for K562 proteomics data collection, where n = 2 for controls, which represents a limitation of our work with respect to in vitro proteomics data. One biological replicate from both the CLPB IP and striatum proteomics datasets was excluded owing to insufficient peptide counts. Statistical tests used to generate P values are indicated in the respective figure legends. Data distribution was assumed to be normal throughout all experiments, although this was not formally tested. All biochemical experiments were performed with at least three replicates, and key experiments were independently repeated by a separate laboratory member. Animals were randomly allocated for all in vivo experiments. Investigators were blinded during immunofluorescence scoring analysis.
Reporting summary
Further information on research design is available in the Nature Portfolio Reporting Summary linked to this article.