
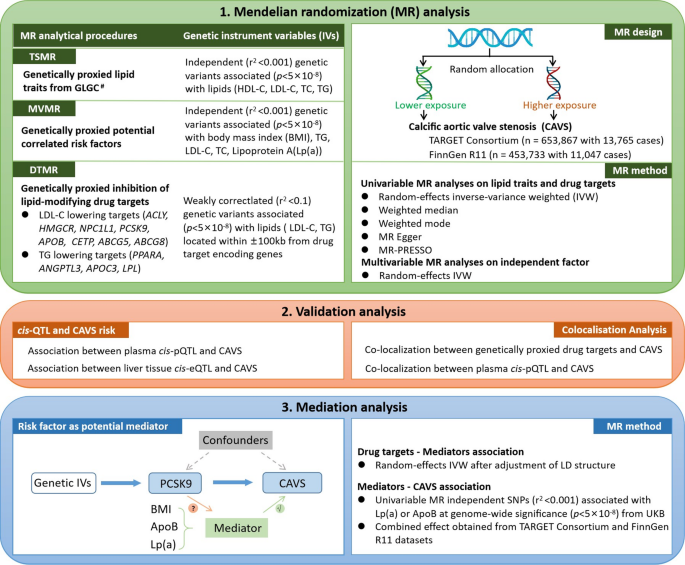
Genetic variant selection
After clumping, we identified 374 SNPs for TC, 415 for HDL-C, 313 for LDL-C and 370 for TG (Supplementary table S4). Genetically proxied levels of lipids were significantly associated with CAD33,34 (Supplementary table S5). In drug-target MR, we evaluate 12 lipid-modifying targets’ effects on CAVS, namely HMGCR, NPC1L1, PCSK9, CETP, APOB, APOC3, ACLY, ANGPTL3, LPL, ABCG5, ABCG8, and PPARA. Genetic instruments for each of lipid-modifying targets are presented in Supplementary table S6. The positive control analyses identified associations in the expected direction between genetically proxied drug targets and CAD, ensuring the validity of the genetic instruments (Supplementary table S7). Characteristics of genetic variants used to instrument the cis-pQTL for plasma levels of PCSK9 protein and liver-derived cis-eQTL for PCSK9 gene are presented in Supplementary table S8. The F-statistics of all selected genetic instruments for lipids levels, and drug targets including the eQTL and pQTLs, ranged from 26.4 to 15850.2, indicating low risk of weak instrument bias.
Genetically causal associations of serum lipids with CAVS
There was limited evidence of an effect of genetically proxied HDL-C on CAVS after multiple testing correction (P = 0.14). We found genetically proxied TG levels were significantly associated with CAVS risk (IVW MR odds ratio (OR) = 1.27; 95% confidence interval (95% CI) = 1.18–1.36, Fig. 2). Significant associations between genetically higher serum TC and LDL-C and increased risk of CAVS were discovered in both TARGET and FinnGen datasets (Supplementary table S9). As estimated by the IVW method, the pooled odds of CAVS was 1.65 (95% CI = 1.53–1.77) for 1-SD increase in TC, and 1.53 (95% CI = 1.42–1.65) for 1-SD increase in LDL-C (Fig. 2). Given the collinearity between lipids traits, there is overlap between instruments for the four lipids traits (12%). We therefore repeated the analyses only using unique instrumental variables (241 SNPs for TC, 191 SNPs for LDL-C, 333 SNPs for TG and 376 for HDL-C) associated with no other lipid traits and all association remained (Supplementary table S10).
Fig. 2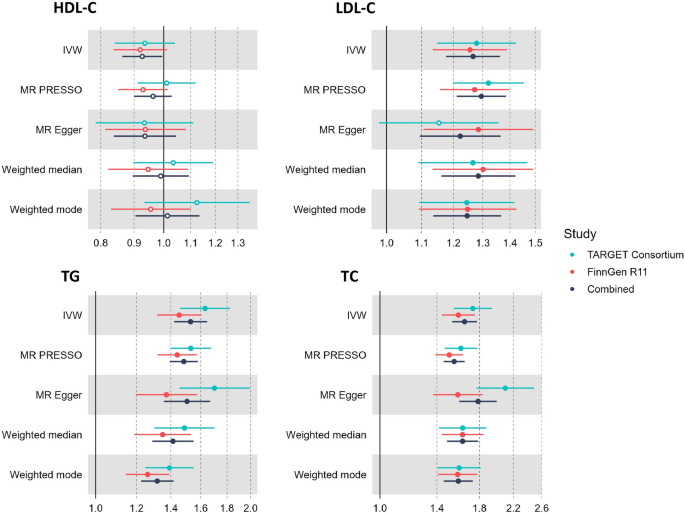
Causal effects of genetically proxied lipids on calcific aortic valve stenosis.
Moreover, results from multivariable MR analysis suggested that LDL-C (OR = 1.41, 95% CI = 1.31 to 1.51) were independent risk factors of CAVS after adjusting for known risk factors, including LP(a) and BMI (Fig. 3); whereas the association with triglycerides was attenuated (OR = 1.09, 95% CI = 1.02 to 1.21).
Fig. 3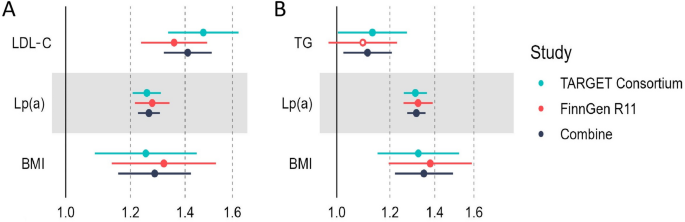
Results of multivariable Mendelian randomisation analysis of serum lipids and calcific aortic valve stenosis. (A) CAVS–LDL-C + Lp(a) + BMI. (B) CAVS–TG + Lp(a) + BMI.
Mendelian randomisation analysis of lipid-modifying targets and CAVS
For lipids traits associated with CAVS after multiple testing correction in univariable MR, we applied drug-target MR to investigate the association of genetically proxied lipid-modifying drug targets with CAVS risk from two independent datasets (Supplementary table S11). For drug targets that reached significance after multiple testing correction in both datasets, we then performed colocalization analyses to test the exclusion restriction assumption. Genetic mimicry of LPL and APOC3 enhancement equivalent to a 1-SD reduction in TG was significantly associated with lower CAVS risk. As shown in Supplementary table S12, the second hypothesis was the most likely (87%) in colocalisation analysis of ABCG5, suggesting that colocalisation finding may be underpowered. Besides, lowering of LDL-C caused by targeting ABCG5 should reduce the risk of CAVS (Table 1). However, there was weak evidence from colocalization analyses to support these associations (Supplementary table S12).
Table 1 Association between genetically proxied lipid-modifying targets and risk of calcific aortic valve stenosis. Estimates are effects equivalent to 1 standard deviation decrement in plasma lipids.
Genetically proxied inhibition of PCSK9 was strongly associated with lower risk of CAVS in both TARGET and FinnGen datasets with pooled OR of 0.63 (95% CI = 0.56–0.70, P = 1.13 × 10⁻¹⁶, per SD reduction in LDL-C). Colocalisation analyses suggested that the PCSK9 region was shared by LDL-C and CAVS (PP.H4 = 99.3%) (Table 1), strengthening the observed causal effects of targeting PCSK9 on CAVS (Fig. 4). Additional analysis for the LD threshold with more stringent thresholds (r2 < 0.01 and r2 < 0.001) provided consistent evidence of an association between genetically proxied PCSK9 inhibition and decreased CAVS risk (Supplementary table S13). A total of 16 independent SNPs were used as instrumental variables for genetic predicted CAVS (Supplementary table S14), reverse MR shown that neither plasma LDL-C nor the PCSK9 proteins appeared to be causally influenced by genetically predicted CAVS (Supplementary table S15).
Fig. 4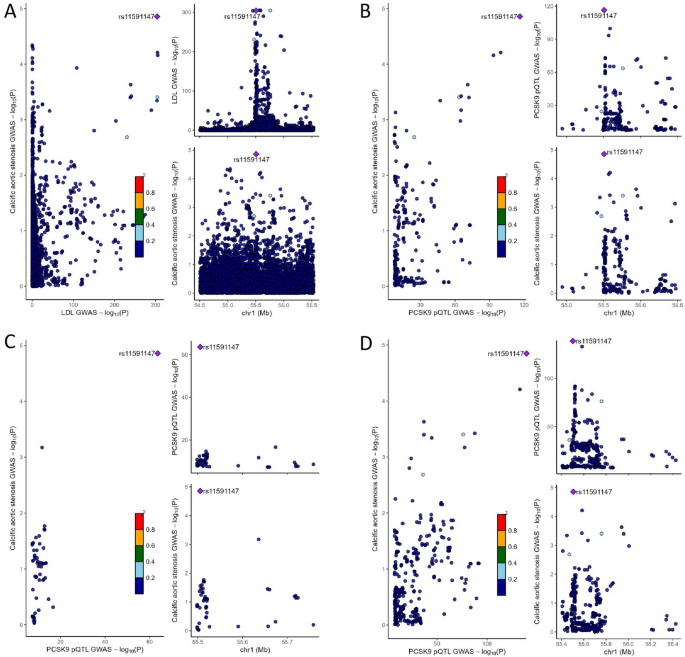
Genetic colocalization between PCSK9 and calcific aortic valve stenosis risk. (A) Colocalisation between LDL-C and calcific aortic valve stenosis in the PCSK9 region. (B) Colocalization analyses of cis-pQTL from deCODE for PCSK9. (C) Colocalization analyses of cis-pQTL from Fenland for PCSK9. (D) Colocalization analyses of cis-pQTL from UKB-PPP for PCSK9.
We found limited evidence of an genetic mimicries of other drug targets (HMGCR, ANGPTL3, NPC1L1, CETP, APOB, APOC3, ACLY, LPL, PPARA, ABCG5, and ABCG8) on CAVS (Supplementary table S11).
Triangulation of evidence using pQTL and eQTL data
Leveraging proteomic GWAS summary data from the deCODE, the Fenland cohorts and the UKB-PPP study, we performed two-sample MR analyses using cis-acting pQTLs to instrument inhibition of circulating PCSK9 protein levels to further examine the association between PCSK9 and CAVS. These cis-pQTLs are strongly associated with LDL-C levels (Supplementary table S16). MR results provided consistent evidence of an protective effect of lower levels of circulating PCSK9 protein on CAVS with a pooled OR of 0.86 (95% CI = 0.83–0.88, P = 3.38 × 10⁻²¹, Fig. 5), which in line with findings from our initial analyses. The results of the alternative MR methods were generally consistent (Supplementary table S17, Supplementary figure S1). Neither heterogeneity nor horizontal pleiotropy was detected (Supplementary table S18). Besides, results from leave-one-out analyses suggested that the overall estimate was not driven by a single influential variant, supporting the robustness of our findings (Supplementary figure S2). The funnel plot showed symmetric variation in effect size around the point estimate (Supplementary figure S3). Repeating the MR analysis using cis-pQTLs with more stringent thresholds (r2 < 0.01 and r2 < 0.001) on CAVS risk provided a very similar magnitude of effect (Supplementary table S13). We then assess genetic colocalization of PCSK9 protein with CAVS. PCSK9 protein showed strong evidence of colocalization in deCODE (PP.H4 = 99.4%), Fenland (PP.H4 = 99.4%) and UKB-PPP (PP.H4 = 99.4%) with the same causal variant (rs11591147) (Fig. 4, Supplementary table S12).
Fig. 5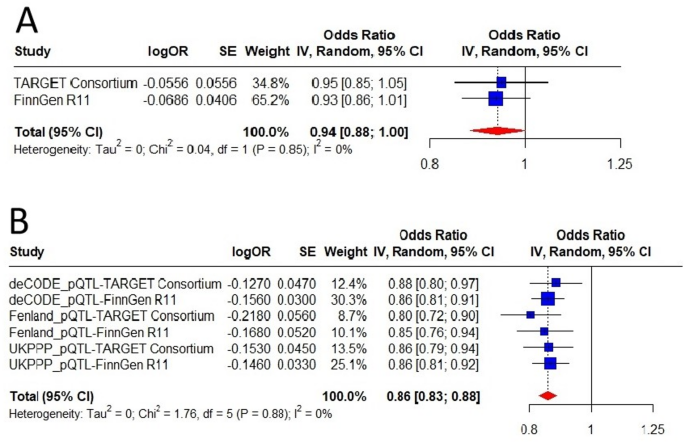
External validation of the causal relationship between PCSK9 and calcific aortic valve stenosis using data from (A) cis-eQTL and (B) cis-pQTLs.
Because PCSK9 is strongly expressed in the liver, which is the organ where LDL-C removal occurs, we further examine genetically proxied PCSK9 expression (instrumented using cis-eQTL) and CAVS. As none cis-eQTL in liver tissue reached genome wide significance based on the Genotype-Tissue Expression (GTEx), only one independent (r2 < 0.1) SNP in the PCSK9 gene with sub-genome-wide significance (P = 6.02 × 10⁻⁷) was available as an instrumental variable (rs553741), which is in strong LD with one of the SNPs used as cis-pQTLs of PCSK9 protein (rs472495, r2 = 0.86, Supplementary table S19). MR analyses using the cis-eQTL estimated an consistent association between lower level of liver PCSK9 expression and lower risk of CAVS with a pooled OR of 0.94 (95% CI = 0.88–1.00, P = 0.05, Fig. 5).
Mediation analysis
We hypothesised that the association between genetically proxied PCSK9 inhibition and CAVS may be mediated through established risk factors for CAVS, such as BMI, Lp(a), and ApoB. Therefore, we performed two-step MR analysis to investigate the mediating pathway from PCSK9 inhibition to CAVS.
MR analyses provided little evidence for genetically proxied inhibition of PCSK9 and BMI (Beta = −0.02, 95% CI = −0.042 to 0.002, P = 0.07, SD change in BMI per SD reduction in LDL-C, Supplementary table S20). However, genetically proxied inhibition of PCSK9 contributed significant alterations in Lp(a) (Beta = −0.08, 95% CI = −0.11 to −0.05, P = 2.97 × 10⁻⁷, SD change in Lp(a) per SD reduction in LDL-C) and a much greater extent in ApoB (Beta = −0.73, 95% CI = −0.78 to −0.67, P = 2.60 × 10−138, SD change in ApoB per SD reduction in LDL-C). Replication using PCSK9 pQTLs as genetic instruments on Lp(a) and ApoB provided similar estimates (Supplementary table S21-S22).
In addition, we examined the association between genetically proxied Lp(a) and ApoB levels on CAVS risk using independent genetic instruments across the genome (r2 < 0.001, P < 5 × 10⁻⁸). Following IVW MR results, there was a strong effect of genetically proxied Lp(a) (Beta = 0.26, 95% CI = 0.22–0.30, Supplementary table S23) and ApoB levels (Beta = 0.36, 95% CI = 0.24–0.48) on CAVS risk (Supplementary table S24).
We found that plasma Lp(a) levels partially mediated the total effect of genetically proxied inhibition of PCSK9 on CAVS (proportion mediated = 4.5%, P = 1.77 × 10⁻⁶), while lowering ApoB levels mainly mediated the association (mediation proportion: 55.9%, P = 9.56 × 10⁻⁹, Fig. 6).
Fig. 6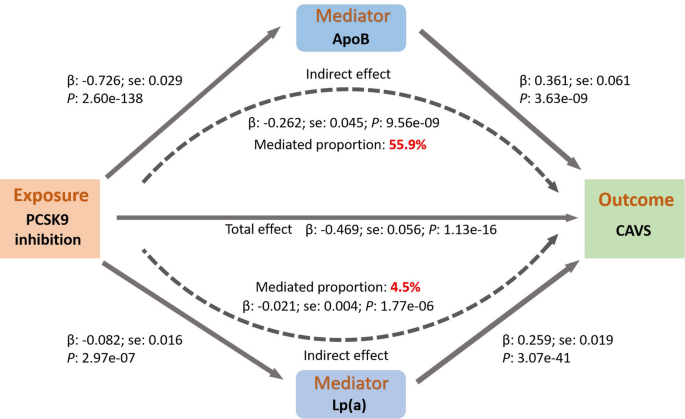
Mediation analysis of the effect of genetically proxied PCSK9 inhibition on calcific aortic valve stenosis via potential mediators.
In replication analyses using PCSK9 cis-pQTLs as the genetic instruments, we evaluated whether Lp(a) or ApoB mediates the total effect of plasma level of PCSK9 protein on CAVS (Supplementary figure S4). We also found consistent results for plasma PCSK9 level and ApoB mainly mediated the total effect of PCSK9 levels on CAVS (proportion mediated = 69.1%, P = 1.86 × 10⁻⁷).