
Ethics statement and clinical samples
This study involves clinical samples sourced from several organizations and the study protocols were approved by the Institutional Review Boards of Jiangxi Cancer Hospital, Nanchang, Jiangxi Province, China (Approval No. 2023ky119), The First Affiliated Hospital of Zhejiang University, Hangzhou, Zhejiang Province, China (Approval No. IIT20220027C-R2), The Second Affiliated Hospital of Zhejiang University, Hangzhou, Zhejiang Province, China (Approval No. 2021–0497) and Zhujiang Hospital of Southern Medical University, Guangzhou, Guangdong Province, China (Approval No. 2017-GDEK-004 and 2022-KY-003–01). Clinical samples that included tumor specimens, blood and umbilical cords (Supplementary Table 6) were collected with patients’ informed consent from the First Affiliated Hospital and the Second Affiliated Hospital of Zhejiang University and Zhujiang Hospital of Southern Medical University. STRaM experiments were carried out at Zhejiang University-University of Edinburgh Institute, Haining, Zhejiang Province, China, and Jiangxi University of Chinese Medicine, Nanchang, Jiangxi Province, China in accordance with the Belmont Report.
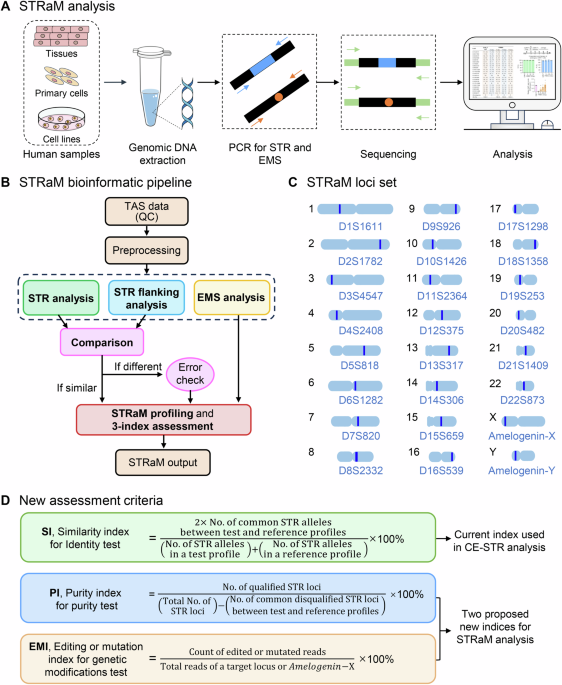
STRaM framework
The STRaM framework encompasses a new set of STR, more inclusive rules for STR structures, an error-sensing bioinformatic pipeline established on the Galaxy server (https://usegalaxy.org/)56 and 3 assessment indices for reporting identity, purity and editing/mutation information. The bioinformatic pipeline contains 3 analytic modules: STR analysis, STR flanking analysis and EMS (gene mutations, transgenes) analysis.
STRaM bioinformatic pipeline for TAS data
The bioinformatic pipeline contains data preprocessing, 3 modular analyses (STR analysis, STR flanking analysis and EMS analysis) and a comparison of analytic outputs for the detection of STR errors, which are assembled in Galaxy servers56. The validated outputs of the STRaM pipeline are then translated into 3 indices for the testing of cell identity, cross-contamination and status of genetic modifications. The pipeline can handle both single-end reads and paired-end reads, although the latter is preferred.
The true repetitive structures of STR are programmed in STRaM and the resulting STRaM rules are different from traditional CE rules for STR identification, which adhere to the ASN-0002 human cell authentication standard9.
A STRaM set of STR loci
A new set of 22 STR loci (Supplementary Table 1) in human autosomes was selected from the database STRBase57 (https://strbase-archive.nist.gov), the Marshfield comprehensive human genetic maps58 (https://www.biostat.wisc.edu/~kbroman/publications/mfdmaps) and experimentally validated.
Data preprocessing
Generated by TAS for STR and edited/mutated sequences, the paired-end reads were preprocessed for high quality sequences and then, merged for bioinformatic analysis via the STRaM pipeline. Read quality was first evaluated with the program fastQC59. The 5′ and/or 3′ sequences of poor quality in the reads were trimmed with the program fastp60. Reads with poor quality (Phred quality score Q < 25) or shorter than 50 bases in length were discarded via fastp. Those processed and selected paired-end reads were then merged for better coverage of long STR (up to 200 bp) via the program FLASH61. The merging step was not needed for single-end reads.
STR analysis
The analysis module was designed to perform genomic mapping and de novo identification of STR in sequencing reads. Merged reads (or single-end reads) were first mapped via the genome mapper BWA-MEM62 on the human reference genome GRCh38 (i.e., GCA_000001405.15 _GRCh38_no_alt_analysis _set)63, which was obtained from the genome center of the National Center for Biotechnology Information (NCBI), USA (https://ftp.ncbi.nlm.nih.gov/). The STR sequences in individual mapped reads were recognized by the STR detection program of the STR-FM package19, which outputs STR information, including their read ID, STR lengths, repetitive motifs, hamming distances (the maximal number of substitutions in a repeat unit)64, mapped genomic coordinates (the chromosome names and the start positions of the repeat sequence) and raw sequences. The identities of STR loci in individual mapped reads were further determined according to their genomic coordinates. Since the repetitive motifs of STRs are prone to mutation, the misidentification of STR structures by STR analysis cannot be avoided.
STR flanking analysis
The analytic module was designed to identify an STR in accordance with flanking sequences on both sides of the STR. Since the flanking sequences of the STR are much more stable and specific, the module generates fewer analytic errors. It utilizes the distinct alignment program Nucmer in the MUMmer package24, which performs all-vs-all comparisons of sequences with genomic alterations. For the Nucmer alignment, the two reference library files in the FASTA format (Supplementary Table 7) included reference sequences of 30 bp (and their reverse complement sequences) at the 5′ and 3′ flanking regions of the STR in the STRaM set. The merged reads (or single-end reads) were aligned via Nucmer to reference sequences at the 5′ and 3′ flanking regions of STR in the STRaM set. Note that individual reads aligned to the flanking regions of different STR were discarded, but those reads aligned to both flanking ends of the same STR were chosen and equipped with the STR genomic coordinates (based on GCA_000001405.15_GRCh38_no_alt_analysis_set, Supplementary Table 8) and lengths calculated via the equation below (Eq. (1)):
$${{\rm{STR\; length}}}={{{\rm{P}}}}_{3{{\rm{s}}}}-{{{\rm{P}}}}_{5{{\rm{e}}}}-1$$
(1)
where the end positions of the 5′ flanking sequences (P5e) and the start positions of the 3′ flanking sequences (P3s) were extracted from Nucmer outputs.
Error-sensing comparison of STR analysis and STR flanking analysis
Variants or alterations in STR or their flanking regions are common. Furthermore, PCR amplification and/or sequencing cause technical errors (or mutations) in the STR sequences. Despite their low occurrence, these genomic variants or technical errors likely generate misidentification of STR or miscalculation of their lengths when sequence-based bioinformatic tools are used. To minimize analytic errors, we formulated an error-sensing comparison of independent outputs from the STR analysis and the STR flanking analysis. This comparison involves 3 STR parameters: genomic coordinates, STR lengths, and read counts.
Since some STRs share repetitive motifs, it is possible that some STR-carrying reads were mapped to incorrect genomic locations. Therefore, a comparison of the genomic coordinates of the STR provided by the STR analysis and the STR flanking analysis was performed to ensure correct genomic mapping of the STR-carrying reads. The difference in the STR start positions (DSPs) was calculated as follows (Eq. (2)):
$${{\rm{DSP}}}=\frac{{{\rm{STR}}}\; {{\rm{start}}}\; {{\rm{position}}}\;({{\rm{STR}}}\; {{\rm{analysis}}}-{{\rm{STR}}}\; {{\rm{flanking}}}\; {{\rm{analysis}}})}{{{\rm{The}}}\; {{\rm{length}}}\; {{\rm{of}}}\; {{\rm{merged}}}\; {{\rm{or}}}\; {{\rm{single}}}\; {{\rm{end}}}\; {{\rm{reads}}}}$$
(2)
where the length of merged reads was 300 bases and that of single-end reads was 150 bases in this study. If both the STR analysis and the STR flanking analysis detected the same STR in individual reads, the value of DSP should be very close to 0. In other words, if the comparison of genomic coordinates revealed the same chromosome names and a DSP value between -0.5 and 0.5, the STR analysis and the STR flanking analysis were consistent. If the comparison did not demonstrate the same chromosome names or a CSP between -0.5 and 0.5, the STR analysis and STR flanking analysis generated errors. These misreads are filtered out by comparing gene coordinates, i.e., by calculating the DSP. Reads with a DSP > 0.5 or < -0.5 are excluded.
Since mutations or variants in an STR or its flanking sequences often result in analytic errors, a comparison of the STR length (CSL) between the STR analysis and the STR flanking analysis was also designed in the pipeline to determine whether bioinformatic identification of STR in reads was correct. The same STR lengths from the 2 independent analyses demonstrated correct identification of STR. In addition, misidentification of STR was likely detected, which required further inspection of the 2 analytic modules. The CSL between the STR and STR flanking analyses is used to determine the consistency of STR sequences identified by both methods. If the result is “True”, it indicates that both modes have produced the same recognition result without the need for error correction. If “False” is displayed, it suggests that the recognition results differ, necessitating error correction. CSL discrepancies (“False” results) are often due to sequence mutations, particularly at the junctions between STRs and flanking sequences.
The STR identification was further validated by a comparison of the read counts provided by either the STR analysis or the STR flanking analysis. The comparison was illustrated by a function of the read count (FRC) at a particular STR locus (Eq. (3)):
$${{\rm{FRC}}}=\frac{{{\rm{Read}}}\; {{\rm{count}}}\,({{\rm{STR}}}\; {{\rm{analysis}}}-{{\rm{STR}}}\; {{\rm{flanking}}}\; {{\rm{analysis}}})}{{{\rm{Read}}}\; {{\rm{count}}}\,({{\rm{STR}}}\; {{\rm{analysis}}}+{{\rm{STR}}}\; {{\rm{flanking}}}\; {{\rm{analysis}}})}$$
(3)
The value change of the read count from the two analyses should be > 90%, i.e., the FRC value should fall within the range of [-0.05, 0.05]. However, FRC values between [-1, -0.05) and (0.05, 1] need to be checked for analysis exceptions.
Errors in a comparison of 3 parameters indicate abnormal operations in either the STR analysis or the STR flanking analysis, which often resulted from mutations (or alterations) in STR or in their flanking sequences. The errors of the 2 analyses were either corrected manually, or the reads with errors were discarded. A comparison of DSP effectively identifies and locates STR loci, while the CSL serves to resolve STR sequences between the two analysis modes. The function of the FRC is to verify the correct operation of the two analysis modes (a representative STRaM analysis of HEK293FT cells is shown in Supplementary Table 9).
Amelogenin and EMS analysis
The EMS analysis module in the pipeline employed the aligner Nucmer to determine reads that contained either the amelogenin locus or the edited (mutated) sequences. For the Nucmer alignment of paired-end sequencing reads, the 2 reference sequence library files were customized with specific target sequences plus amelogenin sequences (Supplementary Table 10). The amelogenin locus was used to distinguish sex chromosomes, as the sequences in chromosomes X and Y are different with 12 point mutations and a 6 bp deletion65.
Identification and characterization of alleles and stutters
The amplification of STR alleles is often accompanied by stutter products, which contain the deletion or insertion of one or more repeat units in the newly synthesized sequences compared with the parental STR templates51,52. To establish de novo STRaM profiling, we need to distinguish true STR alleles from their stutters, which is based on the prominence-cutoff model. In the model, the repetitive sequence with the highest read counts at an STR locus was defined as an allele. From our data of 16 human cell lines, the prominence-cutoff model defines a prominent ratio (Pr) of read counts of different repetitive sequences to the highest read counts (Eq. (4)).
$${P}_{r}=\frac{{{\rm{Read}}}\; {{\rm{counts}}}\; {{\rm{of}}}\; {{\rm{the}}}\; {{\rm{repetitive}}}\; {{\rm{sequences}}}}{{{\rm{The}}}\; {{\rm{highest}}}\; {{\rm{read}}}\; {{\rm{counts}}}}$$
(4)
There are three types of stutters: backward stutter, forward stutter and combined stutter. The backward stutter of an STR allele contains deletion of one or more repeat units (i.e., n-1, n-2, etc.), whereas, the forward stutter contains insertion of one or more repeat units (i.e., n + 1, n + 2, etc.). When there are two distinct alleles at a STR locus, for example, the combined stutter is a mixture of the na + 1 stutter of one STR allele and the nb-1 stutter of another. The stutter behavior is characterized by a stutter ratio, Sr (Eq. (5)).
$${S}_{r}=\frac{{{\rm{Stutter}}} \, \left({{\rm{read}}}\; {{\rm{count}}}\right)}{{{\rm{Adjacent}}}\; {{\rm{allele}}} \, \left({{\rm{read}}}\; {{\rm{count}}}\right)}$$
(5)
Three indices for similarity, purity, and gene modification assessments
To facilitate the interpretation and understanding of STRaM results, we developed 3 indices: SI, PI, and EMI, to assess the identity, purity, and gene modification of cell products, respectively.
The SI is formulated via published Tanabe algorithms66 with the Sørensen-Dice coefficient (Eq. (6), Fig. 1D).
$${{\rm{SI}}}=\frac{\begin{array}{c}2{{\times }}{{\rm{No}}}.{{\rm{of}}}\; {{\rm{common}}}\; {{\rm{STR}}}\; {{\rm{alleles}}} \\ {{\rm{between}}}\; {{\rm{test}}}\; {{\rm{and}}}\; {{\rm{reference}}}\; {{\rm{profiles}}}\end{array}}{\left(\begin{array}{c}{{\rm{No}}}.{{\rm{of}}}\; {{\rm{STR}}}\; {{\rm{alleles}}}\\ {{\rm{in}}}\; {{\rm{a}}}\; {{\rm{test}}}\; {{\rm{profile}}}\end{array}\right)+\left(\begin{array}{c}{{\rm{No}}}.{{\rm{of}}}\; {{\rm{STR}}}\; {{\rm{alleles}}} \\ {{\rm{in}}}\; {{\rm{a}}}\; {{\rm{reference}}}\; {{\rm{profile}}}\end{array}\right)}\times 100 \%$$
(6)
It evaluates the similarity between tested cells and parental or reference cells. An SI value of ≥80% indicates that the tested cells are likely to originate from parental cells. SI is also used to detect samples with a high rate of similarity, e.g., 50% similarity (see one case in Supplementary Table 4, SI: 73.2 ± 0.0%, PI: 22.7 ± 0.0%, n = 3).
The PI measures the degree of cross-contamination on the basis of an alteration of Sr by the STR profiles of foreign cells (Eq. (7), Fig. 1D).
$${{\rm{PI}}}=\frac{{{\rm{No}}}.{{\rm{of}}}\; {{\rm{qualified}}}\; {{\rm{STR}}}\; {{\rm{loci}}}}{\left(\begin{array}{c}{{\rm{Total}}}\; {{\rm{No}}}.{{\rm{of}}} \\ {{\rm{STR}}}\; {{\rm{loci}}}\end{array}\right)-\left(\begin{array}{c}{{\rm{No}}}.{{\rm{of}}}\; {{\rm{common}}}\; {{\rm{disqualified}}}\; {{\rm{STR}}}\; {{\rm{loci}}} \\ {{\rm{between}}}\; {{\rm{test}}}\; {{\rm{and}}}\; {{\rm{reference}}}\; {{\rm{profiles}}}\end{array}\right)}\times 100 \, \%$$
(7)
In a cross-contamination situation with more than 1% foreign cells, however, an abnormal increase in Sr at an STR locus resulted from a read contribution of a foreign allele to the corresponding host stutter. An STR locus with Sr below the threshold is qualified, whereas, an STR locus with Sr above the threshold is disqualified (Supplementary Table 4). The PI is then determined by the ratio of the qualified STR in the tested cells to that in the parental cells. The percentage of PI without cross-contamination should be greater than 80%. Note that the combined stutters were precluded from the PI calculation.
The EMI determines the proportion of tested cells with edited or mutant genes in the total number of cells (Eq. (8), Fig. 1D) and is given by:
$${{\rm{EMI}}}=\frac{{{\rm{Count}}}\; {{\rm{of}}}\; {{\rm{edited}}}\; {{\rm{or}}}\; {{\rm{mutated}}}\; {{\rm{reads}}}}{{{\rm{Total}}}\; {{\rm{reads}}}\; {{\rm{of}}}\; {{\rm{a}}}\; {{\rm{target}}}\; {{\rm{locus}}}\; {{\rm{or}}}\;{{\rm{Amelogenin}}}- {{\rm{X}}}\left.\right)} \times 100\, \%$$
(8)
See the edited gene testing and transgene CAR monitoring in Supplementary Table 5.
Cell culture
The A549, HCC827, HEK293T, HS578T, K562, SW480, SW620, and 5637 cell lines were purchased from the National Collection of Authenticated Cell Cultures, Shanghai, China. The SUM159PT and T47D cell lines were purchased from Procell Life Science Technology, Hubei, China. A549 cells were cultured in Ham’s F-12K medium (Gibco, 21127022) supplemented with 10% (v/v) heat-inactivated fetal bovine serum (FBS, ExCell Bio, 12A230); HCC827 cells were cultured in RPMI 1640 medium (Sigma, R5886) supplemented with 10% (v/v) FBS, 1% (v/v) MEM nonessential amino acids (MEM-NEAA, Gibco, 11140050) and 1 mM sodium pyruvate (Gibco, 11360-070); HEK293T, HS578T, K562, SW480 and SW620 cells were cultured in DMEM (Gibco, 12800-017) supplemented with 10% FBS; 5637 cells were cultured in RPMI 1640 medium (11875093, Thermo) supplemented with 10% (v/v) FBS; SUM159PT and T47D cells were cultured in phenol-red-free DMEM/F12 (Sigma, D2906) supplemented with 10% FBS; and 293FT (Invitrogen, R70007) cells were cultured in DMEM supplemented with 10% FBS, 0.1 mM MEM-NEAA and 1 mM sodium pyruvate. All cells were cultured in a 37 °C incubator with 5% carbon dioxide (CO2). The cell line information is listed in Supplementary Table 11.
STRaM profiling
Sixteen human cell lines were subjected to genomic DNA extraction, PCR amplification and TAS. STRaM analysis was performed for STR profiles of both the ASN-0002 panel and the STRaM panel. The final STR profiles of the ASN-002 panel were generated in accordance to CE rules, whereas, those of the STRaM panel were generated in accordance to STRaM rules.
Detection of cross contamination in cell lines
The T47D cells were artificially mixed with the HS578T cells at ratios of 1:1, 50:1 and 100:1. The T47D cells were mixed with the A549 cellsat ratios of 10%, 3% and 1%. The HEK293FT:HCC927, 5637:HS578T mixed cells with at ratios of 1:100 or 100:1. After extraction from the mixed cells, their genomic DNA were subjected to PCR amplification and TAS. The sequenced data were processed via STRaM analysis, followed by a determination of their SI and PI for cellular cross-contamination.
Detection of mutated or edited cells from parental cells
The ability of STRaM to detect mutated or edited genes is superior to that of the gold-standard CE-based STR profiling. To distinguish between the SW480 and SW620 cell lines derived from the same patient29, the gene mutations BRMS173686-73687del, PTPN9C.757C>T, KMT2BC.817G>A, and KMT2BC.875G>T were selected for STRaM as they appear only in the SW620 cell line (CCLE67, https://sites.broadinstitute.org/ccle/) and COSMIC68, https://cancer.sanger.ac.uk/cosmicdatabases). The primers used were designed to amplify the mutation regions of 3 genes (Supplementary Table 12). The PCR products of the 3 mutated genes and the STRaM set were combined for TAS and STRaM analysis. The EMI was calculated to assess the genetic difference between the 2 cell lines of the same origin.
To detect HEK293 cells with CRISPR/Cas9-mediated mutations in the PTEN gene, the mutation-carrying exon 5 of PTEN was amplified with primers (Supplementary Table 12). The PCR products of the PTEN exon 5 and the STRaM set were combined for subsequent TAS and STRaM analysis. The EMI was evaluated to reveal the genetic difference between the 3 edited HEK293 cells and parental cells. Clone 37 was generated from parental HEK293FT cells, whereas clones 3-19 and 3-68 were generated from parental HEK293T cells.
Umbilical cord (UC)-derived mesenchymal stem cells (MSCs)
Human UC-derived MSCs were isolated and cultured in accordance with a previous study69. Briefly, the UC tissues of 3 volunteers were digested with MSCs, which were further cultured in human MSC medium (Tbdscience, SC2013-G-kit) in a 37 °C incubator with 5% CO2. Genomic DNA was extracted from both 2-3×10⁵ MSC passage 4 and parental UC tissues for downstream PCR amplification with TAS and STRaM analysis.
Patient-derived organoids (PDOs)
Hepatocellular carcinoma cells were collected in cold high-glucose DMEM (Gibco, 11965092) supplemented with 100 U/mL penicillin and streptomycin. After removing the nonepithelial components, the tumor samples were cut into small pieces (approximately 1-3mm3) and digested with 1:5 (v/v) collagenase IV (Gibco, 2383671) at 37 °C. The digests were diluted with phosphate-buffered saline (PBS, Tbdscience, PB2004Y), filtered through a 100μm cell strainer (BIOFIL, CSS013100) and centrifuged (250 g, 3 min, 4 °C) for hepatocellular carcinoma cells. Approximately 2 × 10⁵ cells were mixed in Matrigel (Corning, 354234) as soon as possible and transferred onto culture plates (50 μL mixture per plate). After solidification in a 37 °C humidified incubator with 5% CO2 for 30 min, the cell-Matrigel mixtures were cultured with hepatocellular carcinoma organoid medium (BioGenous, K2105-HCC) in a 37 °C incubator with 5% CO2, which was changed every 3-4 days. The hepatocellular carcinoma organoids were fixed, permeabilized, and labeled with a rabbit monoclonal anti-AFP antibody (Abcam, ab133617, clone: EPAFP61), a mouse monoclonal anti-CK18 antibody (Cell Signaling Technology, 4548, clone: DC10) and DAPI. Genomic DNA was extracted from both organoid cells and parental hepatocellular carcinoma cells for subsequent STRaM analysis.
Patient-derived xenografts (PDXs)
The leukemia PDX model was approved by the Ethics Review Committee of Zhejiang University-University of Edinburgh (ZJE) Institute, Haining, Zhejiang Province, China (Approval No. ZJU20230534). To develop leukemia PDX mice, the NOD-Prkdcem26Cd52Il2rgem26Cd22/NjuCrl (NCG) mice of 4-6 weeks were purchased from the GemPharmatech Co., Jiangsu, China, and maintained in a specific-pathogen-free (SPF) animal facility. One million human acute myeloid leukemia cells resuspended in HBSS buffer (8 g/L NaCl, 0.4 g/L KCl, 1 g/L D-glucose, 60 mg/L KH2PO4, 126 mg/L Na2HPO4 ·12H2O, 0.35 g/L NaHCO3, pH: 6.72-6.73) were injected into the caudal vein of NCG mice preconditioned with busulfan70 (Sigma, B2635). Twelve weeks after transplantation, hematopoietic cells harvested from the bone marrow and spleen of the engrafted NCG mice were stained with fluorescence-conjugated monoclonal antibodies including PerCP-conjugated anti-mouse TER-119 (Biolegend, 116244, clone: TER-119, RRID: AB_2565872), eFluor506-conjugated anti-mouse CD45 (mCD45, eBioscience, 69-0451-82, clone: 30-F11, RRID: AB_2637147) and Pacific blue-conjugated anti-human CD45 (hCD45, Biolegend, 304022, clone: HI30, RRID: AB_493655) antibodies, along with 7-aminoactinomycin D (7-AAD, Sangon Biotech, A606804, CAS: 7240-37-1). The stained cells were then sorted via a BD Influx sorter (BD Biosciences) for subsequent STRaM analysis.
CAR-T cell therapy
The preparation and treatment of CAR-T cells were reported in two clinical studies37,71, and were approved by the Ethics and Review Committee of the First Affiliated Hospital, College of Medicine, Zhejiang University. CAR-T cells were produced in the Department of Hematology, the Second Affiliated Hospital, College of Medicine, Zhejiang University. Briefly, activated T-cells were cultured in complete fresh AIM V medium (Gibco, 12055091) supplemented with 10% human AB serum (Sigma, H4522), 300IU/mL interleukin (IL)-2, 5 ng/mL IL-7 and IL-15 (PrimeGene, GMP-101), and infected with the CAR lentivirus in a 37°C incubator with 5% CO2. The infected CAR-T cells were assessed according to clinical standards and used to treat leukemia patients. Since the number of CAR-T cells in the peripheral blood of patients increases to the highest level approximately 14days after transplantation37, PBMCs were collected at days 5, 10, and 15 post-transplantation. Genomic DNA was extracted from CAR-T cells and PBMCs for subsequent STRaM analysis including detection of the transgene CAR. Two pairs of primers were designed for amplification of the CAR (Supplementary Table 12).
Genomic DNA Extraction
The 3-5×10⁵ cells, or 10-20 mg clinical samples chopped into small pieces, were digested in 1 mL lysis buffer (100 mM Tris, 5 mM EDTA, 0.2% SDS, 200 mM NaCl, pH8.0, 0.1-0.2 mg/mL proteinase K) overnight at 56°C. The lysate was slowly mixed with an equal volume of isopropyl alcohol until the genomic DNA precipitates appeared. The DNA precipitates were isolated and dissolved in TE buffer (10 mM Tris, 2.5 mM EDTA, pH8.0) preheated at 56°C. Alternatively, genomic DNA was extracted from 200 µL of frozen or fresh anticoagulant whole blood via the FastPure® Blood DNA Separation Mini Kit (Vazyme, DC111-01) in accordance with the manufacturer’s instructions. The extracted genomic DNA measured via a Nanodrop (Thermo, A30221) was used immediately for PCR or stored at -80°C.
Polymerase chain reaction (PCR)
PCR primers were designed via Primer3 (https://bioinfo.ut.ee/primer3-0.4.0/) for 120-240 bp products and synthesized by Tsingke Biotechnology, Beijing, China. All primer sequences are listed in Supplementary Table 12. The DNA fragments were amplified from 50-150 ng of human genomic DNA by PCR via Platinum™ SuperFi II DNA polymerase (Thermo, 12361010) according to the manufacturer’s instructions. The 120-250 bp PCR products were resolved on a 2% agarose gel and purified via DNA purification columns (Transgen, EG101) for TAS. The DNA size marker (bands: 4360 bp, 1750 bp, 1060 bp, 690 bp, 380 bp, 240 bp and 120 bp) was used for gel electrophoresis.
Target amplicon sequencing (TAS)
The purified PCR products were combined for TAS by Genewiz Biotechnology, Suzhou, Jiangsu Province, China. Briefly, the PCR products were assessed via a Qubit dsDNA HS Assay Kit (Thermo, Q32851) according to the manufacturer’s instructions. The >50 ng purified PCR products per sample were then used for indexed library preparation with the VAHTS Universal Pro DNA Library Prep Kit for Illumina (Vazyme, ND608) in accordance with the manufacturer’s instructions. The libraries were purified via magnetic beads and assessed for pair-end sequencing on NovaSeq 6000 Sequencing System (Illumina). The sequencing data were generated through image recognition and base calling via Illumina real-time analysis software, followed by base call conversion and demultiplexing with Illumina bcl2fastq software. The final sequencing data in FASTQ format were assessed and used for STRaM analysis.
Whole-genome sequencing (WGS) analysis
Thirty-five WGS datasets for human individuals were obtained from the International Genome Sample Resource (IGSR, https://www.internationalgenome.org/data-portal/sample), and are listed in Supplementary Table 13. These datasets were mapped via BWA-MEM on Galaxy servers and displayed using Integrative Genomics Viewer software (IGV, https://www.igv.org/). The STR profiles for the STRaM set were extracted to calculate the observed heterozygosity72 of STR loci in 35 individuals (Hobs).
The WGS datasets for 5 cell lines including 5637 (SRR8639140), A549 (SRR8639173), HCC827 (SRR8639147), SW480 (SRR8670707) and T47D (SRR8670674) were obtained from NCBI SRA67 (https://www.ncbi.nlm.nih.gov/sra, Supplementary Table 14). These SRA data were visualized and analyzed via NCBI Sequence Viewer (or IGV software). STR profiles of the STRaM set were extracted from SRA data and compared with STR profiles from TAS.
We cited WGS data of 8 human cells sourced from NCBI SRA (Supplementary Table 14). WGS data were generated using different library preparation methods with three selected kits32: QIAGEN QIAseq Methyl Library kit (QIAseq, SRR9888302, SRR9888307 and SRR9888314), Illumina TruSeq DNA Methylation kit (TruSeq, SRR9888304, SRR9888310 and SRR9888341) and Swift Biosciences Accel-NGS Methyl-Seq DNA Library kit (Swift, SRR9888338 and SRR9888340). These datasets were mapped via BWA-MEM onto Galaxy servers and visualized using IGV software.
CE-based STR profiling
Eight human STR loci including CSF1PO, D5S818, D7S820, D13S317, D16S539, THO1, TPOX, and VWA plus the amelogenin locus were selected from the 13-STR panel recommended by the ASN-0002 human cell authentication standard9 for CE-based profiling in the study (named the ASN-0002 STR panel). The STR profiles of the human cell lines A549, HE293FT, HS578T and SW480 were detected through CE-based analysis by Genewiz Biotechnology, Suzhou, Jiangsu Province, China. Briefly, the STR panel was amplified from the genomic DNA of cells via the GenePrint 10 System with primers labeled with multiple fluorescent dyes (Promega). The fluorescent PCR products were resolved by CE using a 3730xl Genetic Analyzer (Applied Biosystems) and analyzed for STR profiles via GeneMapper4.0 software (Applied Biosystems). The resulting STR profiles of the 5 cell lines were compared with the reference STR profiles in the Cellosaurus Cell Line Databases9,10 and the STR profiles generated via STRaM analysis.
Statistics and Reproducibility
All experiments were performed for at least two independent biological replicates. No statistical method was used to predetermine the sample size. No data were excluded from the analyses. The experiments were not randomized. Student’s t-test was used to analyze the data via GraphPad Prism software (in the Fig. 4C, D; Fig. 5D, I; Supplementary Fig. 7B, C). The data are presented as mean ± SEM shown in the figure legends.
Genomic coordinates
Genomic mapping and coordinates are based on the human reference genome GRCh38 (GCA_000001405.15_GRCh38_no_alt_analysis_set).
Reporting summary
Further information on research design is available in the Nature Portfolio Reporting Summary linked to this article.